Subscription Box Co-Packing Services Market Size and Share
Market Overview
| Study Period | 2020 - 2031 |
|---|---|
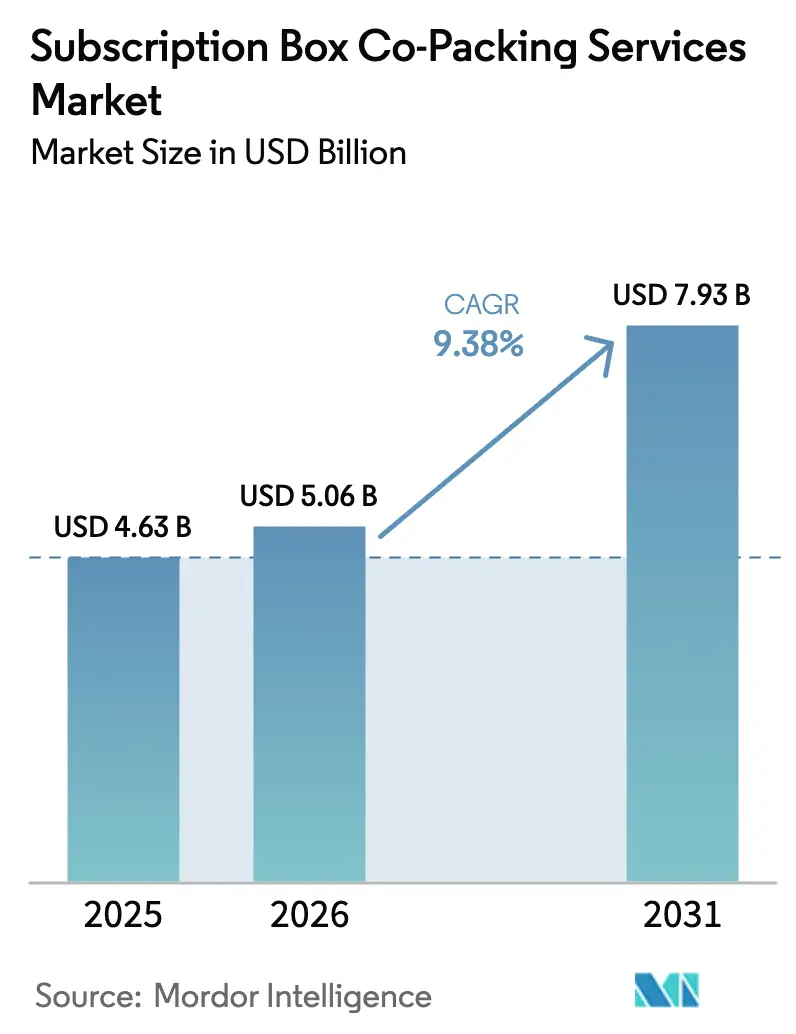
| Market Size (2026) | USD 5.06 Billion |
| Market Size (2031) | USD 7.93 Billion |
| Growth Rate (2026 - 2031) | 9.38% CAGR |
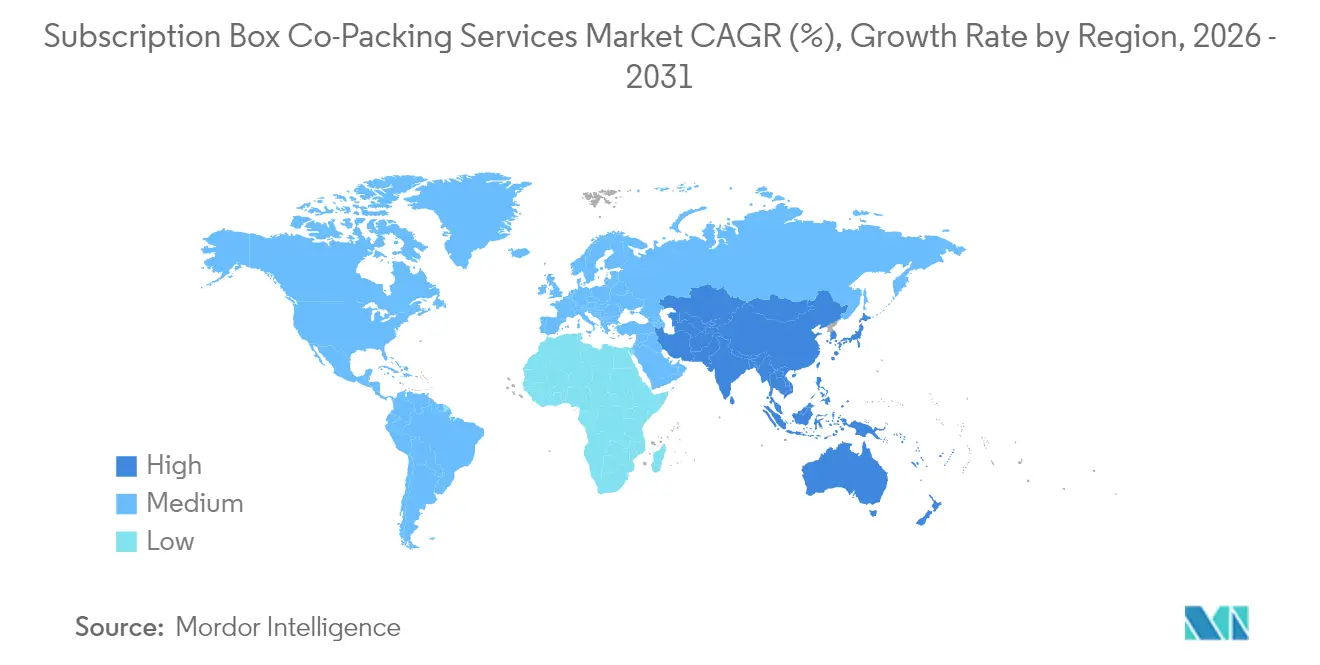
| Fastest Growing Market | Asia Pacific |
| Largest Market | North America |
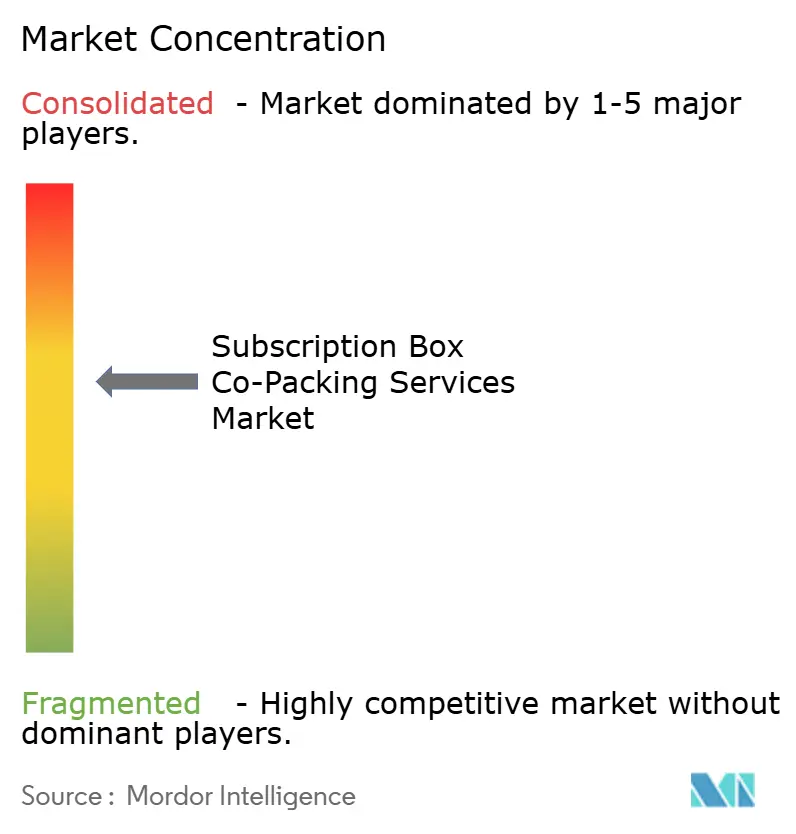
| Market Concentration | Medium |
Major Players *Disclaimer: Major Players sorted in no particular order Image © Mordor Intelligence. Reuse requires attribution under CC BY 4.0. | |
Subscription Box Co-Packing Services Market Analysis by Mordor Intelligence
The Subscription Box Co-Packing Services Market size was valued at USD 4.63 billion in 2025 and estimated to grow from USD 5.06 billion in 2026 to reach USD 7.93 billion by 2031, at a CAGR of 9.38% during the forecast period (2026-2031). Consistent expansion in direct-to-consumer commerce, the subscription economy’s march toward USD 1 trillion, and growing automation investment worth more than USD 50 billion per year are reinforcing the positive outlook for the subscription box co-packing services market. Kit assembly remains the economic backbone because most subscription programs need multi-SKU configurations to deliver a curated experience that secures customer loyalty. At the same time, brands are outsourcing fulfillment sooner, shortening payback periods on third-party automation and giving providers the scale to absorb packaging volatility without eroding margins. Sustainability mandates, such as the European Union’s 65% recyclability threshold, are accelerating the uptake of bioplastics, while robotics in kitting lines raises accuracy to 99.5%, a crucial factor for churn-sensitive subscription operators. Competitive heat is intensifying as leading firms fund multi-node networks near urban demand pockets, a strategy that compresses delivery time and embeds switching costs.
Key Report Takeaways
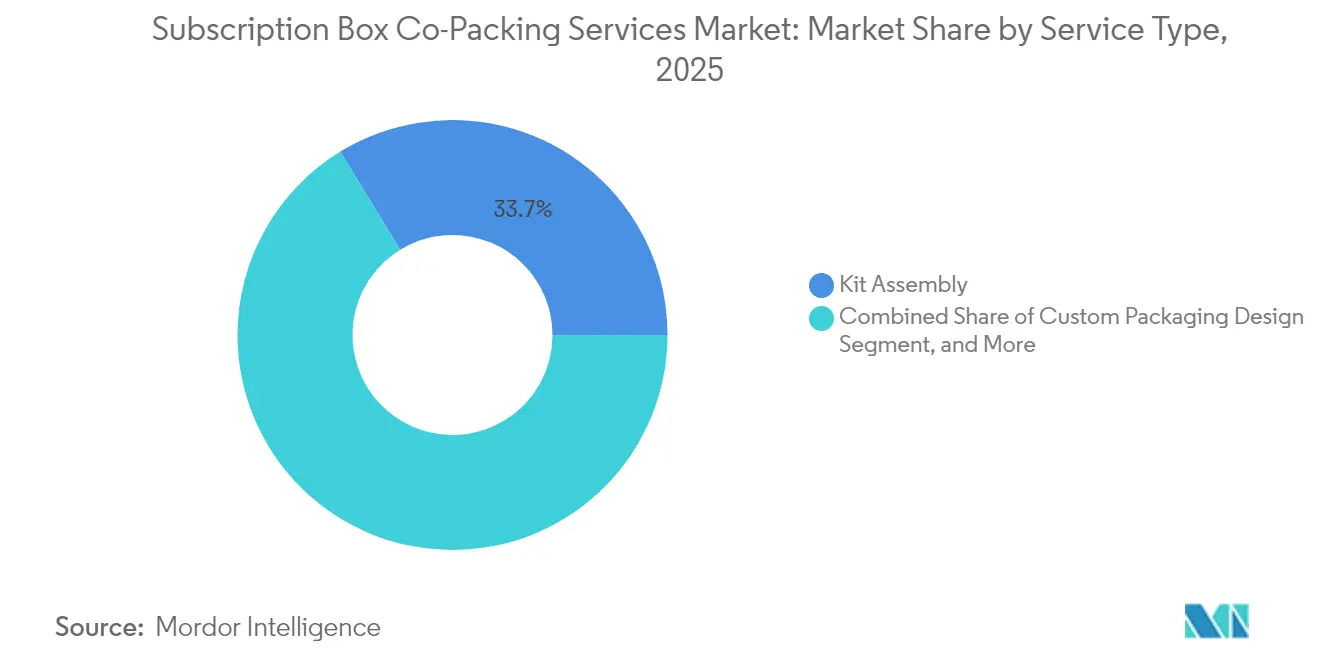
- By service type, kit assembly captured 33.74% of the subscription box co-packing services market share in 2025.
- By box category, the subscription box co-packing services market size for pet supplies is forecast to advance at a 10.58% CAGR through 2031.
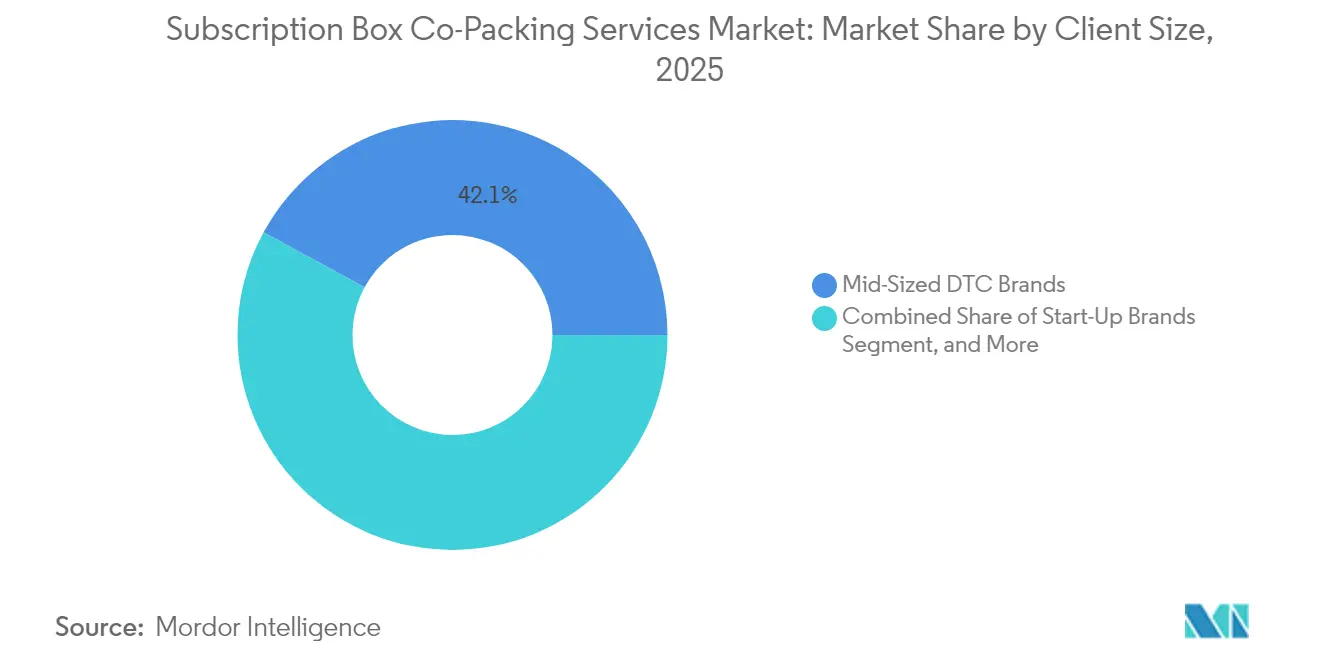
- By client size, mid-sized direct-to-consumer brands captured 42.08% of the subscription box co-packing services market share in 2025.
- By packaging material, the subscription box co-packing services market size for bioplastics is projected to grow at a 11.22% CAGR through 2031.
- By geography, North America captured 34.72% of the subscription box co-packing services market share in 2025.
Note: Market size and forecast figures in this report are generated using Mordor Intelligence’s proprietary estimation framework, updated with the latest available data and insights as of 2026.
Global Subscription Box Co-Packing Services Market Trends and Insights
Drivers Impact Analysis*
| Driver | (~) % Impact on CAGR Forecast | Geographic Relevance | Impact Timeline |
|---|---|---|---|
| Proliferation of E-Commerce Subscription Commerce | +2.8% | Global, with concentration in North America and Europe | Medium term (2-4 years) |
| Cost Reduction Push toward Outsourcing of Kitting and Fulfillment | +2.1% | Global, particularly strong in North America | Short term (≤ 2 years) |
| Advances in Automated Kitting and Robotics | +1.9% | North America and Europe, expanding to Asia-Pacific | Long term (≥ 4 years) |
| Sustainability Auditing Driving Demand for Certified Eco-Lines | +1.2% | Europe leading, followed by North America | Medium term (2-4 years) |
| Data-Driven Personalisation Integrated into Co-Packing Lines | +0.8% | Global, with early adoption in North America | Medium term (2-4 years) |
| VC-Backed Micro-Brands Scaling Globally Needing Multi-Node Networks | +0.7% | North America and Europe, emerging in Asia-Pacific | Short term (≤ 2 years) |
| Source: Mordor Intelligence | |||
Proliferation of E-Commerce Subscription Commerce
Recurring revenue models now outpace traditional e-commerce growth threefold, and brands lean on specialist partners to deliver reliable drop dates that preserve consumer trust.[1]Martin Coulter, “Subscription Economy Growth Trajectory Toward USD 1 Trillion by 2028,” Financial Times, ft.com Outsourcing happens early in a brand’s life because monthly curation needs complex pick-and-pack sequencing that internal teams cannot scale. Venture capital infusions worth USD 12.4 billion in 2024 added hundreds of micro-brands to the pipeline, creating a multi-year funnel of new business for the subscription box co-packing services market. Providers that integrate inventory data with consumer analytics enable precise personalization, which lifts retention by 5-7 percentage points. Compliance with negative-option billing rules makes robust tracking indispensable, so platforms that merge billing and fulfillment records gain a defensible advantage.
Cost Reduction Push Toward Outsourcing of Kitting and Fulfillment
Third-party operators deliver 25-40% direct cost savings through labor pooling and the heavy use of robotics, which elevates hourly throughput from fewer than 1,000 boxes in-house to over 10,000 boxes per day in high-volume hubs. Wage arbitrage further widens the gap as providers place facilities in secondary cities where blended labor costs hover around USD 18-22 per hour, well below the USD 28-35 typical at brand-run centers. Spreading USD 2-5 million in automation investments across multiple customers reduces capital intensity per client and accelerates the return on invested capital for the subscription box co-packing services market. Scale buying of corrugate and void fill shields clients from spot spikes, supporting predictable pricing structures that underpin subscription economics.
Advances in Automated Kitting and Robotics
Subscription workflows require precise multi-item sequencing, a process that robotic arms now manage with 99.5% accuracy, completing up to 500 boxes per hour, quadrupling manual output. Artificial intelligence optimizes bin placement and dynamically adapts pick paths when product assortments change, cutting walk time by 35%. Early adopters enjoy unit cost declines of 40-60%, which they trade for share gains and longer contracts, reinforcing concentration in the subscription box co-packing services market. Automated verification systems also safeguard allergen controls and regulatory labeling to mitigate compliance fines.
Sustainability Auditing Driving Demand for Certified Eco-Lines
Corporate net-zero commitments and consumer sentiment push brands to demand verifiable eco-labels on every component. Providers respond by securing ISO 14001 certification and shifting toward bioplastic mailers that satisfy the European Union’s 65% recyclability mandate due in 2025.[2]European Commission Staff, “Packaging and Packaging Waste Regulation Implementation,” European Commission, ec.europa.eu The economics align as recycled material premiums narrow, bringing bioplastics closer to cost parity with virgin plastics. The subscription box co-packing services market benefits because eco-certifications become a differentiator that justifies premium service fees.
Restraints Impact Analysis*
| Restraint | (~) % Impact on CAGR Forecast | Geographic Relevance | Impact Timeline |
|---|---|---|---|
| Fluctuating Shipping Costs and Supply-Chain Disruptions | -1.8% | Global, with acute impact on trans-Pacific routes | Short term (≤ 2 years) |
| Volatile Corrugated Board Prices | -1.2% | Global, particularly North America and Europe | Medium term (2-4 years) |
| Pending Regulation on Packaging Waste/Void-Fill | -0.9% | Europe leading, expanding globally | Long term (≥ 4 years) |
| Talent Shortage in Modular Kitting Engineering | -0.6% | North America and Europe | Medium term (2-4 years) |
| Source: Mordor Intelligence | |||
Fluctuating Shipping Costs and Supply-Chain Disruptions
Trans-Pacific freight swings between USD 2,800-4,200 for a forty-foot unit force providers to raise safety stock and invest in alternate routings, adding as much as 2 days of buffer that ties up working capital.[3]Review of Maritime Transport 2024, UNCTAD, unctad.org Port congestion and labor uncertainty erode the on-time delivery promise that underpins subscription stickiness, pushing churn up to 12%. Co-packers hedge risk by securing multi-carrier contracts and pre-clearing customs to shave dwell time, but margin compression persists.
Volatile Corrugated Board Prices
Corrugate cost inflation of 15-20% in 2024, traced to pulp and energy inputs, squeezes gross margins because packaging can hit 12% of service expenses. While larger operators hedge with long-term pulp commitments, smaller facilities must pass costs through, threatening client stickiness. Regulatory drives for higher recycled content command a 10-15% premium and complicate sourcing. Providers that vertically integrate design and procurement temper volatility but face higher balance-sheet requirements.
*Our forecasts treat driver/restraint impacts as directional, not additive. The impact forecasts reflect baseline growth, mix effects, and variable interactions.
Segment Analysis
By Service Type: Kit Assembly Underwrites Core Revenue
Kit assembly accounted for 33.74% of 2025 revenue and remains the mechanical heart of the subscription box co-packing services market. More than 78% of boxes carry multiple SKUs, so precise sequencing safeguards the unboxing moment that underpins customer loyalty. The segment’s scale gives providers negotiating power on consumables and labor deployment, reinforcing margins. Value-added services, such as sample insertion and returns triage, grow at a 10.57% CAGR as brands seek to differentiate themselves by layering experiential elements. Automation reduces per-unit cost curves, freeing capacity for premium workflows and expanding the subscription box co-packing services market size, which is tied to service breadth.
Parallel growth is emerging in custom package design, expanding at an annual rate of 8.09%, as social media amplifies the branding payback of unique wraps. Inventory management offerings are gaining traction at a 8.94% CAGR because seasonal box programs must right-size stock to curb obsolescence. Core FDA and cosmetic compliance services act as a moat, locking in high-margin accounts. Over the forecast, the service portfolio will shift toward intelligence-based add-ons that monetize data streams, from personalized recommendations to forecast APIs, embedding providers more deeply in brand value chains.


By Box Category: Beauty Leadership Meets Pet Supplies Acceleration
Beauty and personal care retained 27.28% of 2025 revenue, anchoring the subscription box co-packing services market share because curated sampling aligns with consumer discovery behavior. Box complexity is high, requiring item-level lot tracking and temperature-controlled zones to meet cosmetic integrity standards, which underpins premium pricing. Pet supplies rise at the fastest rate, with a 10.58% CAGR, as pet care spending expansion meets convenience preferences among owners who value scheduled replenishment. Subscription veterinary supplements add regulatory rigor, further advantaging specialized co-packers.
Food and beverage boxes grow 8.55% due to resilient demand for artisanal snacks and ready-to-drink items, but perishability constrains the fulfillment radius and inflates cold-chain costs, limiting provider participation. Fashion and accessories post 7.74% expansion, aided by rental and resale models that need meticulous reverse logistics workflows. Books and media persist as a niche, advancing 5.08% CAGR, where limited format variety supports straightforward kitting. Category diversity cushions cyclical risk, ensuring consistent throughput for the subscription box co-packing services market.
By Client Size: Mid-Sized Brands Dominate While Start-Ups Surge
Mid-sized direct-to-consumer players accounted for 42.08% of 2025 revenue, as their scale strikes a balance between efficiency and the need for outsourced expertise. These clients place 10,000-200,000 boxes monthly, volumes that maximize automation throughput without overtaxing slot capacity. They sign multi-year contracts that stabilize the subscription box co-packing services market size and justify capital expenditure on robotics. Start-ups outpace the market at 10.82% CAGR, propelled by venture backing that prioritizes speed to market over in-house control. Providers supply modular service bundles that grow with order volume, building lifetime value from early engagement.
Large enterprises contribute 27.94% but expand just 7.62% because many can fund captive networks or secure direct logistics partnerships. Marketplace platforms capture a 15.08% share, utilizing co-packers as pooled nodes that serve dispersed micro-brands. Compliance segments, particularly those in the pharmaceutical industry, prioritize specialist partners with FDA registration, further segmenting the subscription box co-packing services market and sustaining premium yields.
By Packaging Material: Corrugated Dominance Faces Sustainable Innovation
Corrugated cartons delivered a 50.62% share in 2025 and remain the pragmatic choice due to strength-to-weight balance and easy recyclability. Dynamic die-cutting lowers void space and shipping charges, containing cost volatility. Bioplastics scale fastest at an 11.22% CAGR because brands align their packaging with ESG commitments and regulatory carrots, such as reduced extended producer responsibility fees. Price gaps are narrowing, and subsidy programs in the European Union hasten parity.
Rigid paperboard holds a 23.58% share for premium beauty and luxury boxes that need structural integrity and tactile appeal. Recycled materials gain 18.93% market share due to growing consumer scrutiny of waste footprints. Innovative solutions, such as molded fiber trays and dissolvable void fill, expand adoption among eco-conscious brands. Material diversification enables the subscription box co-packing services market to tailor packaging architecture to a brand's position while hedging supply risk.
Geography Analysis
North America led with a 34.72% share in 2025 as mature subscription penetration and high average household spend of USD 273 per month sustained consistent volume throughput. The United States drives 78% of regional demand, benefiting from a dense fulfillment infrastructure that shortens last-mile distances and lowers unit shipping costs. Canada and Mexico combine for 22% of regional boxes, supported by cross-border harmonization in customs filing and bilingual packaging workflows. Urban clusters, such as New York, Los Angeles, and Chicago, generate the bulk of orders. Therefore, co-packers cluster their facilities within 50 miles of these metropolitan areas to secure same-day handoff windows.
The Asia-Pacific region records the strongest 9.98% CAGR, underpinned by a USD 2.9 trillion e-commerce base and 16.8% annual growth in subscriptions. China accounts for 42% of regional revenue, where the ubiquity of mobile payments and social shopping fuels adoption. Japan’s 23% share reflects its long-standing gift subscription culture, while India’s 18% share is driven by the rise of middle-income households and logistics modernization. Southeast Asia’s collective 17% demonstrates catch-up potential as cross-border trade initiatives streamline flows. Providers partner with local last-mile networks to navigate fragmented addresses and cash-on-delivery preferences. Currency volatility and customs clearance complexities raise working capital needs, but gross margin potential remains attractive.
Europe holds 28.54% of global revenue, enabled by consumer protection norms that favor transparent subscription delivery. Germany, the United Kingdom, and France collectively contribute 58% of regional demand, leveraging advanced parcel networks and high credit card penetration. The European Union’s Packaging and Packaging Waste Regulation incentivizes co-packers with certified eco-lines, reinforcing a quality ethos across the subscription box co-packing services market. Cross-border VAT compliance can complicate operations, so providers often deploy centralized tax engines and offer multilingual customer service. Eastern Europe is emerging as a cost-efficient fulfillment locale, with Poland becoming a near-shore hub that meets Western European demand.

Competitive Landscape
The top five providers control roughly 35% of 2025 revenue, making the subscription box co-packing services market moderately fragmented. Entrants differentiate themselves through vertical specialization, such as temperature-controlled beauty or pet nutrition lines, rather than solely through price. ShipMonk, valued at USD 4 billion pre-IPO, and ShipBob, fresh from a USD 200 million fundraise, invest cash in dense multi-node networks that place centers within 50 miles of 78% of subscribers, thereby trimming transit time and reducing carbon miles.
Automation budgets between USD 2-5 million per site underpin 40-60% cost advantages over manual peers, raising the barrier to entry. Machine learning demand-forecast modules reduce stockouts by 25% and drive 15-25% inventory efficiency gains, lowering client working capital. White-space growth areas include pharmaceutical and regulated supplements, where FDA registration confers scarcity value. Providers cultivate partnerships with packaging designers and marketing agencies to capture a larger share of brand spend.
Acquisition appetite is rising as logistics incumbents add specialized kitting to their portfolios; DHL Supply Chain’s purchase of Floship for USD 85 million extends beauty-focused capacity into the Asia-Pacific region. Amazon’s step into subscription kitting through its FBA service puts pressure on independent players to sharpen service depth and personalization features. Competitive positioning now hinges on three pillars: geographic density, automation sophistication, and compliance breadth.
Subscription Box Co-Packing Services Industry Leaders
ShipMonk Inc.
ShipBob Inc.
The Fulfillment Lab Inc.
Saddle Creek Logistics Services Inc.
ShipHero LLC
- *Disclaimer: Major Players sorted in no particular order

Recent Industry Developments
- October 2024: ShipMonk announced plans for an IPO at a USD 4 billion valuation, earmarking proceeds for European expansion and robotics upgrades.
- September 2024: ShipBob closed a USD 200 million Series E led by SoftBank Vision Fund to grow to 45 centers worldwide.
- August 2024: Amazon extended its Fulfillment by Amazon offer to subscription box brands, bundling kitting, personalization, and multi-channel inventory sync.
- July 2024: DHL Supply Chain acquired Floship Limited for USD 85 million, deepening beauty and personal care capabilities across Asia-Pacific.


Global Subscription Box Co-Packing Services Market Report Scope
| Kit Assembly |
| Custom Packaging Design |
| Inventory Management |
| Multi-Channel Fulfillment |
| Value-Added Services (Inserts, Samples, Returns) |
| Food and Beverage |
| Beauty and Personal Care |
| Fashion and Accessories |
| Pet Supplies |
| Books and Media |
| Other Box Categories |
| Start-Up Brands |
| Mid-Sized DTC Brands |
| Large Enterprises |
| Marketplace Subscription Platforms |
| Corrugated |
| Rigid Paperboard |
| Bioplastics |
| Recycled Materials |
| Other Packaging Materials |
| North America | United States | |
| Canada | ||
| Mexico | ||
| South America | Brazil | |
| Argentina | ||
| Rest of South America | ||
| Europe | Germany | |
| United Kingdom | ||
| France | ||
| Italy | ||
| Spain | ||
| Russia | ||
| Rest of Europe | ||
| Asia-Pacific | China | |
| Japan | ||
| India | ||
| South Korea | ||
| South-East Asia | ||
| Rest of Asia-Pacific | ||
| Middle East and Africa | Middle East | Saudi Arabia |
| United Arab Emirates | ||
| Turkey | ||
| Rest of Middle East | ||
| Africa | South Africa | |
| Nigeria | ||
| Rest of Africa | ||
| By Service Type | Kit Assembly | ||
| Custom Packaging Design | |||
| Inventory Management | |||
| Multi-Channel Fulfillment | |||
| Value-Added Services (Inserts, Samples, Returns) | |||
| By Box Category | Food and Beverage | ||
| Beauty and Personal Care | |||
| Fashion and Accessories | |||
| Pet Supplies | |||
| Books and Media | |||
| Other Box Categories | |||
| By Client Size | Start-Up Brands | ||
| Mid-Sized DTC Brands | |||
| Large Enterprises | |||
| Marketplace Subscription Platforms | |||
| By Packaging Material | Corrugated | ||
| Rigid Paperboard | |||
| Bioplastics | |||
| Recycled Materials | |||
| Other Packaging Materials | |||
| By Geography | North America | United States | |
| Canada | |||
| Mexico | |||
| South America | Brazil | ||
| Argentina | |||
| Rest of South America | |||
| Europe | Germany | ||
| United Kingdom | |||
| France | |||
| Italy | |||
| Spain | |||
| Russia | |||
| Rest of Europe | |||
| Asia-Pacific | China | ||
| Japan | |||
| India | |||
| South Korea | |||
| South-East Asia | |||
| Rest of Asia-Pacific | |||
| Middle East and Africa | Middle East | Saudi Arabia | |
| United Arab Emirates | |||
| Turkey | |||
| Rest of Middle East | |||
| Africa | South Africa | ||
| Nigeria | |||
| Rest of Africa | |||


Key Questions Answered in the Report
How large will the subscription box co-packing services market be by 2031?
Forecasts indicate revenue of USD 7.93 billion by 2031, guided by a 9.38% CAGR.
Which service type delivers the most value for brands?
Kit assembly remains the largest contributor at 33.74% of 2025 revenue, backed by automation that trims per-unit costs.
Which box category is growing fastest?
Pet supplies boxes show the highest growth at a projected 10.58% CAGR through 2031 due to expanding global pet care spending.
Why are brands outsourcing fulfillment earlier?
Outsourcing cuts operational costs by up to 40% and provides access to robotics and global networks without large capital outlays.
Which region represents the biggest near-term opportunity?
Asia-Pacific posts the fastest regional CAGR at 9.98%, driven by rapid e-commerce adoption, rising incomes, and mobile shopping penetration.
Page last updated on:


