Connected Packaging Market Size and Share
Market Overview
| Study Period | 2020 - 2031 |
|---|---|
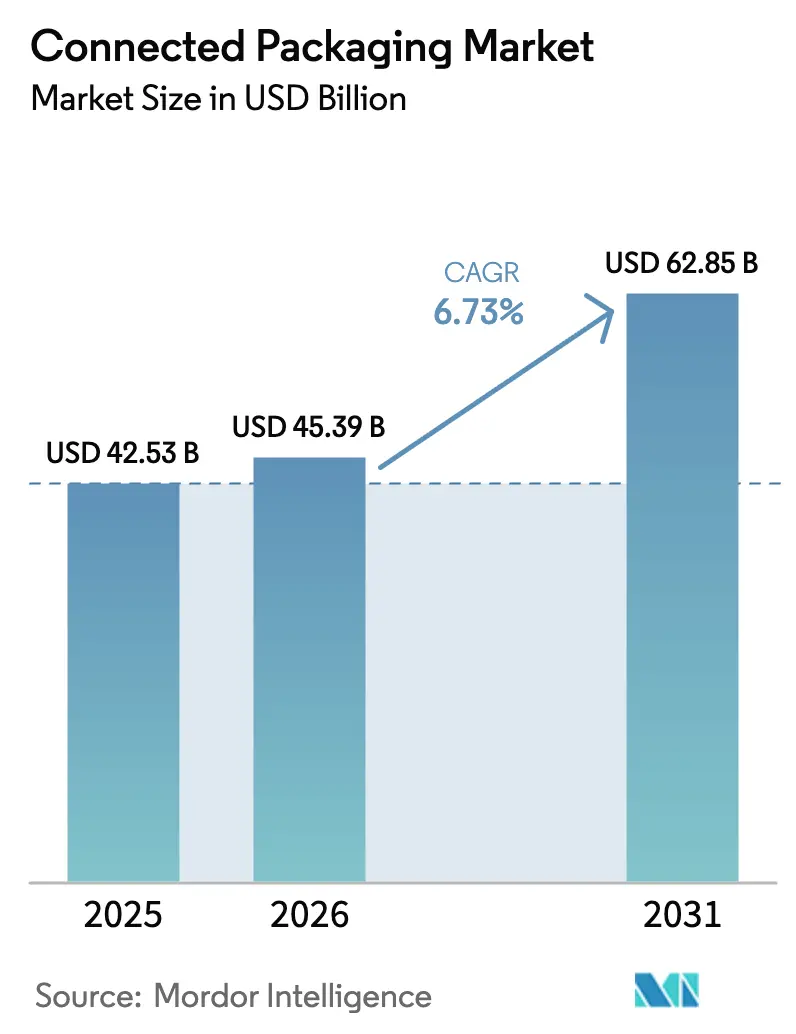
| Market Size (2026) | USD 45.39 Billion |
| Market Size (2031) | USD 62.85 Billion |
| Growth Rate (2026 - 2031) | 6.73% CAGR |
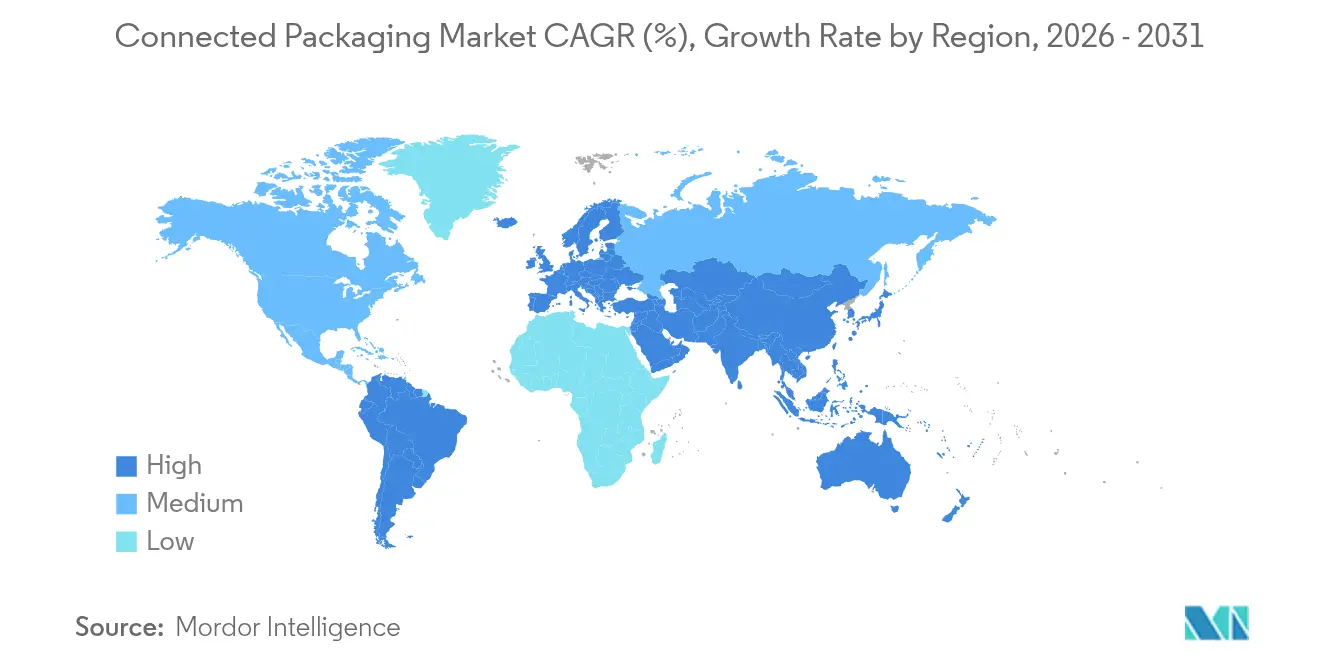
| Fastest Growing Market | Asia Pacific |
| Largest Market | North America |
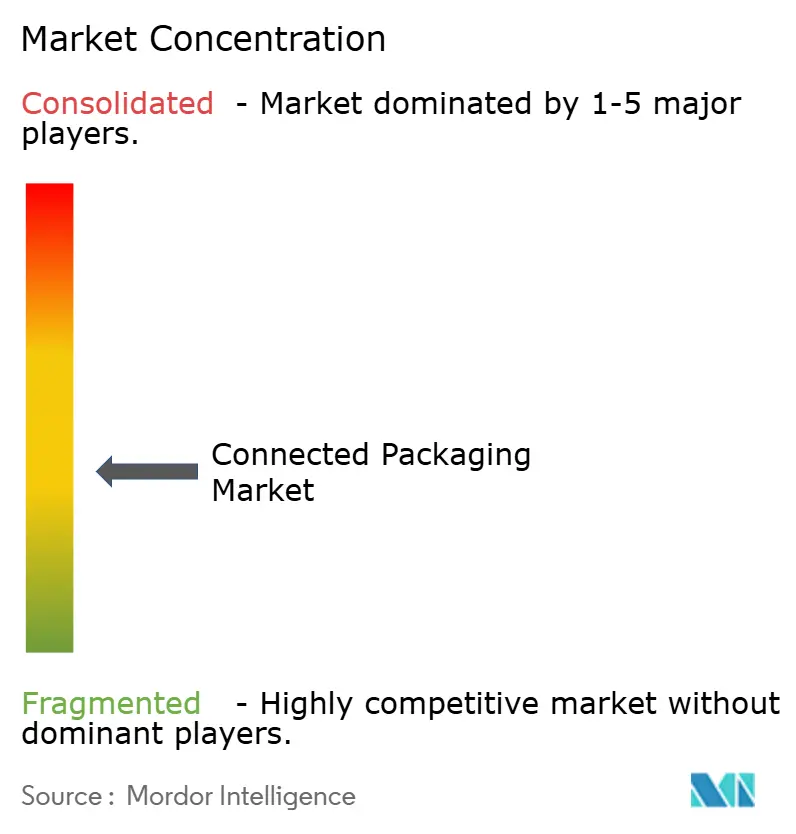
| Market Concentration | Medium |
Major Players *Disclaimer: Major Players sorted in no particular order Image © Mordor Intelligence. Reuse requires attribution under CC BY 4.0. | |
Connected Packaging Market Analysis by Mordor Intelligence
The connected packaging market size is expected to grow from USD 42.53 billion in 2025 to USD 45.39 billion in 2026 and is forecast to reach USD 62.85 billion by 2031 at 6.73% CAGR over 2026-2031.Momentum stems from converging regulatory mandates such as the European Union’s Digital Product Passport (DPP) and India’s QR-code requirements, rapid maturation of QR, RFID, and BLE technologies, and mounting consumer demand for transparent, low-impact products[1]European Commission, “Commission Launches Consultation on the Digital Product Passport,” single-market-economy.ec.europa.eu.Pharmaceutical serialization successes are spilling into luxury goods and food, while blockchain-enabled deposit-return pilots demonstrate fresh revenue models for converters. Retailers in North America increasingly require real-time inventory analytics, and corrugated price inflation is hastening the shift toward data-rich logistics packaging. Together, these forces position the connected packaging market for sustained mid-single-digit growth through 2030.
Key Report Takeaways
- By connectivity technology, QR codes held 49.85% of connected packaging market share in 2025; BLE beacons are projected to expand at a 10.29% CAGR to 2031.
- By type, intelligent packaging led with 45.12% revenue share in 2025, while active packaging is forecast to grow at 9.45% CAGR through 2031.
- By end-use industry, pharmaceuticals accounted for an 10.81% CAGR, outperforming food and beverage’s 30.26% market share leadership in 2025.
- By packaging level, tertiary formats are set to grow fastest at an 8.67% CAGR to 2031, even though primary packaging commanded 60.02% of connected packaging market size in 2025.
- By geography, North America contributed 38.02% revenue share in 2025; Asia-Pacific is advancing at a 9.79% CAGR through 2031.
Note: Market size and forecast figures in this report are generated using Mordor Intelligence’s proprietary estimation framework, updated with the latest available data and insights as of 2026.
Global Connected Packaging Market Trends and Insights
Drivers Impact Analysis*
| Driver | (~) % Impact on CAGR Forecast | Geographic Relevance | Impact Timeline |
|---|---|---|---|
| Sustainability-linked regulations push digital product passports | +1.8% | Global (EU leading) | Medium term (2-4 years) |
| Brand-owner pivot to anti-counterfeit traceability mandates | +1.2% | Global luxury goods & pharmaceuticals | Short term (≤ 2 years) |
| Post-COVID QR code literacy among Gen-Z consumers | +0.9% | North America & EU, expanding to APAC | Short term (≤ 2 years) |
| Retailer demand for real-time inventory analytics | +0.7% | North America & EU | Medium term (2-4 years) |
| Inclusive “Accessible-QR” for visually-impaired shoppers | +0.3% | EU & North America | Long term (≥ 4 years) |
| Blockchain-enabled circular-economy deposit return systems | +0.4% | EU pilots, global expansion | Long term (≥ 4 years) |
| Source: Mordor Intelligence | |||
Sustainability-Linked Regulations Push Digital Product Passports
The EU Ecodesign for Sustainable Products Regulation is redefining packaging priorities by mandating unique identifiers that carry granular lifecycle data for most goods sold in the bloc by 2027. Manufacturers that integrate DPP capabilities early can offer real-time provenance, recyclability information, and circular business models. Tetra Pak’s Connected Package platform already converts cartons into data carriers, providing origin details and recycling prompts at point-of-use. Ongoing consultations extend through July 2025, giving early movers technical influence and time to scale compliant solutions.
Brand-Owner Pivot to Anti-Counterfeit Traceability Mandates
India now requires QR codes on 300 top-selling medicines, reinforcing the shift toward digital anti-counterfeit safeguards. Luxury brands and food manufacturers are following suit; HEBE LIFE uses dual-QR tamper-evident labels that authenticate each unit while streaming supply-chain data to cloud dashboards. Digimarc has commercialized mobile-based watermark authentication that lets stakeholders verify products without added hardware, responding to a USD 500 billion counterfeiting threat.
Post-COVID QR Code Literacy Among Gen-Z Consumers
Touchless menus normalized QR codes, and Gen-Z now scans packaging instinctively. Coca-Cola’s 2025 “Share a Coke” revival lets users personalize cans via on-pack QR links, capturing opt-in engagement metrics unreachable with static labeling. Beauty brands embed QR-driven loyalty mechanics, while Persil’s Accessible-QR codes demonstrate how inclusivity widens adoption in mature markets.
Retailer Demand for Real-Time Inventory Analytics
Golden State Foods’ RAIN RFID rollout delivered end-to-end cold-chain visibility, prompting other retailers to demand similar telemetry[2]GS1 US, “Foodservice Supplier Delivers Visibility with a Side of Innovation,” gs1us.org .In India, Uflex’s BLE beacon deployment cut inventory management effort by 80% and slashed customer complaints 40%, illustrating why brand-owner mandates now cascade down supply networks.
Restraints Impact Analysis*
| Restraint | (~) % Impact on CAGR Forecast | Geographic Relevance | Impact Timeline |
|---|---|---|---|
| High upfront CAPEX for converting legacy lines | -1.4% | Global manufacturing hubs | Short term (≤ 2 years) |
| Data-privacy compliance (GDPR, CPRA) complexities | -0.8% | EU & California | Medium term (2-4 years) |
| Fragmented global recycling infrastructure | -0.6% | Global (developing markets acute) | Long term (≥ 4 years) |
| Interoperability gaps among NFC/RFID/QR ecosystems | -0.5% | Global | Medium term (2-4 years) |
| Source: Mordor Intelligence | |||
High Upfront CAPEX for Converting Legacy Lines
Material inflation compounds digital upgrade costs. Corrugated prices rose USD 70 per ton in January 2025, while chemicals and pulp surged 30% and 50% respectively, stretching converter capital budgets [3]Packaging Corporation of America, “Navigating the USD 70/Ton Corrugated Price Increase,” cepkg.com. Amcor’s Lift-Off fund now offers USD 250,000–500,000 investments to help partners pilot connected lines without bearing full CAPEX, illustrating alternative financing models.
Data-Privacy Compliance (GDPR, CPRA) Complexities
Connected packs collect consumer behavior, location, and environmental data. Harmonizing EU GDPR with California’s CPRA forces brands to embed privacy-by-design, layering cryptographic methods such as zero-knowledge proofs used by Circularise’s DPP platform to conceal commercially sensitive data while preserving traceability. Compliance adds cost and elongates deployment timelines but remains non-negotiable in regulated sectors.
*Our forecasts treat driver/restraint impacts as directional, not additive. The impact forecasts reflect baseline growth, mix effects, and variable interactions.
Segment Analysis
By Type: Intelligence Drives Active Innovation
Intelligent packaging captured 45.12% of 2025 revenue, underpinned by QR and RFID sensors that feed real-time freshness and provenance data into brand apps. The segment benefits from falling sensor costs and universal smartphone penetration, reinforcing its central role in the connected packaging market. Active packaging is smaller today yet expanding at 9.45% CAGR, boosted by shelf-life-extending oxygen scavengers and antimicrobial films that mitigate food waste. Tetra Pak’s smart carton with antioxidant layers reduced climate-change impact 29.17% versus conventional packs even though unit cost rose 38.66%.Hybrid solutions blending active barriers with intelligent monitoring are emerging. Stora Enso’s dry-formed fiber packs integrate printed electronics during molding, shrinking water and energy use while enabling scannable IDs for recycling automation. These cross-functional formats will expand the connected packaging market as brands monetize shelf-life gains and data streams simultaneously. Flexible converters able to co-design functional substrates and embedded IDs stand to unlock premium pricing.


By Connectivity Technology: BLE Beacons Accelerate Beyond QR Dominance
QR codes remain ubiquitous, commanding 49.85% of 2025 revenue thanks to zero incremental cost and entrenched consumer familiarity. GS1’s multi-company drive to swap linear barcodes for scannable 2D codes by 2027 will further secure QR leadership. Yet BLE beacons are set to grow fastest at 10.29% CAGR. Their sub-USD 2 smart label price point, announced by Identiv for late-2025 rollout, makes item-level tracking economically viable in temperature-controlled logistics. For high-value SKUs, NFC persists because of secure element integration but its premium pricing limits mass rollout.
Digital watermarks are carving a niche in automated recycling; Digimarc’s GPU-optimized sortation software cut MRF costs nearly 50% while hitting 99% detection accuracy. As converters aim for closed-loop targets, expect dual-ID packs pairing consumer-facing QR with machine-read watermarks, reinforcing the connected packaging market’s layered technology architecture.
By End-Use Industry: Pharmaceuticals Outpace Food Leadership
Food and beverage retained 30.26% revenue share in 2025 through QR-based ingredient storytelling and refillable-bottle traceability pilots by Coca-Cola Brazil. However, pharmaceutical mandates propel an 10.81% CAGR, the highest among tracked industries. Serialization proved effective against parallel trading and recalls, and the connected packaging market size for pharmaceuticals now extends to temperature monitoring and adherence reminders via e-paper labels from Ynvisible Interactive.
Personal care brands deploy NFC for authenticity and loyalty while electronics players embed connected cartons for warranty activation. Tier-two industrial sectors are exploring BLE pallets for uptime analytics. Collectively, these varied use cases diversify revenue and shield the connected packaging industry from sector-specific shocks.

By Packaging Level: Tertiary Gains Through Logistics Optimization
Primary packs account for 60.02% of connected packaging market size owing to direct consumer engagement and mandatory labeling rules. Yet tertiary formats pallets, totes, and shipping cartons are outpacing with an 8.67% CAGR thanks to e-commerce fulfillment complexity. Avery Dennison’s Saga Card IoT device exemplifies high-value tertiary innovation, combining cellular connectivity, sensors, and cloud analytics to safeguard biologics across supply lanes.Secondary packaging acts as the conduit between item-level IDs and pallet-level gateways, frequently via passive UHF RFID. Integrated hierarchies linking all three levels are becoming a standard feature of enterprise resource-planning upgrades, reinforcing stickiness in software-hardware ecosystems.
Geography Analysis
North America generated 38.02% of 2025 revenue on the back of retailer pressure and California’s SB 54 recycling mandate, which elevates demand for traceability-enabled plastics. Implementation momentum intensified after Gen-Z adoption of QR and frictionless checkout systems in the United States and Canada. Europe ranks second, anchored by the DPP regulation, advanced deposit-return infrastructure, and accessible-code standards, creating uniform expectations across member states.
Asia-Pacific is the fastest-growing region at 9.79% CAGR. India’s July 2025 QR-on-plastic rule codifies traceability for both domestic and export-focused manufacturers. Thailand’s label-free PET bottles trim material waste, reinforcing demand for digital identifiers printed directly on resin packages. Regional electronics, textiles, and nutraceutical exporters adopt connected formats to satisfy European import requirements, driving a network effect that lifts the connected packaging market.
South America and the Middle East & Africa remain nascent yet strategically significant. Brand owners roll out pilot QR campaigns in Brazil and the Gulf Cooperation Council to curb counterfeit personal-care imports. Quebec’s digital passport initiative, unveiled at Hannover Fair 2025, shows how provincial governments outside the EU are aligning export documentation with impending European standards. This alignment will gradually harmonize traceability expectations across trade corridors, lowering integration barriers for global suppliers.

Competitive Landscape
The market shows medium concentration. Established converters Amcor, Tetra Pak, Huhtamaki exploit installed filling lines and global service networks to upsell intelligence modules. Technology-centric players such as Digimarc, Avery Dennison, Wiliot, and Identiv monetize proprietary IP around watermarks, RFID ICs, and edge sensors. Consolidation is accelerating; Amcor’s USD 24 billion all-stock merger with Berry Global pools USD 180 million annual R&D, supporting integrated RFID-label substrates and recycled-content smart films.
Strategic collaborations flourish. Polytag paired UV watermarks with Pellenc ST’s optical sorters to generate packaging fingerprints readable at material-recovery facilities, aligning with DPP data fields. r-pac CNCT and SharpEnd packaged digital passports for Moose Knuckles apparel, adding resale enablement and care content to compliance payloads. Innovators like SMX (Security Matters) apply molecular tracers and blockchain hashes to NFC chips, bolstering device provenance for high-value electronics.
The competitive moat increasingly depends on interoperability. Vendors offering multi-protocol ID stacks with cloud connectors gain preference from consumer-packaged-goods (CPG) leaders seeking one-stop integration partners. Those limited to a single technology risk relegation to niche deployments.
Connected Packaging Industry Leaders
Huhtamäki Oyj
Tetra Pak
Avery Dennison
Sonoco Products
Amcor plc
- *Disclaimer: Major Players sorted in no particular order

Recent Industry Developments
- June 2025: r-pac CNCT, SharpEnd, and Moose Knuckles showcased a consumer-facing Digital Product Passport at the Global Fashion Summit.
- May 2025: Polytag merged UV watermark tech with Pellenc ST sorting lines to enhance recycling traceability.
- May 2025: Identiv and InPlay began co-developing next-gen BLE smart labels priced at USD 1-2 for high-volume logistics.
- April 2025: Amcor and Berry Global announced an all-stock merger to form a USD 24 billion packaging leader, earmarking USD 650 million in annual synergies.
- April 2025: UPM Raflatac became the first labeler to embed product carbon footprints in customer quotes.


Global Connected Packaging Market Report Scope
Connected packaging encompasses a range of solutions, including active, interactive, and intelligent packaging. This innovative approach allows product packaging to forge a direct link between brands and consumers, utilizing the technology. Through this connection, brands can relay everything from essential product information to engaging augmented reality experiences. Key activation points in connected packaging include QR codes, NFC chips, RFID, and other technology. Their usage, however, varies across industries, product types, and specific use cases. With the majority of smartphones now equipped to natively read barcodes and engage with these technologies, brands find it easier than ever to connect with their customers.
The connected packaging market is segmented by type (active packaging, interactive packaging, and intelligent packaging), by technology (QC code, NFC, RFID, and other technology), by end-user (food & beverage, pharmaceuticals, home care & personal care, consumer electronics, and other end-use industry) and by geography (North America (United States and Canada), Europe (United Kingdom, Germany, France, and Rest of Europe), Asia Pacific (China, Japan, India, and Rest of Asia Pacific), Latin America (Brazil, Mexico, and Rest of Latin America), and Middle East and Africa (United Arab Emirates, Saudi Arabia, South Africa, and Rest of Middle East and Africa)). The market sizes and forecasts are provided in terms of value (USD) for all the above segments.
| Active Packaging |
| Intelligent Packaging |
| Interactive Packaging |
| QR Codes |
| NFC Tags |
| RFID |
| Digital Watermarks |
| BLE Beacons |
| Food and Beverage |
| Pharmaceuticals |
| Personal Care and Cosmetics |
| Consumer Electronics |
| Other End-Use Industry |
| Primary Packaging |
| Secondary |
| Tertiary Packaging |
| North America | United States | |
| Canada | ||
| Mexico | ||
| Europe | Germany | |
| United Kingdom | ||
| France | ||
| Italy | ||
| Spain | ||
| Russia | ||
| Rest of Europe | ||
| Asia-Pacific | China | |
| India | ||
| Japan | ||
| South Korea | ||
| Australia and New Zealand | ||
| Rest of Asia-Pacific | ||
| Middle East and Africa | Middle East | United Arab Emirates |
| Saudi Arabia | ||
| Turkey | ||
| Rest of Middle East | ||
| Africa | South Africa | |
| Nigeria | ||
| Egypt | ||
| Rest of Africa | ||
| South America | Brazil | |
| Argentina | ||
| Rest of South America | ||
| By Type | Active Packaging | ||
| Intelligent Packaging | |||
| Interactive Packaging | |||
| By Connectivity Technology | QR Codes | ||
| NFC Tags | |||
| RFID | |||
| Digital Watermarks | |||
| BLE Beacons | |||
| By End-Use Industry | Food and Beverage | ||
| Pharmaceuticals | |||
| Personal Care and Cosmetics | |||
| Consumer Electronics | |||
| Other End-Use Industry | |||
| By Packaging Level | Primary Packaging | ||
| Secondary | |||
| Tertiary Packaging | |||
| By Geography | North America | United States | |
| Canada | |||
| Mexico | |||
| Europe | Germany | ||
| United Kingdom | |||
| France | |||
| Italy | |||
| Spain | |||
| Russia | |||
| Rest of Europe | |||
| Asia-Pacific | China | ||
| India | |||
| Japan | |||
| South Korea | |||
| Australia and New Zealand | |||
| Rest of Asia-Pacific | |||
| Middle East and Africa | Middle East | United Arab Emirates | |
| Saudi Arabia | |||
| Turkey | |||
| Rest of Middle East | |||
| Africa | South Africa | ||
| Nigeria | |||
| Egypt | |||
| Rest of Africa | |||
| South America | Brazil | ||
| Argentina | |||
| Rest of South America | |||


Key Questions Answered in the Report
What is the current size and growth outlook of the connected packaging market?
The connected packaging market is valued at USD 45.39 billion in 2026 and is projected to reach USD 62.85 billion by 2031, reflecting a 6.73% CAGR during 2026-2031.
Which technology is growing fastest within connected packaging?
Bluetooth Low Energy (BLE) beacons are the fastest-growing technology segment, expanding at a 10.29% CAGR due to real-time tracking benefits and falling smart-label costs.
How are regulations influencing connected packaging adoption?
Mandates such as the EU Digital Product Passport and India’s QR code rule require granular product-level data, prompting brands to integrate QR, RFID, and blockchain identifiers into packaging.
Which end-use industry offers the highest growth potential?
Pharmaceuticals lead with an 10.81% forecast CAGR because serialization and anti-counterfeit regulations make connected packaging compulsory across drug supply chains.
What barriers slow connected packaging deployment?
Key restraints include high capital expenditure for retrofitting legacy lines, complex data-privacy compliance, patchy recycling infrastructure, and interoperability gaps among NFC, RFID, and QR systems.
Who are the major players in the connected packaging space?
Market leaders include Amcor, Tetra Pak, Huhtamaki, Digimarc, Avery Dennison, and Wiliot, each leveraging scale or proprietary technology to deliver integrated connected solutions.
Page last updated on:


