E-Commerce Prep And Compliance Packaging Services Market Size and Share
Market Overview
| Study Period | 2020 - 2031 |
|---|---|
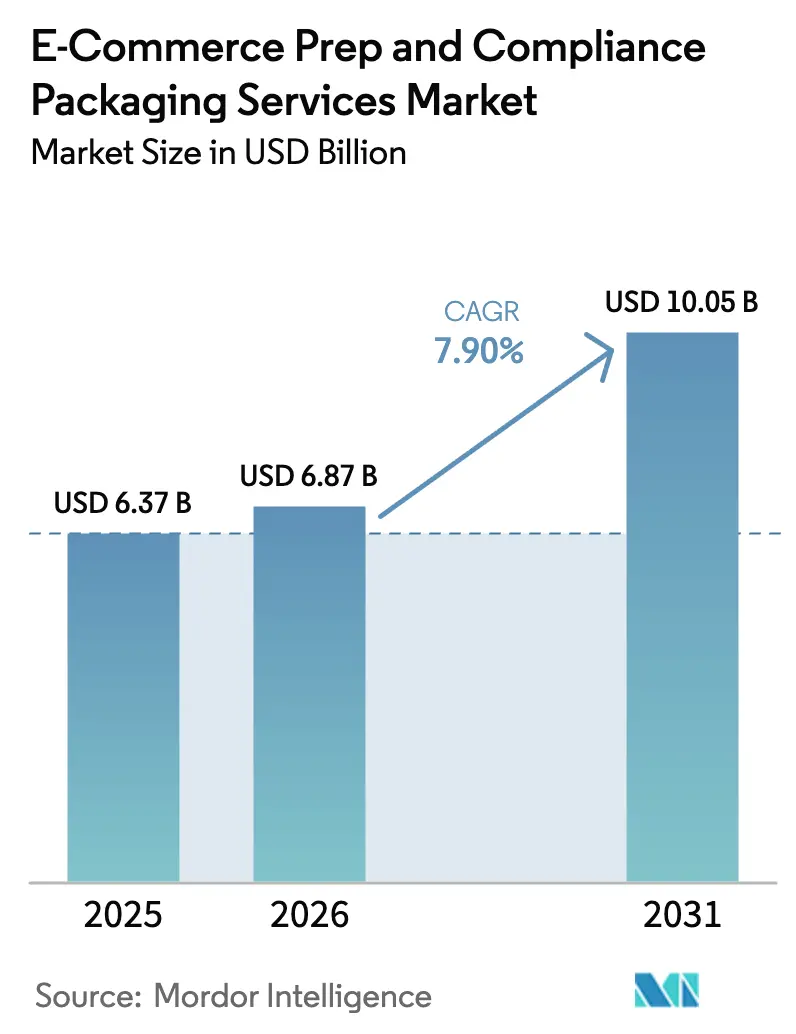
| Market Size (2026) | USD 6.87 Billion |
| Market Size (2031) | USD 10.05 Billion |
| Growth Rate (2026 - 2031) | 7.90% CAGR |
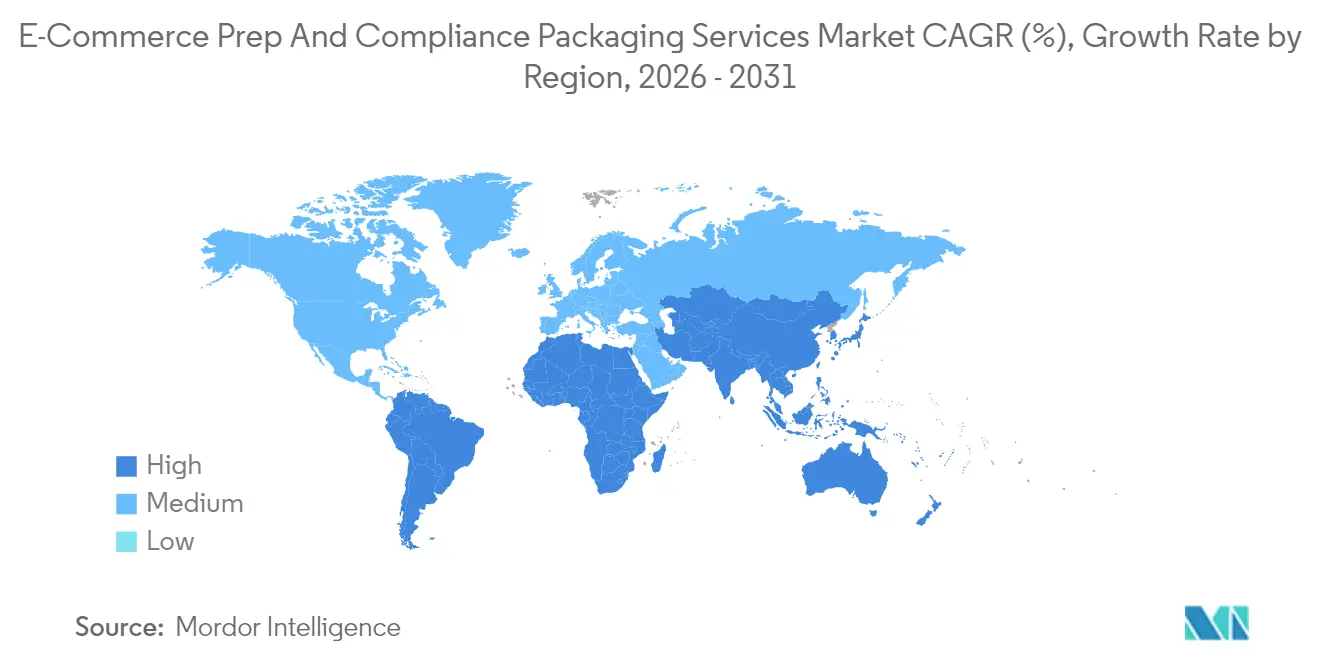
| Fastest Growing Market | Asia Pacific |
| Largest Market | North America |
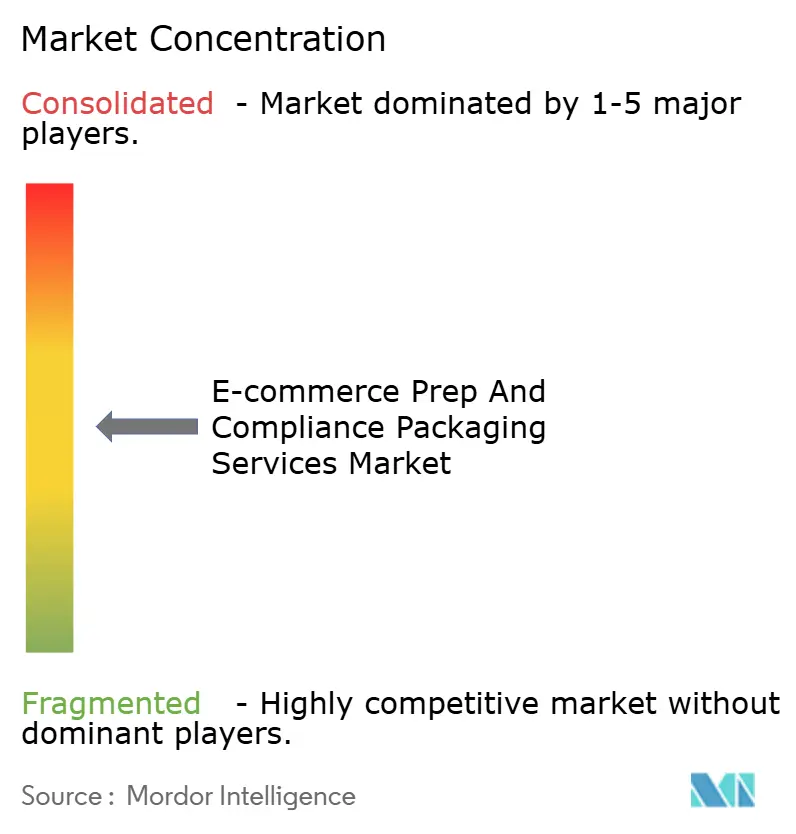
| Market Concentration | Medium |
Major Players *Disclaimer: Major Players sorted in no particular order Image © Mordor Intelligence. Reuse requires attribution under CC BY 4.0. | |
E-Commerce Prep And Compliance Packaging Services Market Analysis by Mordor Intelligence
The E-commerce Prep and Compliance Packaging Services market size in 2026 is estimated at USD 6.87 billion, growing from 2025 value of USD 6.37 billion with 2031 projections showing USD 10.05 billion, growing at 7.9% CAGR over 2026-2031. The rapid expansion of fulfillment-by-Amazon (FBA), more stringent Ships in Own Container (SIOC) and ISTA-6 mandates, and increasing cross-border shipment volumes continue to drive the E-commerce Prep and Compliance Packaging Services market on a steady double-digit trajectory. Amazon’s escalating chargebacks for non-compliant parcels have increased the financial stakes for sellers, pushing demand for specialist partners that can certify, test, and document every box. Automation adoption, particularly in vision systems and collaborative robots, is widening the productivity gap between tech-enabled operators and manual prep shops. Meanwhile, sustainability scorecards from major platforms are accelerating the shift to bio-based materials. Competitive intensity is heightened by logistics majors acquiring regional niche providers to gain ISTA-6 labs, regulatory databases, and vertical expertise.
Key Report Takeaways
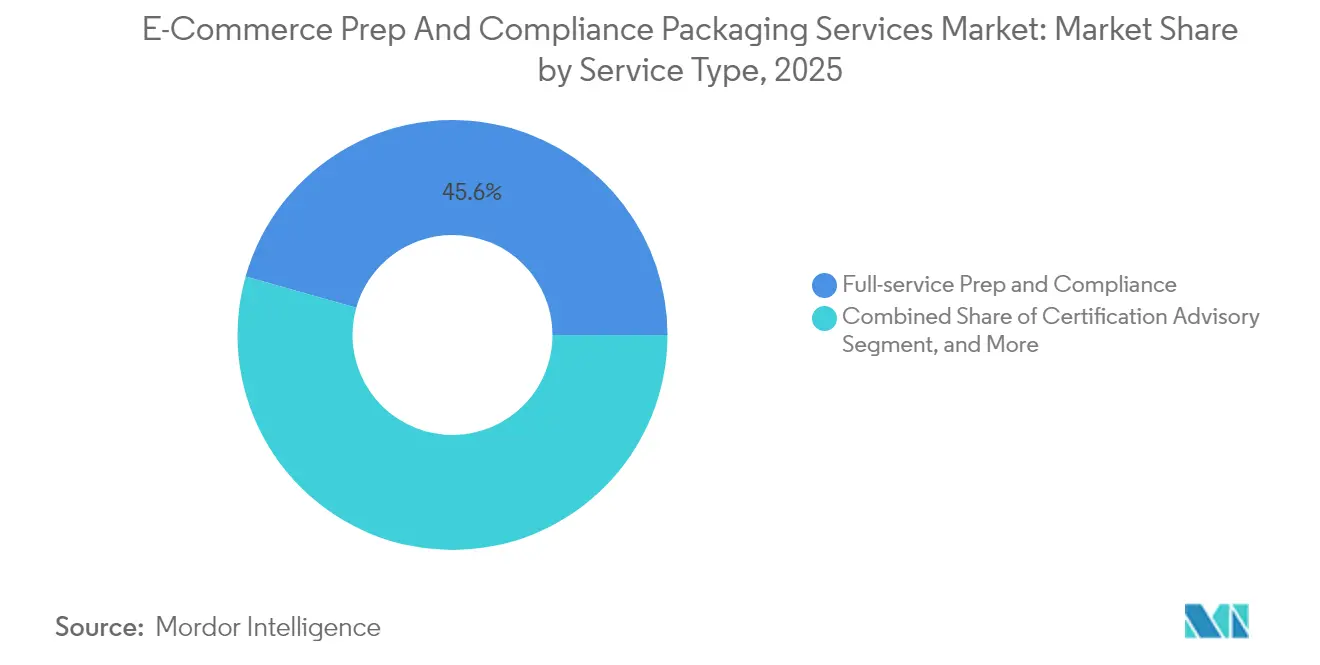
- By service type, full-service prep and compliance captured 45.62% of the e-commerce prep and compliance packaging services market share in 2025.
- By packaging type, the e-commerce prep and compliance packaging services market size for foldable cartons is forecast to advance at an 8.41% CAGR through 2031.
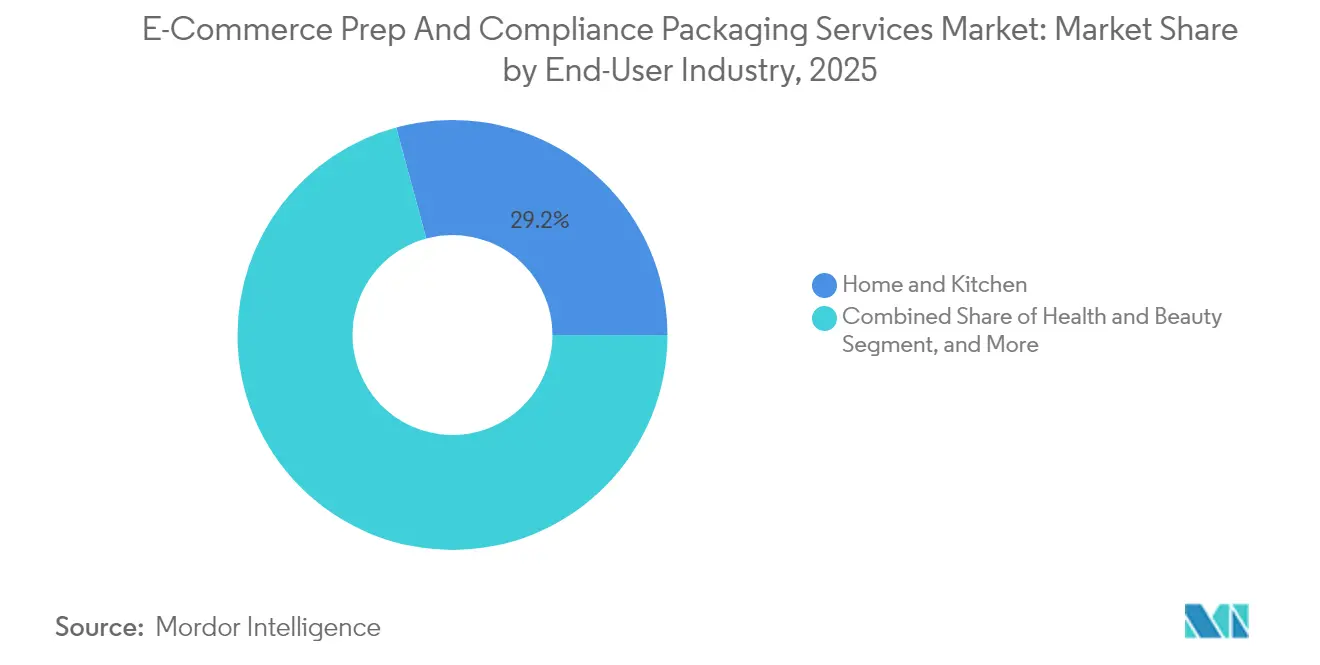
- By end-user industry, home and kitchen captured 29.22% of the e-commerce prep and compliance packaging services market share in 2025.
- By material type, the e-commerce prep and compliance packaging services market size for biodegradable and compostable alternatives is forecast to advance at a 8.83% CAGR through 2031.
- By geography, North America captured 41.30% of the e-commerce prep and compliance packaging services market share in 2025.
Note: Market size and forecast figures in this report are generated using Mordor Intelligence’s proprietary estimation framework, updated with the latest available data and insights as of 2026.
Global E-Commerce Prep And Compliance Packaging Services Market Trends and Insights
Drivers Impact Analysis*
| Driver | (~) % Impact on CAGR Forecast | Geographic Relevance | Impact Timeline |
|---|---|---|---|
| Rapid Expansion of Amazon FBA and Seller Fulfilled Prime Volumes | +2.1% | Global, concentrated in North America and Europe | Medium term (2-4 years) |
| Stricter Penalties for Non-Compliance with Amazon SIOC/ISTA-6 Resulting in Chargebacks | +1.8% | Global, highest impact in North America | Short term (≤ 2 years) |
| Rising Adoption of Automation (Vision Inspection, Cobots) in Prep Centers | +1.4% | North America and Europe, expanding to Asia-Pacific | Long term (≥ 4 years) |
| Growth of Cross-Border E-Commerce Requiring Specialized Compliance Packaging | +1.6% | Asia-Pacific core, spill-over to Middle East and Africa and Latin America | Medium term (2-4 years) |
| Retailer Shift Toward Sustainable Right-Sized Packaging to Cut DIM-Weight Fees | +1.2% | Global, early adoption in North America and European Union | Medium term (2-4 years) |
| Insurance Carriers Mandating Certified Packaging to Reduce Damage Claims | +0.9% | North America and Europe | Long term (≥ 4 years) |
| Source: Mordor Intelligence | |||
Rapid Expansion of Amazon FBA and Seller Fulfilled Prime Volumes
Amazon processed 5.9 billion parcels in 2024, 12% more than in 2023, with approximately 60% of them routed through FBA.[1]Amazon, “2024 FBA Shipment Statistics,” amazon.com Each additional parcel tightens compliance windows, pushing sellers toward partners that guarantee SIOC-ready units, kitting, and live tracking. Seller Fulfilled Prime opened the Prime badge to 100,000 additional merchants in 2024, while maintaining all SIOC and ISTA-6 obligations, prompting small brands to outsource preparation rather than overhaul their own warehouses. International FBA rollouts in India, Brazil, and Southeast Asia have layered local labeling and customs forms on top of Amazon’s global rules, making multi-country compliance practically unattainable without specialist help. Prep centers that can bridge Prime, Multi-Channel Fulfillment, and direct-to-consumer flows now secure premium retainers and long-term contracts.
Stricter Penalties for Non-Compliance with Amazon SIOC/ISTA-6 Resulting in Chargebacks
In 2024, Amazon tightened its chargeback matrix, levying a charge of USD 1.50 to USD 5.00 per non-compliant unit and suspending repeat offenders.[2]Amazon Seller Central, “Packaging and Prep Requirements Update 2024,” sellercentral.amazon.com Automated damage-detection engines query more than 50 attributes per parcel, escalating errors to finance within minutes. Sellers who repeatedly receive flags lose Buy-Box eligibility, resulting in a decline in sales velocity. The knock-on effect is that 3PLs offering guaranteed SIOC adherence can justify higher service fees. The category expansion of SIOC to automotive parts and home goods in mid-2024 increased the compliance perimeter by approximately 2 million SKUs, resulting in an immediate surge in inbound test-lab bookings. Prep services reporting zero chargebacks during peak season use that metric as a marketing differentiator to lock in new enterprise accounts.
Rising Adoption of Automation (Vision Inspection, Cobots) in Prep Centers
Collaborative robot shipments into packaging lines increased by 35% in 2024. Cobots provide precise tape angles, uniform fold depths, and consistent output that manual crews struggle to replicate at scale. AI-powered vision systems now find edge gaps and crush damage with 99.7% accuracy, preventing chargebacks before cartons leave the dock. Internet-connected compression cells log box stiffness data to cloud dashboards, creating audit trails for insurance underwriters that discount premiums on verified lots. Automated systems also recalibrate in real-time to match carrier dimensional-weight brackets, thereby trimming void-fill usage and increasing truck cube utilization. Operators that retrofitted with automation doubled their peak-season throughput without adding headcount, widening the cost and service gap versus unautomated regional providers.
Growth of Cross-Border E-Commerce Requiring Specialized Compliance Packaging
Cross-border online spend touched USD 1.2 trillion in 2024. Each exported parcel now passes a three-layer review: destination customs, carrier handling rules, and platform packaging mandates. The European Union’s Packaging and Packaging Waste Regulation enforces minimum recyclability thresholds, while China’s national express-packaging standard adds lab-drop tests unique to its domestic network. Brands shipping the same SKU to 50 countries need multiple label sets, recycled-content disclosures, and multi-language hazard statements. Prep houses with in-region test rigs and compliance databases cut average time-to-market by four weeks, a critical edge for seasonal launches. As Southeast Asian marketplaces mature, sellers face a complex array of tax stamps, eco-fees, and import permit stickers, drawing regional 3PLs into retainer-based compliance advisory work.
Restraints Impact Analysis*
| Restraint | (~) % Impact on CAGR Forecast | Geographic Relevance | Impact Timeline |
|---|---|---|---|
| High capital intensity of ISTA-6 test labs limiting service scalability | -1.3% | Global, strongest in emerging markets | Long term (≥ 4 years) |
| Volatility in recycled corrugate prices squeezing prep margins | -0.8% | Global, highest in North America and Europe | Short term (≤ 2 years) |
| Fragmented regulatory standards outside Amazon leading to uncertain ROI | -0.7% | Global, acute in Asia-Pacific and Middle East and Africa | Medium term (2-4 years) |
| Increasing in-house fulfillment capabilities by large brands reducing outsourcing | -0.6% | North America and Europe | Medium term (2-4 years) |
| Source: Mordor Intelligence | |||
High Capital Intensity of ISTA-6 Test Labs Limiting Service Scalability
Building a single ISTA-6 lab requires USD 2 million to USD 5 million for rotary drums, compression rigs, and environmental chambers, followed by annual maintenance of nearly USD 300,000.[3]International Safe Transit Association, “ISTA-6 Lab Accreditation Guide,” ista.org Accreditation can last up to 18 months, during which the equipment remains idle. Smaller prep shops often outsource to third-party labs that are already running at capacity, adding four- to six-week queues that slow down seller launches. Regional gaps persist: Latin America hosts only a handful of accredited centers, obliging merchants to air-freight samples to the United States. The cash burden dissuades new entrants and prompts existing independents to merge or form strategic alliances with capital-rich 3PLs.
Volatility in Recycled Corrugate Prices Squeezing Prep Margins
Recycled corrugated board swung 23% in 2024, fluctuating between USD 140 and USD 180 per ton. Prepared contracts are commonly locked on annual rates, forcing vendors to absorb spikes that erode their net margin. Sustainability policies from Amazon and European retailers require minimum recycled content, curbing the option to pivot to cheaper virgin fibre during price peaks. Weather-related curb-side collection dips and logistics bottlenecks amplify volatility, especially during the winter holiday quarter when parcel volumes surge. Smaller providers often lack effective hedging strategies or the scale to purchase efficiently and must pass costs on to clients, risking client churn to larger, vertically integrated competitors.
*Our forecasts treat driver/restraint impacts as directional, not additive. The impact forecasts reflect baseline growth, mix effects, and variable interactions.
Segment Analysis
By Service Type: Advisory Services Outpace Traditional Prep
Full-service preparation and compliance generated the largest slice of the e-commerce preparation and compliance packaging services market, with 45.62% revenue in 2025. Certification Advisory, while smaller, is on the fastest 9.12% CAGR track as sellers seek granular guidance on Amazon, Walmart Marketplace, and regional rulebooks. That dynamic elevates expertise over labor, allowing consultative players to secure premium retainers solely to interpret rule updates. Underneath, Packaging Design and Prototyping commands 22.10% of 2025 spend, reflecting brand demand for packaging that satisfies ISTA-6 simulation, protects high-value goods, and ships in the smallest possible cube. ISTA-6-only testing services hold a 15.18% share, serving enterprise brands that have internal preparation stations but still require unbiased lab certificates to maintain valid insurance coverage.
The e-commerce prep and compliance packaging services market continues to reward firms that unify advisory, design, test, and prep into subscription bundles. As rules grow more complex, merchants prefer a single point of control, reducing vendor silos that can introduce handoff errors. Advisory specialists leverage proprietary compliance dashboards updated daily with SIOC amendments, EU PPWR thresholds, and China’s express-pack list. Their margin profile often eclipses that of carton-sealing services because knowledge, not labor, drives value. Over the 2026-2031 period, the market is expected to tilt further toward advisory retainers, even as full-service volumes remain the backbone of revenue.


By Packaging Type: Foldable Cartons Challenge Corrugated Dominance
Corrugated Boxes still represent 61.20% of the e-commerce preparation and compliance packaging services market share in 2025, favored for robustness and carrier stackability. Foldable Cartons, however, are on an 8.41% CAGR run as automated right-sizing lines at prep centers feed exact-fit blanks that reduce dimensional weight surcharges by as much as 20%. Poly Mailers account for 18.10% of revenue, primarily in the apparel sector, where protection needs are lower. Padded Mailers account for another 12.00%, shielding small electronics and jewelry that require cushioned envelopes without full boxes.
As the e-commerce preparation and compliance packaging services market prioritizes sustainability scoring, right-sized cartons help sellers hit platform eco-badges and cut waste. Foldable constructs support multi-depth perforations, allowing robots to auto-snip to match product depth. Corrugated integrators respond with variable-depth and glue-free quick tabs to maintain automation compatibility. For sellers shipping to multiple countries, universal-print graphics on foldable cartons speed up customs clearance, further increasing market share. The net result is a packaging ecosystem where protection, freight efficiency, and sustainability are co-equal design pillars.
By End-User Industry: Health and Beauty Drives Premium Growth
Home and Kitchen held the crown with a 29.22% market share of e-commerce preparation and compliance packaging services in 2025, driven by high-velocity SKU churn and steady replenishment cycles. Health and Beauty, though smaller, is clocking the market’s quickest 8.05% CAGR thanks to tightening FDA and European Union cosmetics labeling rules. Each lotion bottle or eye-shadow palette now requires tamper-evident seals, bilingual ingredient panels, and leak-proof secondary packaging, tasks that are ill-suited to generic 3PLs. Consumer Electronics accounted for 24.80% of the market share, sustained by the proliferation of connected-home gadgets and wearables that require anti-static liners and shock-resistant bracing.
Within Health and Beauty, ingredient disclosures vary by destination, so prep centers stock multilingual label stocks and automated print-apply stations. Cold-chain cosmetics incorporate insulated liners and phase-change packs, which not only improve unit economics but also margins. Apparel and Footwear, 20.10% share, relies on low-cost poly mailers and faces margin pressure that puts a ceiling on prep spending. The pattern highlights how regulatory density, not just unit volume, influences wallet share, guiding the E-commerce Prep and Compliance Packaging Services industry toward higher-value verticals.
By Material Type: Sustainability Mandates Accelerate Bio-Based Adoption
Paper-based materials retained 54.05% slice of the e-commerce preparation and compliance packaging services market size in 2025, underpinned by global curb-side recycling familiarity. Biodegradable and Compostable formats, however, exhibit a superior 8.83% CAGR as major platforms impose environmental scorecards. Plastic-based options are losing relative share, even with cost advantages, because non-recyclable plastic now downgrades sellers’ sustainability ratings in Amazon storefronts. Multi-material Hybrids that combine barrier performance with easy disassembly are emerging, particularly for moisture-sensitive goods such as powdered supplements.
Bio-based suppliers chase ISO 17088 and ASTM D6400 logos to prove compostability under industrial conditions, credentials that procurement teams now weigh alongside price. Carbon-footprint calculators integrated into prep-center portals enable brands to select materials that minimize Scope 3 emissions. While virgin fibre remains essential for heavy-duty boxes, recycled-content thresholds are increasing, and the e-commerce preparation and compliance packaging services market rewards centres that secure long-term recycled corrugate contracts to stabilise cost swings.
Geography Analysis
The Asia-Pacific region is expected to post a 8.92% CAGR through 2031, outpacing every other territory as China, India, and Southeast Asian economies continue to digitize retail and codify packaging laws. China’s new GB/T 16606-3-2024 spec mandates drop-test protocols that differ from ISTA-6, compelling exporters to double-test or risk customs rejections. India introduced e-commerce packaging declarations in 2024, requiring material composition percentages on parcels, an administrative burden alleviated by prep houses versed in Bureau of Indian Standards norms. Emerging hubs like Vietnam and the Philippines are considering recycled-content levies, signaling a steady escalation of compliance that will sustain advisory demand.
North America accounted for 41.30% of 2025 revenue, driven by the densest network of FBA nodes and a mature third-party logistics infrastructure. Growth moderates to mid-single digits as core categories saturate, yet Amazon’s periodic SIOC expansions keep a baseline of incremental demand. Europe, with a 28.05% share, is in legislative flux as the Packaging and Packaging Waste Regulation phases in recyclability and refillable targets, driving audits and redesigns of packaging boxes. Latin America, and Middle East and Africa remain small but show double-digit adoption as marketplace operators roll out local Prime-type programs that reference Amazon’s global packaging rubric.

Competitive Landscape
The e-commerce preparation and compliance packaging services market remains moderately fragmented but is tilting toward consolidation as economies of scale become essential. Industry leaders such as ShipBob, Red Stag Fulfillment, and Deliverr (now inside Shopify) cluster near major parcel hubs to slash transit times while operating proprietary ISTA-6 labs. Automation is the litmus test: facilities embedding cobots, inline vision, and IoT sensors run at lower unit cost and deliver near-perfect audit trails, propelling these operators up vendor shortlists for enterprise brands.
Strategic acquisitions illustrate the race for capacity and expertise. Red Stag Fulfillment’s 2024 purchase of PrepItPackItShipIt bolstered anti-static packaging capabilities coveted by electronics sellers, while Shopify poured USD 150 million into ISTA-6 labs across 12 North American sites to meet holiday surges without slipping on SIOC compliance. Flexport’s Certified Packaging unit, launched across 15 nations, underscores a pivot from freight forwarder to full-spectrum compliance partner. Smaller independents adapt by carving sector-specific niches such as cosmetics handling under FDA rulesor by acting as regional test-lab overflow partners for multinationals.
Technology and data ownership are the new moats. Providers with proprietary compliance databases can auto-flag rule changes, update carton SKUs, and print revised labels within hours, avoiding seller downtime. Insurance carriers are starting to offer lower deductibles to sellers that ship through accredited, sensor-equipped prep centers, a leverage point that further distinguishes scale players. Over 2025-2030, the e-commerce preparation and compliance packaging services market is expected to see merger clusters around major air-cargo corridors, with privately funded roll-ups chasing the efficiencies of unified automation platforms.
E-Commerce Prep And Compliance Packaging Services Industry Leaders
Auctane ShipStation
AW Fulfilment
eFulfillment Service Inc.
Rakuten Super Logistics
ShipBob Inc.
- *Disclaimer: Major Players sorted in no particular order

Recent Industry Developments
- October 2024: Shopify expanded network capacity by 40%, integrating Deliverr sites and deploying 12 additional ISTA-6 labs across North America.
- September 2024: ShipBob raised USD 200 million in a Series E round to fund automation upgrades and Asia-Pacific expansion.
- August 2024: Flexport launched a Certified Packaging division spanning 15 countries to tap higher-margin compliance services.
- July 2024: Amazon broadened SIOC mandates to automotive parts and home improvement SKUs, covering 2 million more listings.


Global E-Commerce Prep And Compliance Packaging Services Market Report Scope
| Full-service Prep and Compliance |
| Packaging Design and Prototyping |
| ISTA 6 Testing Only |
| Certification Advisory |
| Other Service Types |
| Corrugated Boxes |
| Poly Mailers |
| Padded Mailers |
| Foldable Cartons |
| Other Packaging Types |
| Consumer Electronics |
| Health and Beauty |
| Home and Kitchen |
| Apparel and Footwear |
| Other End-User Industries |
| Paper-based |
| Plastic-based |
| Biodegradable / Compostable |
| Multi-material Hybrids |
| North America | United States | |
| Canada | ||
| Mexico | ||
| South America | Brazil | |
| Argentina | ||
| Rest of South America | ||
| Europe | Germany | |
| United Kingdom | ||
| France | ||
| Italy | ||
| Spain | ||
| Russia | ||
| Rest of Europe | ||
| Asia-Pacific | China | |
| Japan | ||
| India | ||
| South Korea | ||
| South-East Asia | ||
| Rest of Asia-Pacific | ||
| Middle East and Africa | Middle East | Saudi Arabia |
| United Arab Emirates | ||
| Turkey | ||
| Rest of Middle East | ||
| Africa | South Africa | |
| Nigeria | ||
| Rest of Africa | ||
| By Service Type | Full-service Prep and Compliance | ||
| Packaging Design and Prototyping | |||
| ISTA 6 Testing Only | |||
| Certification Advisory | |||
| Other Service Types | |||
| By Packaging Type | Corrugated Boxes | ||
| Poly Mailers | |||
| Padded Mailers | |||
| Foldable Cartons | |||
| Other Packaging Types | |||
| By End-User Industry | Consumer Electronics | ||
| Health and Beauty | |||
| Home and Kitchen | |||
| Apparel and Footwear | |||
| Other End-User Industries | |||
| By Material Type | Paper-based | ||
| Plastic-based | |||
| Biodegradable / Compostable | |||
| Multi-material Hybrids | |||
| By Geography | North America | United States | |
| Canada | |||
| Mexico | |||
| South America | Brazil | ||
| Argentina | |||
| Rest of South America | |||
| Europe | Germany | ||
| United Kingdom | |||
| France | |||
| Italy | |||
| Spain | |||
| Russia | |||
| Rest of Europe | |||
| Asia-Pacific | China | ||
| Japan | |||
| India | |||
| South Korea | |||
| South-East Asia | |||
| Rest of Asia-Pacific | |||
| Middle East and Africa | Middle East | Saudi Arabia | |
| United Arab Emirates | |||
| Turkey | |||
| Rest of Middle East | |||
| Africa | South Africa | ||
| Nigeria | |||
| Rest of Africa | |||


Key Questions Answered in the Report
What is the forecast growth rate for e-commerce prep and compliance packaging services up to 2031?
The segment is projected to grow at a 7.90% CAGR, lifting revenue from USD 6.37 billion in 2025 to USD 10.05 billion by 2031.
Why are brands outsourcing packaging compliance instead of handling it internally?
Outsourcing transfers the burden of ever-changing SIOC, ISTA-6, and regional eco-regulations to specialists that already own certified labs, automation, and regulatory databases.
Which geographic region offers the highest growth headroom for compliance packaging?
Asia-Pacific leads with a forecast 8.92% CAGR because China, India, and Southeast Asian markets are tightening packaging rules as online retail booms.
How do stricter Amazon chargebacks influence demand for prep services?
Penalties of USD 1.50-USD 5.00 per non-compliant unit and potential Buy-Box loss push sellers toward partners that guarantee full SIOC and ISTA-6 compliance.
What material trends dominate e-commerce packaging selections?
Paper-based formats remain dominant at 54.05% share in 2025, but biodegradable and compostable alternatives show the fastest uptake at an 8.83% CAGR through 2031 as platforms embed sustainability scorecards.
How does automation impact the economics of prep centers?
Cobots, vision inspection, and IoT sensors boost throughput, cut labor, and generate auditable data, enabling tech-enabled centers to win longer contracts at higher margins.
Page last updated on:


