Market Overview
| Study Period | 2020 - 2031 |
|---|---|
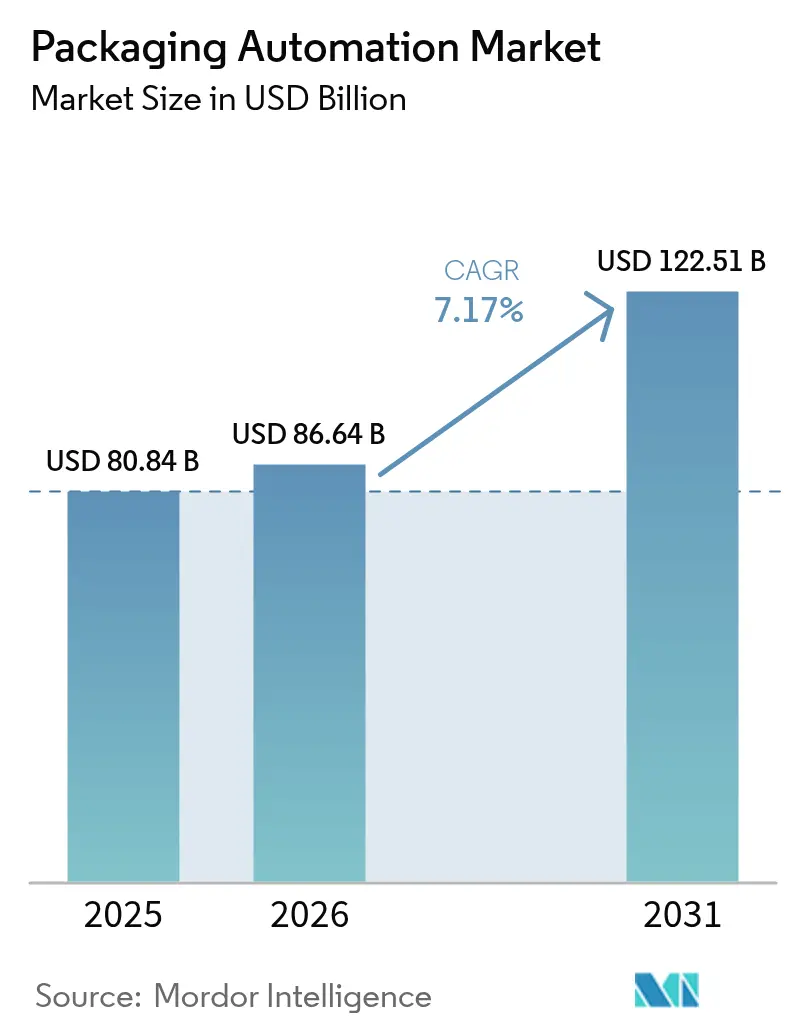
| Market Size (2026) | USD 86.64 Billion |
| Market Size (2031) | USD 122.51 Billion |
| Growth Rate (2026 - 2031) | 7.17% CAGR |
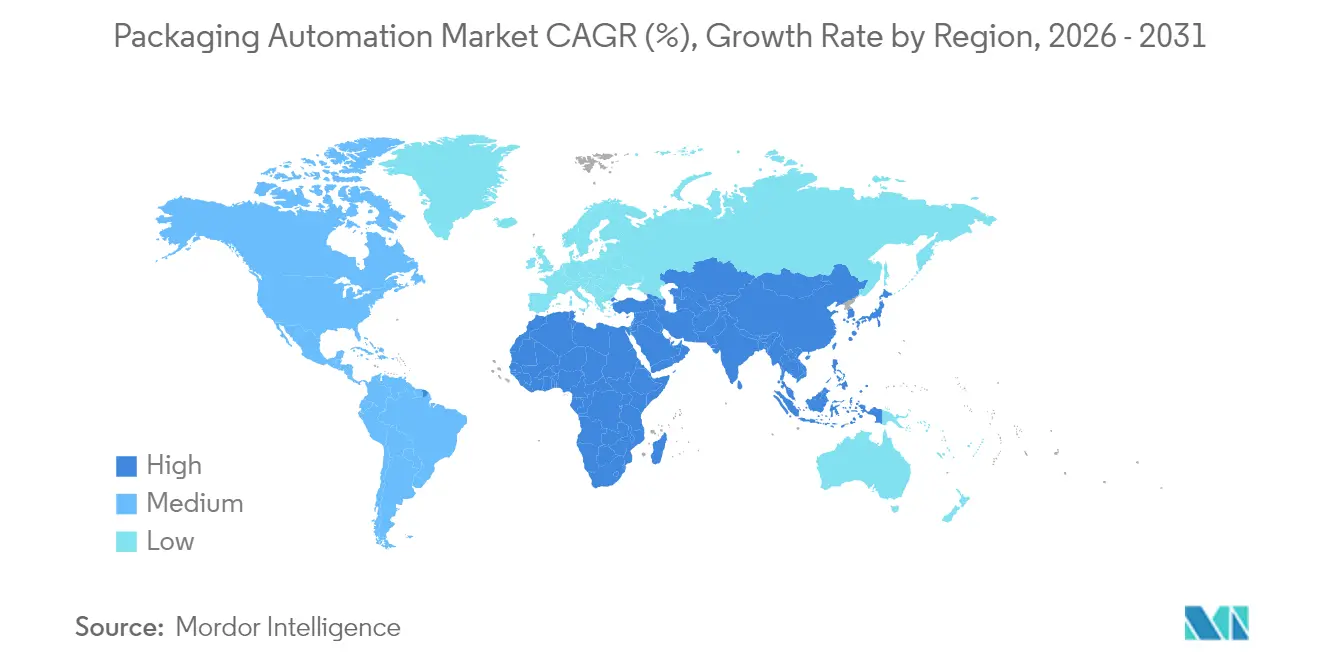
| Fastest Growing Market | Asia Pacific |
| Largest Market | North America |
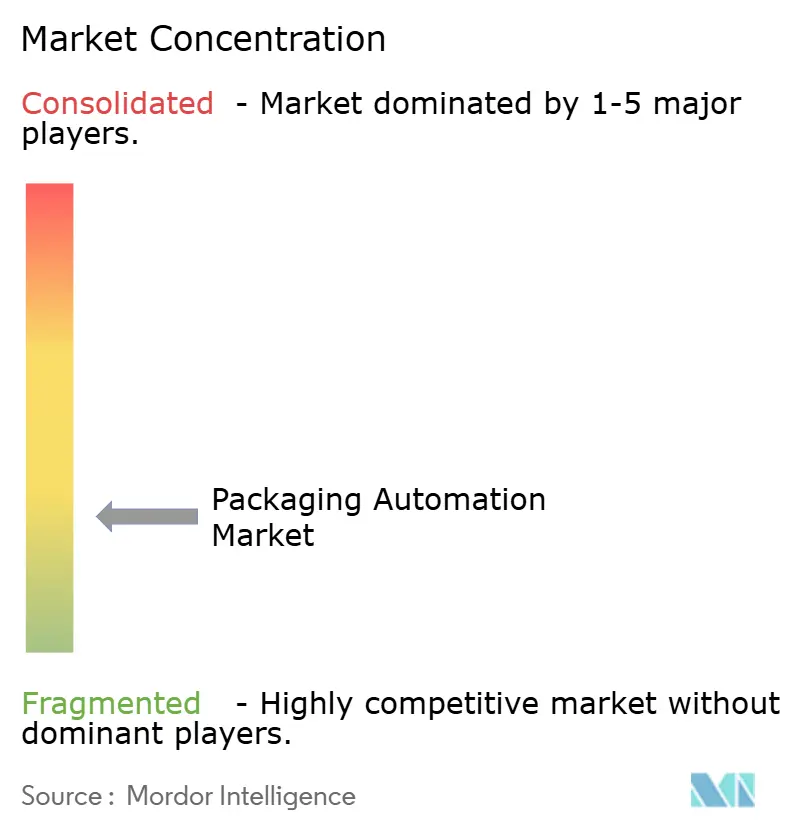
| Market Concentration | Low |
Major Players *Disclaimer: Major Players sorted in no particular order Image © Mordor Intelligence. Reuse requires attribution under CC BY 4.0. | |
Packaging Automation Market Analysis by Mordor Intelligence
The packaging automation market size was valued at USD 80.84 billion in 2025 and estimated to grow from USD 86.64 billion in 2026 to reach USD 122.51 billion by 2031, at a CAGR of 7.17% during the forecast period (2026-2031). Continued investment in intelligent manufacturing systems is narrowing labor gaps, lifting line precision, and meeting rising regulatory expectations. The sector benefits from e-commerce volume growth that overlaps with stringent pharmaceutical serialization, forcing lines to balance throughput with traceability. North America retains leadership, yet Asia-Pacific delivers the fastest expansion, supported by China’s multi-billion-dollar robotics outlays. Hardware still dominates revenue, but service-centric, outcome-based models accelerate as users seek guaranteed uptime rather than ownership. Consolidation across corrugated, folding carton, and material handling suppliers is enlarging customer footprints and creating fresh scale for automation providers.
Key Report Takeaways
- By product type, case packaging held 31.74% of packaging automation market share in 2025, while palletizing is on track for a 11.94% CAGR to 2031.
- By end-user, the food sector led with 28.07% revenue share in 2025; pharmaceuticals are poised for an 11.55% CAGR through 2031.
- By automation level, semi-automated lines accounted for 38.12% of the packaging automation market size in 2025, whereas fully automated systems will expand at 12.41% CAGR between 2026-2031.
- By solution, hardware commanded a 49.63% share of the packaging automation market size in 2025; services represent the fastest segment with a 9.05% CAGR to 2031.
- By the packaging stage, secondary packaging captured 41.05% of the packaging automation market share in 2025 and is advancing at a 9.78% CAGR through 2031.
- By geography, North America held 33.78% of packaging automation market share in 2025, while Asia-Pacific is on track for a 10.32% CAGR to 2031.
Note: Market size and forecast figures in this report are generated using Mordor Intelligence’s proprietary estimation framework, updated with the latest available data and insights as of 2026.
Global Packaging Automation Market Trends and Insights
Drivers Impact Analysis*
| Driver | (~) % Impact on CAGR Forecast | Geographic Relevance | Impact Timeline |
|---|---|---|---|
| Rising adoption across F&B, pharma and e-commerce | +2.1% | Global, concentrated in North America and APAC | Medium term (2-4 years) |
| E-commerce demand for high-speed secondary packaging | +1.8% | Global, led by North America and Europe | Short term (≤ 2 years) |
| Labor shortages accelerating robotics deployment | +1.5% | North America and Europe, spreading to APAC | Short term (≤ 2 years) |
| AI-driven predictive maintenance | +0.9% | Global, early uptake in developed markets | Medium term (2-4 years) |
| Modular cobot cells for SMEs | +0.7% | Global, strongest in Europe and APAC | Long term (≥ 4 years) |
| Sustainability-led material-reduction automation | +0.6% | Europe-led, expanding globally | Long term (≥ 4 years) |
| Source: Mordor Intelligence | |||


Rising Adoption of Automation Across F&B, Pharma and E-commerce Sectors
Packaging machinery shipments climbed in 2024, propelled by pharmaceutical lines that demand flexible, small-batch formats beside high-volume food operations. Pharmaceutical manufacturers are committing USD 160 billion to site upgrades in 2025 to enable personalized medicine packaging. E-commerce fulfillment centers adopt right-sizing systems generating thousands of box variations, halving corrugate use while boosting labor productivity. Cross-industry technology transfer quickens as solutions proven in one sector migrate to another, accelerating packaging automation market penetration. The combined momentum amplifies demand for adaptive robotics and integrated vision that can shift between SKU classes with limited downtime.
E-commerce-Induced Demand for High-Speed Secondary Packaging
Right-sized box systems coupled with mobile robots lifted a distribution site’s productivity by 97% within months, underscoring how secondary packaging has become the pivotal efficiency lever. [1]Packsize, “Sprinting Towards Efficiency | Performance Health,” packsize.comVariable-dimension automation now comprises 41.42% of the packaging automation market, reflecting the need to process mixed orders at speed. Asia-Pacific’s surging online retail sales are projected to escalate regional equipment outlays to USD 18 billion in 2024. Coupled with omnichannel models in Europe and North America, the shift places sustained pressure on line speeds, software orchestration, and ergonomic palletizing, stimulating continuous upgrades across the packaging automation market.
Labor Shortages Accelerating Robotics Deployment
Persistent warehouse vacancies and rising wage rates are repositioning robotics from optional to mission-critical. The conveyors segment alone is forecast to crest USD 10.07 billion by 2026 as firms automate material flow. ABB’s OmniVance collaborative machine tending cell can cut human tending time by 60%, unlocking capacity for higher-value tasks. A coffee roaster redeployed eight operators after installing a cobot palletizer that now handles 1,500 boxes daily and achieved payback inside one year. Success stories in mid-sized plants lower perceived risk and encourage broader adoption among SMEs, lifting the overall packaging automation market.
AI-Driven Predictive Maintenance Lowering Downtime
Machine-learning algorithms that analyze sensor data are shifting maintenance from fixed intervals to condition-based events, cutting unexpected stoppages. Research documents meaningful reductions in downtime and maintenance cost after deploying predictive models on packaging lines. ABB has embedded more than 100 AI projects across its automation portfolio, illustrating how predictive insights are becoming standard features rather than add-on services. Cloud diagnostics also enable remote support for sites that lack in-house engineering, widening access to sophisticated automation. Digital twins coupled with generative AI refine failure simulations and recommended actions, making advanced upkeep attainable for a larger slice of the packaging automation market.
Restraints Impact Analysis*
| Restraint | (~) % Impact on CAGR Forecast | Geographic Relevance | Impact Timeline |
|---|---|---|---|
| High capital cost and cybersecurity risks | -1.2% | Global, stronger in developing markets | Short term (≤ 2 years) |
| Skilled-operator scarcity | -0.8% | Global, acute in developed markets | Medium term (2-4 years) |
| Vendor lock-in to proprietary software | -0.5% | Global, affecting SMEs | Long term (≥ 4 years) |
| Lack of certified open-source vision libraries for hygienic zones | -0.3% | Global, centered on F&B and pharma | Long term (≥ 4 years) |
| Source: Mordor Intelligence | |||
High Capital Cost and Cybersecurity Risks
Full-scale packaging cells require significant upfront cash that many SMEs find prohibitive. Simultaneously, rising connectivity exposes operational technology to cyber threats, with manufacturing representing over one quarter of industrial incidents. Firms must invest in both automation hardware and layered security, stretching budgets and slowing adoption. Robots-as-a-Service models address this dual hurdle by shifting spending to OPEX and providing managed cybersecurity within the subscription. The approach lessens balance-sheet impact, yet market education is still needed before it scales across the packaging automation market.
Skilled-Operator Scarcity
High-mix, AI-enabled equipment intensifies demand for technicians who can fine-tune robots, interpret dashboards, and troubleshoot edge cases. ABB opened new training facilities for mobile robotics in Madrid to upskill operators, signaling a vendor shift toward educational support. Markets undergoing rapid industrialization struggle more acutely as vocational programs lag technology rollouts. No-code and low-code interfaces that cut robot setup time by as much as 80% are emerging to narrow the gap. Nevertheless, the talent shortage remains a drag on the packaging automation market CAGR until reskilling outputs catch demand.
*Our forecasts treat driver/restraint impacts as directional, not additive. The impact forecasts reflect baseline growth, mix effects, and variable interactions.
Segment Analysis
By Product Type: Palletizing Drives Innovation Despite Case Packaging Dominance
Case packaging accounted for 31.74% of packaging automation market share in 2025, underscoring its essential role in safeguarding goods during distribution. Growth within the case segment remains steady as sustainability pushes thinner corrugate and precision glue application. Palletizing, though smaller in revenue, is expanding at 11.94% CAGR. FANUC’s new CRX-25iA cobot, able to handle 30 kg loads, compresses cell footprints while offering easy teach pendants. Collaborative robots shorten commissioning and improve worker ergonomics, making the segment a leading indicator of wider automation uptake.
Upstream, filling machines win pharmaceutical investment as flexible aseptic formats accommodate personalized therapies. Labeling lines add serialization modules that satisfy regulatory traceability in medicine and beverages. Wrapping and capping rise on the back of lightweight film advances, with banding technology reducing plastic by 80% in pilot deployments. Bagging lines gain footing in abrasive material sectors where ruggedized Hardox steel prolongs service life. The interplay among these products signals a move toward end-to-end cells that fuse multiple tasks into an adaptive packaging automation market solution.


By End-user: Pharmaceutical Growth Accelerates Beyond Food Sector Leadership
Food manufacturers held 28.07% of the packaging automation market in 2025, benefiting from high-volume SKUs and rigid hygiene standards. Despite its smaller baseline, pharmaceutical packaging is poised for 11.55% CAGR as injectable therapies rise. Syntegon’s Pharmatag 2025 line fills liquids under strict sterility while switching formats quickly to handle short runs. Beverage lines in Asia-Pacific install high-speed canning and sleeving to satisfy rising middle-class demand.
Personal-care brands focus on luxurious, custom packs enabled by automated multi-line order picking. Chemical producers adopt enclosed filling and sealing to limit exposure to aggressive media, leveraging Festo’s EX-certified actuators. Technology crossover accelerates as pharma serialization migrates into consumer goods to combat counterfeits, broadening application scope for the packaging automation market.
By Automation Level: Collaborative Systems Bridge Semi to Full Automation
Semi-automated cells composed 38.12% of packaging automation market size in 2025, a pragmatic midpoint where manual steps remain for flexibility. Fully automated lines are growing at 12.41% CAGR, driven by AI path planning and sensor fusion that tackle variable SKUs without human adjustments. Collaborative systems illustrate the transition. GoFa cobots band products beside operators, lowering workplace strain while slashing plastic by 80%.
Payback periods below one year, as seen at Bob’s Red Mill, motivate adoption even in traditional plants. Modular plug-and-play cobot cells such as Zimmer Group’s ZiMo let SMEs add automation without coding expertise. The trend demonstrates that collaborative platforms are the gateway from semi to full automation, reinforcing growth within the packaging automation market.
By Solution: Services Growth Signals Industry Maturation
Hardware captured 49.63% of revenue in 2025 yet services recorded a 9.05% CAGR. Robots-as-a-Service delivers 99.8% uptime across 200,000 production hours, proving performance-guarantee models. Software platforms integrate SCADA, MES, and analytics to convert hardware into self-optimizing lines. The packaging automation market size for services is projected to expand more rapidly as lifecycle contracts cover installation, AI upgrades, and predictive maintenance.
ABB allocated USD 280 million for its European Robotics Hub to develop integrated service offerings that span feasibility to remote diagnostics. Retrofit projects rise as brownfield sites modernize without disrupting throughput. Predictive spare parts fulfillment and cloud-tied maintenance dashboards illustrate how services differentiate vendors in a maturing packaging automation market.

By Packaging Stage: Secondary Packaging Leads Across All Metrics
Secondary operations owned 41.05% of packaging automation market share in 2025 and post the fastest 9.78% CAGR. E-commerce volumes anchor demand for right-sized cartons, automated void fill, and vision-guided palletizing. Primary packaging invests in sterile fillers and sealers, aligned with FDA aseptic guidelines that mandate contamination-free processing. Tertiary automation covers pallet wrapping and labeling, with machine vision inspecting every unit, as seen in a dairy plant that installed a 53-camera system to ensure 100% quality.
Integrated stage data enables closed-loop optimization. Predictive algorithms adjust secondary line speed when upstream fillers slow, preserving flow. Such orchestration cements secondary packaging’s status as the key lever for cost and service improvement across the packaging automation market.
Geography Analysis
North America contributed 33.78% to the packaging automation market in 2025, leveraging sophisticated manufacturing infrastructure and FDA serialization mandates. Drug makers will spend USD 160 billion on facility upgrades during 2025, sustaining demand for clean-room ready robots. ABB’s USD 20 million expansion in Michigan underscores vendor commitment to regional customers. E-commerce fulfillment hubs proliferate, amplifying calls for adaptive secondary packaging.
Asia-Pacific is the fastest region at 10.32% CAGR through 2031. China spent USD 6.6 billion on industrial robots in 2024, reflecting policy ambitions to double robot density. Shanghai’s ProPak 2025 will gather more than 2,500 exhibitors in smart packaging solutions, highlighting the region’s shift from manual lines to digital factories. Domestic suppliers such as Estun Automation are winning share with competitively priced robotic arms, expanding the packaging automation market locally.
Europe drives adoption through sustainability regulation and Industry 4.0 grants. A Swedish facility cut plastic wrap by 80% via automated banding, satisfying circular-economy goals. Germany’s advanced machine builders add AI modules to retain export competitiveness. Elsewhere, Middle East and Africa pilot automated dairy lines to bolster food security, while South American plants in Brazil install palletizers to serve growing regional beverage demand. These diverse initiatives collectively extend the global packaging automation market footprint.

Competitive Landscape
The packaging automation market is fragmented. Robotics leaders ABB, FANUC, and KUKA leverage broad service nets and AI know-how to supply turnkey cells, while Syntegon, ULMA, and Multivac tailor equipment to sector-specific hygiene and format needs. Integrated hardware-software offerings are differentiators. ABB’s alliance with Mettler-Toledo connects lab scales to robots, illustrating convergence between analytical instruments and packaging lines.
M&A reshaped the value chain in 2024. Smurfit Kappa and WestRock merged for USD 12.7 billion, creating scale that favors standardized automation across combined mills. International Paper acquired DS Smith for USD 7.2 billion, driving similar integration. Automation vendors benefit as larger clients synchronize specifications, enabling repeatable cell deployments across global footprints.
Disruptors focus on plug-and-play cobots and subscription models. Formic’s RaaS platform logs 200,000 production hours at 99.8% uptime and lowers customer CAPEX. Zimmer’s flexible ZiMo cell ships pre-configured, cutting on-site engineering. The competitive environment rewards suppliers that merge technical depth with deployment simplicity, a dynamic expected to tighten as the packaging automation market matures.
Packaging Automation Industry Leaders
Multivac Group
Coesia SpA
ULMA Packaging
Syntegon Technology
Swisslog Healthcare
- *Disclaimer: Major Players sorted in no particular order

Recent Industry Developments
- May 2025: ProMach acquired DJS Systems, expanding into high-speed disposable food packaging automation ProMach.
- February 2025: CMC Packaging Automation partnered with Mondi to pioneer sustainable eCommerce packaging solutions Mondi.
- February 2025: ProMach announced new investments from BDT Capital Partners to fund acquisitions and technology development ProMach.
- August 2024: Duravant LLC bought T-TEK Material Handling, adding palletizing technology to its portfolio Packaging World.


Global Packaging Automation Market Report Scope
Packaging automation refers to the procedure of packaging a product without the need for human assistance. The study aims to analyze and understand the packaging automation market's current growth, opportunities, and challenges.
The scope of market analysis is segmented by product type (filling, labeling, case packaging, bagging, palletizing, capping, wrapping, and other product types), end-user (food, beverage, pharmaceuticals, personal care, and toiletries, industrial & chemicals, and other end-users), and geography (North America [United States and Canada], Europe [United Kingdom, France, Germany, Italy, Spain, and rest of Europe], Asia-Pacific [China, Japan, India, Australia, and rest of Asia-Pacific], Latin America [Brazil, Argentina, Mexico, and rest of Latin America], the Middle East, and Africa [Saudi Arabia, South Africa, Egypt, and rest of the Middle East and Africa]). The market sizes and forecasts are provided in terms of value in (USD) for all the above segments.
By Product Type
| Filling |
| Labeling |
| Case Packaging |
| Bagging |
| Palletizing |
| Capping |
| Wrapping |
| Other Product Types |
By End-user
| Food |
| Beverage |
| Pharmaceuticals |
| Personal Care and Toiletries |
| Industrial and Chemicals |
| Other End-users |
By Automation Level
| Fully-Automated Lines |
| Semi-Automated Lines |
| Collaborative/Hybrid Systems |
By Solution
| Hardware (Robots, Conveyors, Sensors) |
| Software (SCADA, MES, Analytics) |
| Services (Installation, Maintenance, Retrofits) |
By Packaging Stage
| Primary Packaging Automation |
| Secondary Packaging Automation |
| Tertiary / End-of-Line Automation |
By Geography
| North America | United States | |
| Canada | ||
| Mexico | ||
| Europe | Germany | |
| United Kingdom | ||
| France | ||
| Italy | ||
| Spain | ||
| Russia | ||
| Rest of Europe | ||
| Asia-Pacific | China | |
| India | ||
| Japan | ||
| South Korea | ||
| Australia and New Zealand | ||
| Rest of Asia-Pacific | ||
| Middle East and Africa | Middle East | United Arab Emirates |
| Saudi Arabia | ||
| Turkey | ||
| Rest of Middle East | ||
| Africa | South Africa | |
| Nigeria | ||
| Egypt | ||
| Rest of Africa | ||
| South America | Brazil | |
| Argentina | ||
| Rest of South America | ||
| By Product Type | Filling | ||
| Labeling | |||
| Case Packaging | |||
| Bagging | |||
| Palletizing | |||
| Capping | |||
| Wrapping | |||
| Other Product Types | |||
| By End-user | Food | ||
| Beverage | |||
| Pharmaceuticals | |||
| Personal Care and Toiletries | |||
| Industrial and Chemicals | |||
| Other End-users | |||
| By Automation Level | Fully-Automated Lines | ||
| Semi-Automated Lines | |||
| Collaborative/Hybrid Systems | |||
| By Solution | Hardware (Robots, Conveyors, Sensors) | ||
| Software (SCADA, MES, Analytics) | |||
| Services (Installation, Maintenance, Retrofits) | |||
| By Packaging Stage | Primary Packaging Automation | ||
| Secondary Packaging Automation | |||
| Tertiary / End-of-Line Automation | |||
| By Geography | North America | United States | |
| Canada | |||
| Mexico | |||
| Europe | Germany | ||
| United Kingdom | |||
| France | |||
| Italy | |||
| Spain | |||
| Russia | |||
| Rest of Europe | |||
| Asia-Pacific | China | ||
| India | |||
| Japan | |||
| South Korea | |||
| Australia and New Zealand | |||
| Rest of Asia-Pacific | |||
| Middle East and Africa | Middle East | United Arab Emirates | |
| Saudi Arabia | |||
| Turkey | |||
| Rest of Middle East | |||
| Africa | South Africa | ||
| Nigeria | |||
| Egypt | |||
| Rest of Africa | |||
| South America | Brazil | ||
| Argentina | |||
| Rest of South America | |||


Key Questions Answered in the Report
What is the current size of the packaging automation market?
The packaging automation market stands at USD 86.64 billion in 2026 and is projected to climb to USD 122.51 billion by 2031
What compound annual growth rate (CAGR) is expected for the packaging automation market between 2025 and 2031?
Industry revenue is forecast to rise at a 7.17% CAGR during the period 2026 to 2031
Which region is expanding fastest in packaging automation, and at what pace?
Asia-Pacific is the quickest-growing region, set to advance at a 10.32% CAGR through 2031 as China accelerates robotics investment
Which end-user segment shows the highest growth potential?
Pharmaceutical packaging is on track for an 11.55% CAGR, driven by USD 160 billion in U.S. plant upgrades aimed at flexible, serialized production
Why is secondary packaging automation attracting the greatest investment?
Secondary operations hold 41.05% of market revenue and are growing at 9.78% CAGR because right-sized boxing and robotic palletizing unlock large e-commerce productivity gains
How are Robots-as-a-Service (RaaS) models influencing adoption?
Subscription offerings delivering 99.8% uptime across 200,000 production hours are lowering capital barriers and accelerating deployment, especially among small and mid-sized enterprises.
Page last updated on:


