Interactive Packaging Market Size and Share
Market Overview
| Study Period | 2019 - 2030 |
|---|---|
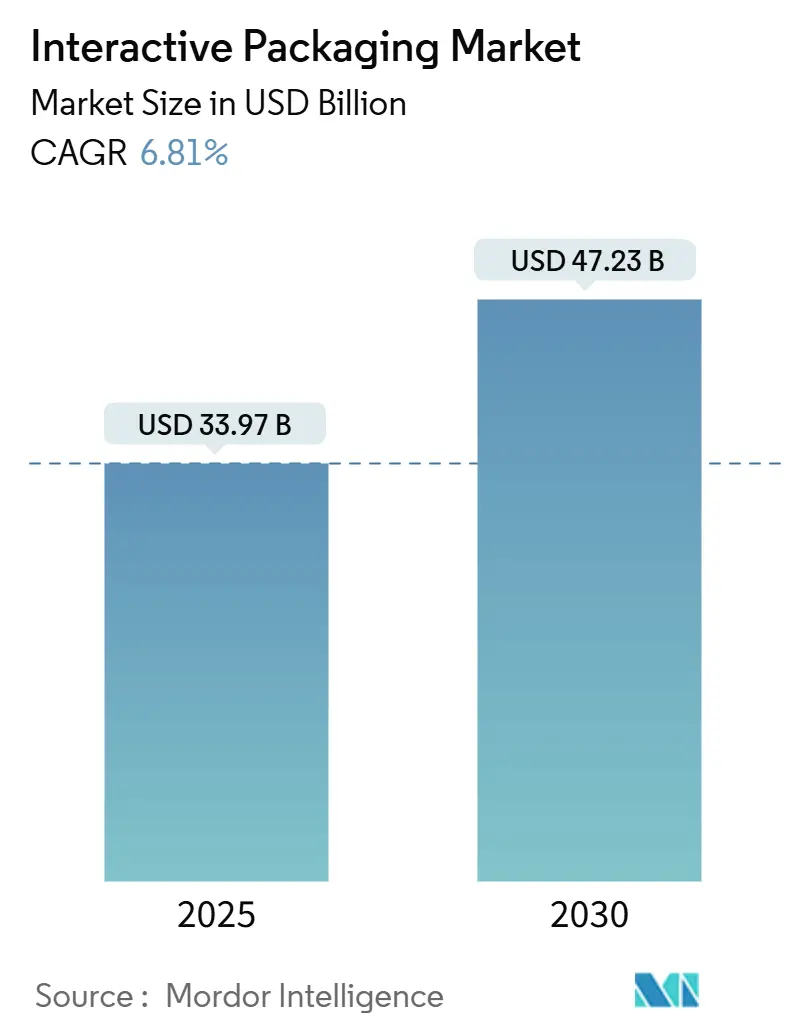
| Market Size (2025) | USD 33.97 Billion |
| Market Size (2030) | USD 47.23 Billion |
| Growth Rate (2025 - 2030) | 6.81% CAGR |
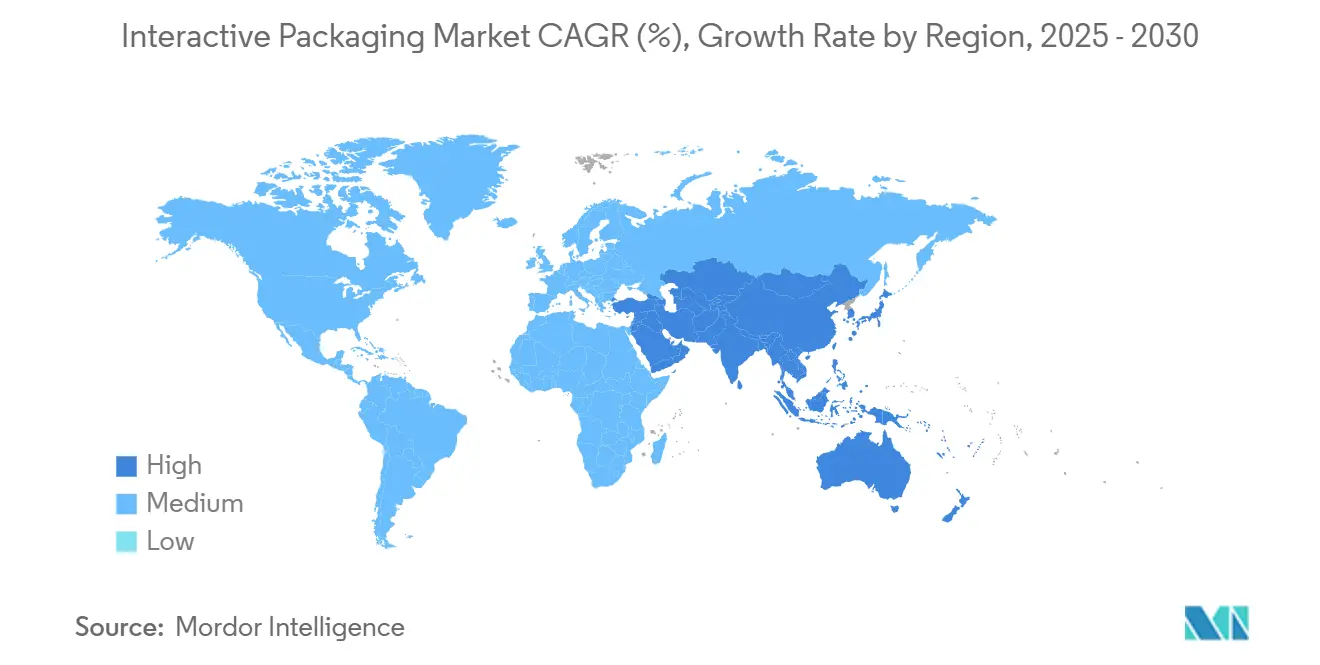
| Fastest Growing Market | Asia Pacific |
| Largest Market | North America |
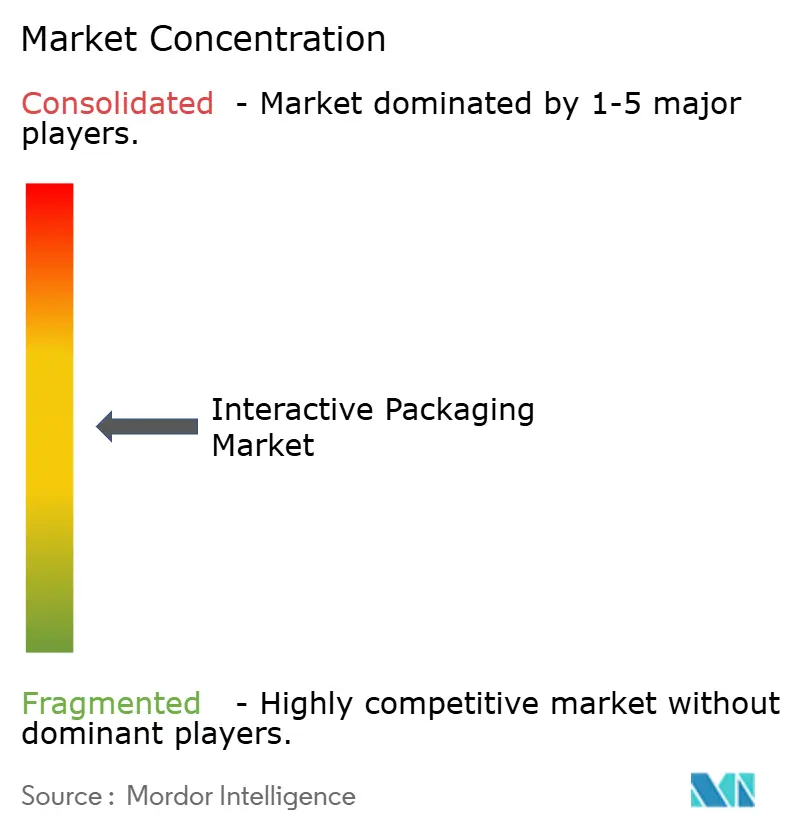
| Market Concentration | Medium |
Major Players *Disclaimer: Major Players sorted in no particular order Image © Mordor Intelligence. Reuse requires attribution under CC BY 4.0. | |
Interactive Packaging Market Analysis by Mordor Intelligence
The interactive packaging market size is projected to reach USD 33.97 billion in 2025 and is expected to expand to USD 47.23 billion by 2030, growing at a 6.81% CAGR, underscoring healthy momentum across the consumer goods, healthcare, and logistics segments. Digital transformation strategies, tighter traceability mandates, and declining sensor costs converge to maintain a steady growth curve while nudging the market away from novelty-driven engagement toward operational and regulatory use cases. North America retains a first-mover advantage through its entrenched RFID programs and e-commerce scale; however, structural growth clearly tilts toward the Asia-Pacific region, where manufacturing scale, middle-class spending power, and national digitalization agendas intersect. On the technology front, mature RFID still commands budget share for inventory efficiency, but printed sensors and low-cost NFC are widening the addressable user base as unit economics improve. End-of-life compliance and data-privacy overheads temper absolute growth, although they also catalyze design innovation in terms of recycling compatibility and privacy-preserving architectures.[1]European Commission, “Packaging and Packaging Waste,” environment.ec.europa.eu
Key Report Takeaways
- By packaging type, the interactive packaging market size for NFC-embedded flexible pouches is projected to grow at an 8.51% CAGR between 2025-2030.
- By technology, RFID captured 42.59% of the interactive packaging market share in 2024.
- By end-user, the interactive packaging market size for the pharmaceutical segment is projected to grow at an 8.17% CAGR between 2025-2030.
- By functionality, consumer engagement captured 36.82% of the interactive packaging market share in 2024.
- By geography, the interactive packaging market size for the Asia-Pacific segment is projected to grow at a 7.96% CAGR between 2025-2030.
Global Interactive Packaging Market Trends and Insights
Drivers Impact Analysis*
| Driver | (~) % Impact on CAGR Forecast | Geographic Relevance | Impact Timeline |
|---|---|---|---|
| Surge in connected-pack ecosystems for omnichannel retail | +1.2% | Global - early adoption in North America and Europe | Medium term (2-4 years) |
| Regulatory push for extended producer-responsibility and traceability | +1.8% | Europe core, rolling out to North America and Asia-Pacific | Long term (≥ 4 years) |
| Falling unit cost of printed and flexible electronics | +1.4% | Global manufacturing, cost benefits realized in Asia-Pacific first | Medium term (2-4 years) |
| AI-powered real-time freshness sensing in food chains | +1.1% | Global food supply chains, premium segments first | Medium term (2-4 years) |
| Advent of digital watermarks enabling automated sorting | +0.7% | Europe, voluntary uptake in North America | Long term (≥ 4 years) |
| Acceleration of direct-to-consumer models needing engagement analytics | +0.9% | North America and Europe, emerging in Asia-Pacific urban centers | Short term (≤ 2 years) |
| Source: Mordor Intelligence | |||
Surge in Connected-Pack Ecosystems for Omnichannel Retail
Retail majors are transforming packaging into a data conduit that synchronizes store, warehouse, and consumer touchpoints. Walmart’s chain-wide RFID rollout improved on-shelf availability by 16% and forced hundreds of suppliers to embed compatible inlays, turning compliance into a table-stakes requirement rather than a competitive edge.[2]Walmart Corporate Affairs, “Walmart Advances RFID Rollout Across Stores,” corporate.walmart.com Point-of-sale systems now capture SKU-level scans that feed replenishment algorithms while also prompting consumer opt-in engagement sequences at home. These network effects compress the adoption curve across the interactive packaging market, accelerating platform standardization.
Regulatory Push for Extended Producer-Responsibility and Traceability
Europe’s Packaging and Packaging Waste Regulation mandates digital product passports that document material composition and lifecycle data, effectively monetizing traceability by linking non-compliance to higher fees. Comparable rules under the Drug Supply Chain Security Act in the United States make serialization non-negotiable for pharmaceuticals. Together these frameworks elevate interactive identification from discretionary marketing spend to mandatory license-to-operate, lifting baseline demand across the interactive packaging market.
Acceleration of Direct-to-Consumer Models Needing Engagement Analytics
Printed organic semiconductors and roll-to-roll processes have pushed basic sensor unit costs below USD 0.10, unlocking mass-volume food and beverage deployments that were price-gated only two years ago. Brand owners now weigh incremental spend against avoided recalls and richer consumer data, rather than against static graphics or loyalty inserts. Lower capex for converters further smooths the upgrade path, reinforcing the growth trajectory of the interactive packaging market.
Falling Unit Cost of Printed and Flexible Electronics
Miniaturized gas and temperature sensors embedded in cartons deliver continuous quality telemetry to cloud dashboards. Machine-learning models translate raw signals into shelf-life predictions, enabling dynamic pricing and targeted waste reduction. Early pilots in premium seafood have cut spoilage by 28%, setting benchmarks other perishables are poised to follow. The commercial logic of fewer write-offs and enhanced safety resonates with retailers and regulators alike, boosting medium-term CAGR uplift.
Restraints Impact Analysis*
| Restraint | (~) % Impact on CAGR Forecast | Geographic Relevance | Impact Timeline |
|---|---|---|---|
| Data-privacy compliance burden for serialized packs | -0.8% | Europe and North America, expanding globally | Short term (≤ 2 years) |
| Limited recycling infrastructure for embedded sensors | -1.1% | Global, most acute in emerging markets | Long term (≥ 4 years) |
| Brand owner hesitancy due to ROI uncertainty in emerging markets | -0.6% | Asia-Pacific emerging, Latin America, Africa | Medium term (2-4 years) |
| Interoperability gaps among IoT standards | -0.4% | Global | Medium term (2-4 years) |
| Source: Mordor Intelligence | |||
Data-Privacy Compliance Burden for Serialized Packs
GDPR stipulates explicit consent for every consumer data point, forcing brand owners to build regionally siloed databases and consent-management layers that can exceed USD 2 million in upfront spend EDPB. Smaller manufacturers face disproportionate cost-to-revenue ratios, slowing adoption across parts of the interactive packaging market until turnkey compliance solutions mature.
Limited Recycling Infrastructure for Embedded Sensors
Municipal facilities are not yet equipped to delaminate inlays or printed circuits from paper and plastic substrates, risking contamination and downstream processing shutdowns. Extended producer-responsibility fees could escalate if brands cannot demonstrate recyclability, creating a financial headwind that subtracts 1.1 percentage points from the forecast CAGR.
*Our forecasts treat driver/restraint impacts as directional, not additive. The impact forecasts reflect baseline growth, mix effects, and variable interactions.
Segment Analysis
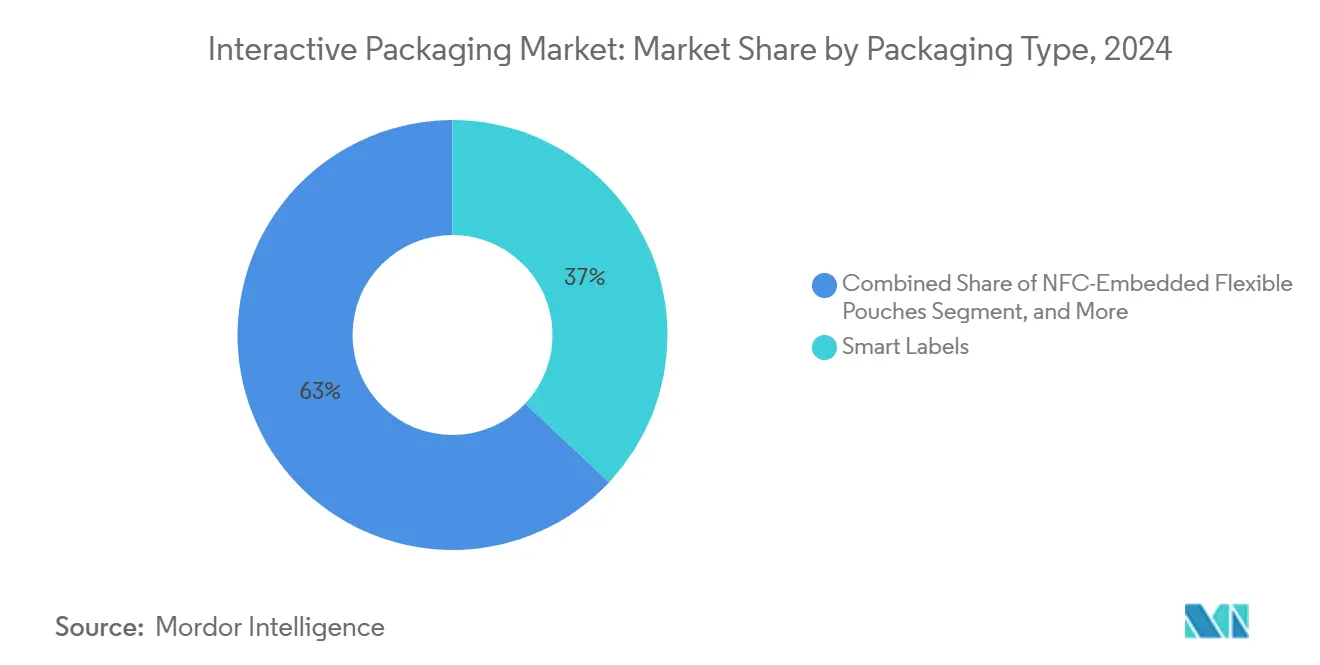
By Packaging Type - Smart Labels Anchor Leadership While Flexible Pouches Accelerate
Smart labels secured 37.01% of the interactive packaging market share in 2024, illustrating their versatility and compatibility with existing converting lines. The format ranges from simple QR graphics to NFC tags, letting brand managers scale interactivity without disruptive capex. Value-added versions integrate RFID for warehouse scanning, closing data gaps between pallets and point-of-sale. Cost per unit continues to slide as volume climbs, keeping the format at the heart of the interactive packaging market.
NFC-enabled flexible pouches are tracking an 8.51% CAGR, the fastest among all formats. Their light weight and barrier performance resonate with beverage, snack, and personal-care categories. Cost-efficient printed antennas preserve package aesthetics while retaining recyclability targets. For mainstream adoption, recyclers will need validated delamination protocols, an area where early pilots funded by industry consortiums are making progress. As these hurdles clear, flexible pouches are positioned to expand beyond premium lines into mass categories, injecting fresh momentum into the interactive packaging market size at the mid-decade mark.


By Technology - RFID Dominates Yet Printed Sensors Outpace on Growth
RFID accounted for 42.59% of revenue in 2024, thanks to entrenched retail mandates and superior bulk-read efficiency. Item-level tags streamline omnichannel fulfillment, enabling ship-from-store models with near-real-time accuracy. The technology’s ecosystem, readers, middleware, and analytics, is mature, making incremental expansion straightforward for global retailers. Continuous reader price erosion keeps total cost of ownership manageable, preserving RFID’s foundational role in the interactive packaging market.
Printed sensors, clocking a 9.28% CAGR, are redefining what a package can monitor. Gas, humidity, and pH sensors printed on flexible substrates now pair with thin-film batteries or even energy-harvesting circuits, delivering supply-chain visibility at a cost of pennies per unit.[3]Nature Electronics, “Advances in Organic Semiconductor Sensors,” nature.com Their low-profile suits curved or flexible formats, open up use cases in sachets and blister packs where rigid electronics fail. As AI frameworks digest sensor feeds, predictive maintenance of cold chains and early spoilage alerts shift from pilot to production. The ascendancy of printed sensors amplifies the trajectory of the interactive packaging market size while diversifying feature sets.
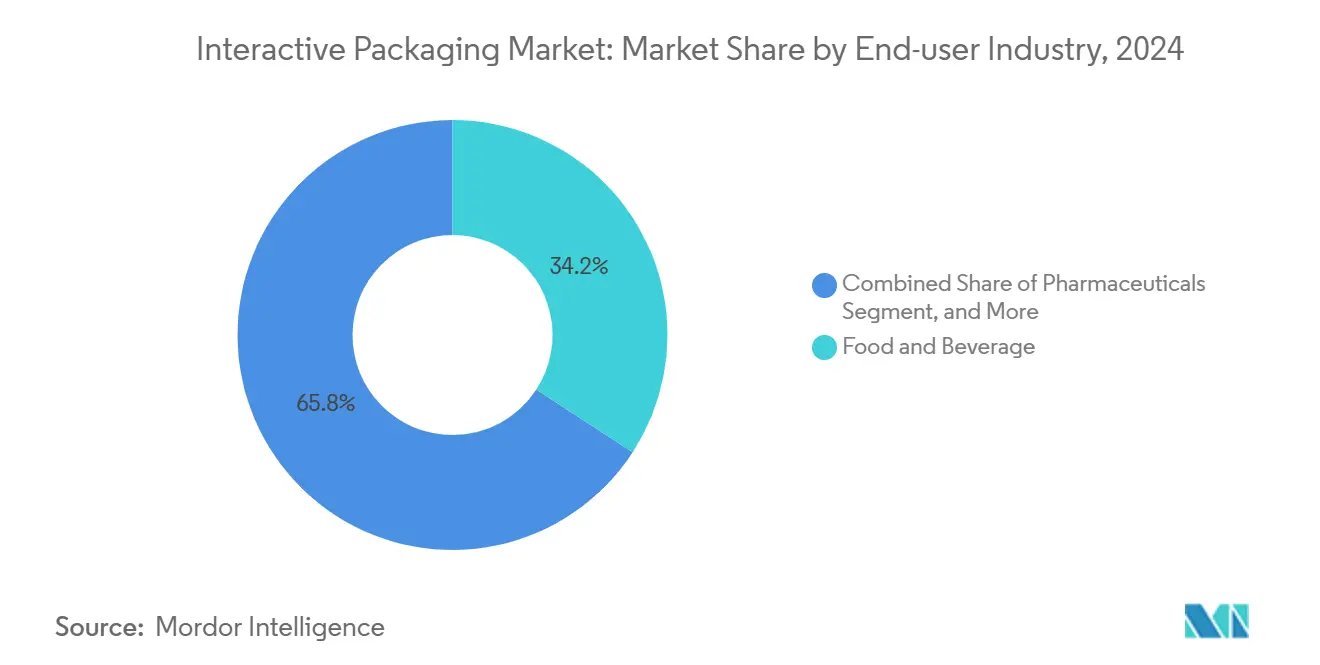
By End-User Industry - Food and Beverage Leads, Pharmaceuticals Accelerate
Food and beverage captured 34.19% of 2024 revenue, leveraging consumer curiosity around provenance, nutrition, and freshness. QR or NFC taps unlock ingredient stories, allergen alerts, and pairing suggestions, shaping repeat-purchase behavior. Supply-side drivers include new food safety regulations that reward traceability data, incentivizing brand adoption. With global retailers piloting dynamic pricing based on sensor-verified shelf life, the segment remains the mainstay demand engine for the interactive packaging market.
Pharmaceuticals are advancing at an 8.17% CAGR under non-negotiable serialization deadlines and stricter counterfeit controls. DSCSA barcode harmonization in the United States and similar directives worldwide convert compliance timelines into procurement deadlines. Smart blister packs with adherence tracking and temperature loggers inside vials are transitioning from clinical trials to large-scale generic products. Given that reimbursement bodies now factor authentication into quality ratings, the segment’s velocity is expected to outstrip discretionary consumer categories, enlarging the interactive packaging market size among regulated industries.
By Functionality - Consumer Engagement Tops, Condition Monitoring Rises Fast
Consumer engagement retained a 36.82% share in 2024, cementing packaging’s role as a customer experience platform. Loyalty enrollment, gamified promotions, and augmented reality overlays drive dwell time and data capture, fueling CRM enrichment. High attach rates in cosmetics and craft beverages keep advertisers allocating budget to interactive triggers. The approach also dovetails with direct-to-consumer subscription models that seek recurring touchpoints without third-party intermediaries.
Condition monitoring, rising at an 8.89% CAGR, meets expanding regulatory and retailer demand for verifiable freshness and safety. Printed time-temperature indicators and gas sensors signal out-of-spec exposure, automating quality decisions long before point-of-sale. Cold-chain pharmaceuticals and high-value perishables such as seafood are early beneficiaries, with insurers beginning to mandate sensor evidence for claims processing. Integration with blockchain ledgers further enhances trust in shared data, giving condition monitoring a significant impact on the interactive packaging market.
Geography Analysis
North America’s 31.59% stake reflects a decade of RFID infrastructure investment, advanced e-commerce penetration, and proactive food safety regulation. U.S. pharmaceutical serialization and major retailer mandates act as sustained demand pumps, while Canada’s extended producer-responsibility rules elevate traceability capabilities across grocery and beverage lines. Mexico contributes manufacturing flexibility and cost offsets that anchor regional supply chains feeding the interactive packaging market.
Europe holds the number-two position, underpinned by the Packaging and Packaging Waste Regulation that makes digital passports compulsory for targeted categories. Germany and France spearhead industrial adoption, leaning on engineering depth to integrate sensors into high-speed lines. Italy and Spain expand demand via export-oriented food and wine producers seeking authenticated provenance to secure premium price points. The United Kingdom mirrors the trajectory by aligning post-Brexit regulations with EU standards, ensuring market continuity.
The Asia-Pacific region, projected to grow at a 7.96% CAGR, is the fastest-growing theater. China’s cost leadership in flexible electronics compresses sensor prices worldwide, while state-backed digital factory programs accelerate uptake in domestic supply chains. Japan brings precision packaging machinery and miniaturized component breakthroughs that set new benchmarks for form factor and reliability. India’s scaling vaccine and formulation exports amplify serialization spend, and South Korea deploys NFC-centric consumer engagement across beauty and electronics verticals. Although regulatory heterogeneity persists, accelerating middle-class consumption and supportive government roadmaps solidify Asia-Pacific as the prime expansion corridor for the interactive packaging market.

Competitive Landscape
The interactive packaging market sits at a moderate concentration level where scale heavyweights coexist with niche innovators. Avery Dennison and Amcor couple global converting capacity with targeted technology acquisitions to deliver turnkey solutions. Their breadth allows rapid customer onboarding across continents, positioning them as preferred partners for brand owners seeking single-supplier accountability.
Specialists such as Smartrac and PragmatIC Semiconductor concentrate on RFID inlays and flexible ICs, generating intellectual property moats that larger converters license rather than replicate. Strategic collaborations weave sensor know-how into established package formats, compressing time-to-market while safeguarding quality. Partnerships between tech firms and packaging converters proliferate, indicating that vertical integration is the competitive currency of the decade.
White-space niches persist in pharmaceutical cold chains, luxury goods authentication, and circularity-focused design. Mid-tier converters able to bundle compliance documentation, electronics integration, and sustainability validation gain entry to procurement shortlists. As ecosystem interoperability improves, competitive emphasis is expected to shift from tag cost to data-analytics capability, nudging the interactive packaging market toward service-centric revenue models.
Interactive Packaging Industry Leaders
Avery Dennison Corporation
Amcor plc
Stora Enso Oyj
Sealed Air Corporation
Tetra Pak International S.A.
- *Disclaimer: Major Players sorted in no particular order

Recent Industry Developments
- January 2025: Avery Dennison began commissioning a new flexible electronics line in the Netherlands, on schedule to triple printed sensor output by 2026.
- September 2024: Avery Dennison announced a USD 150 million expansion of European flexible electronics capacity targeting pharmaceutical serialization and cold-chain food.
- August 2024: Amcor finalized its USD 85 million acquisition of Kezzler AS, embedding blockchain traceability into its global portfolio.
- July 2024: Tetra Pak launched the Connected Package platform with Microsoft Azure, handling more than 1 million NFC interactions per day.


Global Interactive Packaging Market Report Scope
| Smart Labels |
| RFID-Enabled Cartons |
| Augmented Reality Cartons |
| NFC-Embedded Flexible Pouches |
| Intelligent Closures |
| RFID |
| NFC |
| QR and Digital Watermark |
| Printed Sensors |
| Other Emerging Technologies |
| Food and Beverage |
| Pharmaceuticals |
| Cosmetics and Personal Care |
| Consumer Electronics |
| Logistics and Supply Chain |
| Product Authentication |
| Consumer Engagement |
| Condition Monitoring |
| Asset Tracking |
| Anti-theft and Tamper Evidence |
| North America | United States | |
| Canada | ||
| Mexico | ||
| South America | Brazil | |
| Argentina | ||
| Rest of South America | ||
| Europe | Germany | |
| United Kingdom | ||
| France | ||
| Italy | ||
| Spain | ||
| Russia | ||
| Rest of Europe | ||
| Asia-Pacific | China | |
| Japan | ||
| India | ||
| South Korea | ||
| Rest of Asia-Pacific | ||
| Middle East and Africa | Middle East | Saudi Arabia |
| United Arab Emirates | ||
| Turkey | ||
| Rest of Middle East | ||
| Africa | South Africa | |
| Nigeria | ||
| Rest of Africa | ||
| By Packaging Type | Smart Labels | ||
| RFID-Enabled Cartons | |||
| Augmented Reality Cartons | |||
| NFC-Embedded Flexible Pouches | |||
| Intelligent Closures | |||
| By Technology | RFID | ||
| NFC | |||
| QR and Digital Watermark | |||
| Printed Sensors | |||
| Other Emerging Technologies | |||
| By End-user Industry | Food and Beverage | ||
| Pharmaceuticals | |||
| Cosmetics and Personal Care | |||
| Consumer Electronics | |||
| Logistics and Supply Chain | |||
| By Functionality | Product Authentication | ||
| Consumer Engagement | |||
| Condition Monitoring | |||
| Asset Tracking | |||
| Anti-theft and Tamper Evidence | |||
| By Geography | North America | United States | |
| Canada | |||
| Mexico | |||
| South America | Brazil | ||
| Argentina | |||
| Rest of South America | |||
| Europe | Germany | ||
| United Kingdom | |||
| France | |||
| Italy | |||
| Spain | |||
| Russia | |||
| Rest of Europe | |||
| Asia-Pacific | China | ||
| Japan | |||
| India | |||
| South Korea | |||
| Rest of Asia-Pacific | |||
| Middle East and Africa | Middle East | Saudi Arabia | |
| United Arab Emirates | |||
| Turkey | |||
| Rest of Middle East | |||
| Africa | South Africa | ||
| Nigeria | |||
| Rest of Africa | |||


Key Questions Answered in the Report
What is the current value of the interactive packaging market?
The interactive packaging market size is valued at USD 33.97 billion in 2025.
How fast is the sector expected to grow over the next five years?
Aggregate revenue is forecast to reach USD 47.23 billion by 2030, translating into a 6.81% CAGR.
Which packaging format is gaining traction the fastest?
NFC-embedded flexible pouches are slated to expand at the highest 8.51% CAGR through 2030.
Which end-user vertical shows the strongest growth outlook?
Pharmaceuticals lead on growth with an 8.17% CAGR as serialization compliance becomes mandatory.
Why are printed sensors important for future packaging?
Falling unit costs below USD 0.10 now let brand owners integrate real-time condition monitoring, expanding functional value beyond simple authentication.
How are regulations shaping adoption trends?
Mandatory digital passports in Europe and U.S. drug serialization rules convert traceability from optional to compulsory, sharply boosting adoption across mature supply chains.
Page last updated on:


