Spatial Computing Market Size and Share
Market Overview
| Study Period | 2019 - 2030 |
|---|---|
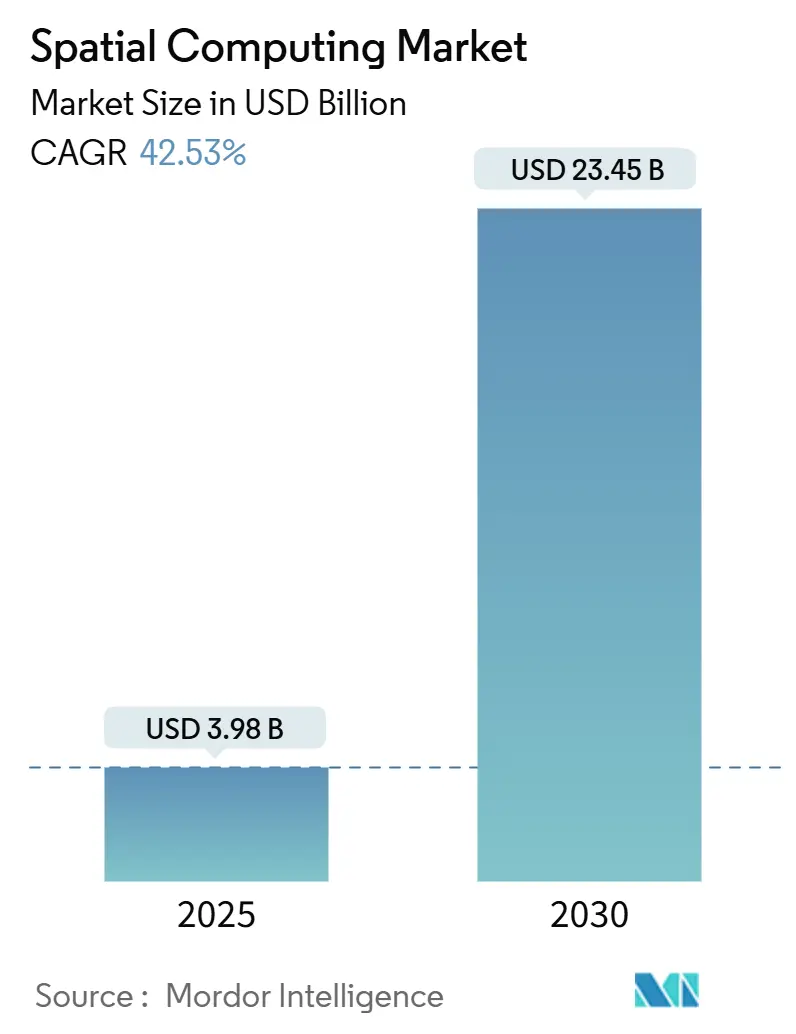
| Market Size (2025) | USD 3.98 Billion |
| Market Size (2030) | USD 23.45 Billion |
| Growth Rate (2025 - 2030) | 42.53% CAGR |
| Fastest Growing Market | Asia Pacific |
| Largest Market | North America |
| Market Concentration | Medium |
Major Players *Disclaimer: Major Players sorted in no particular order Image © Mordor Intelligence. Reuse requires attribution under CC BY 4.0. | |
Spatial Computing Market Analysis by Mordor Intelligence
The Spatial Computing Market size is estimated at USD 3.98 billion in 2025, and is expected to reach USD 23.45 billion by 2030, at a CAGR of 42.53% during the forecast period (2025-2030).
This steep trajectory is anchored in falling headset prices, expanding 5G coverage, and growing enterprise use of digital twins. Hardware maintains its lead but services are advancing quickly as organizations look for integration support, cloud rendering, and managed offerings. Platform vendors now embed AI in perception engines, while telecom operators invest in edge nodes that trim motion-to-photon latency below 20 milliseconds. Regulatory clarity on privacy in major regions is also improving buyer confidence, moving many pilots into full-scale roll-outs [1]NVIDIA Blog, “NVIDIA Expands Omniverse Blueprint for AI Factory Digital Twins With New Ecosystem Integrations, Development Tools,” nvidia.com.
Key Report Takeaways
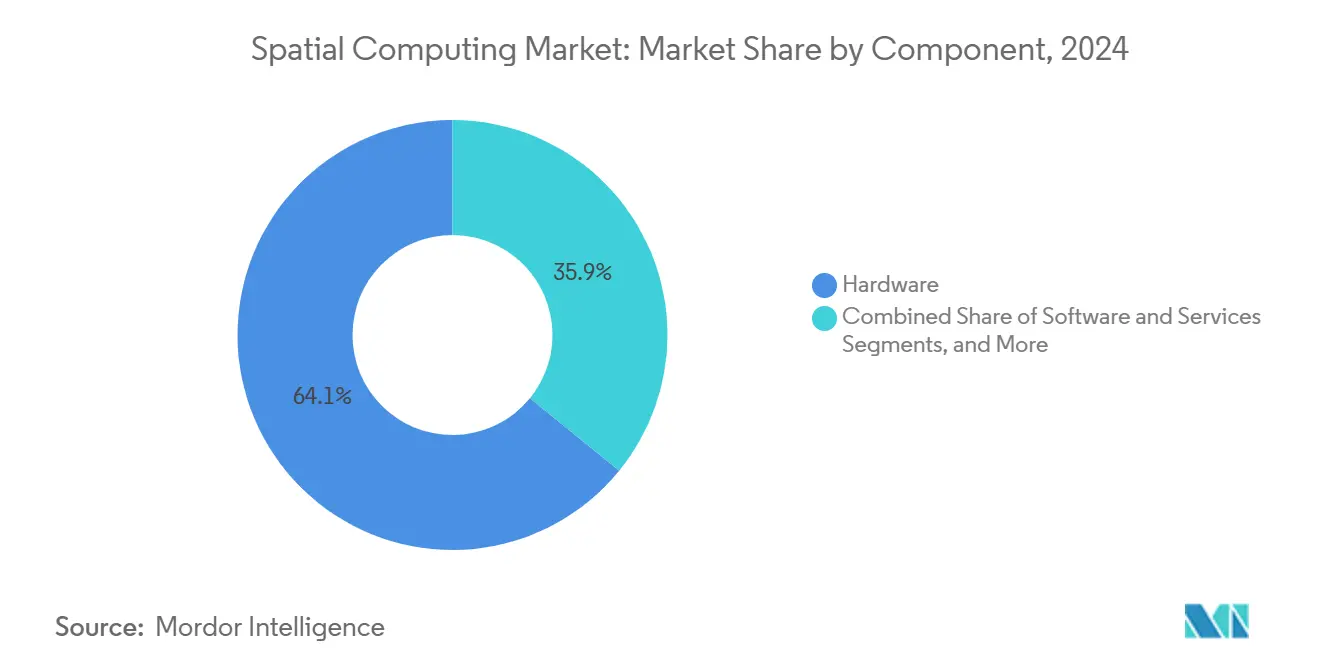
- By component, hardware captured 64.12% of the spatial computing market share in 2024; services are projected to expand at a 44.02% CAGR through 2030.
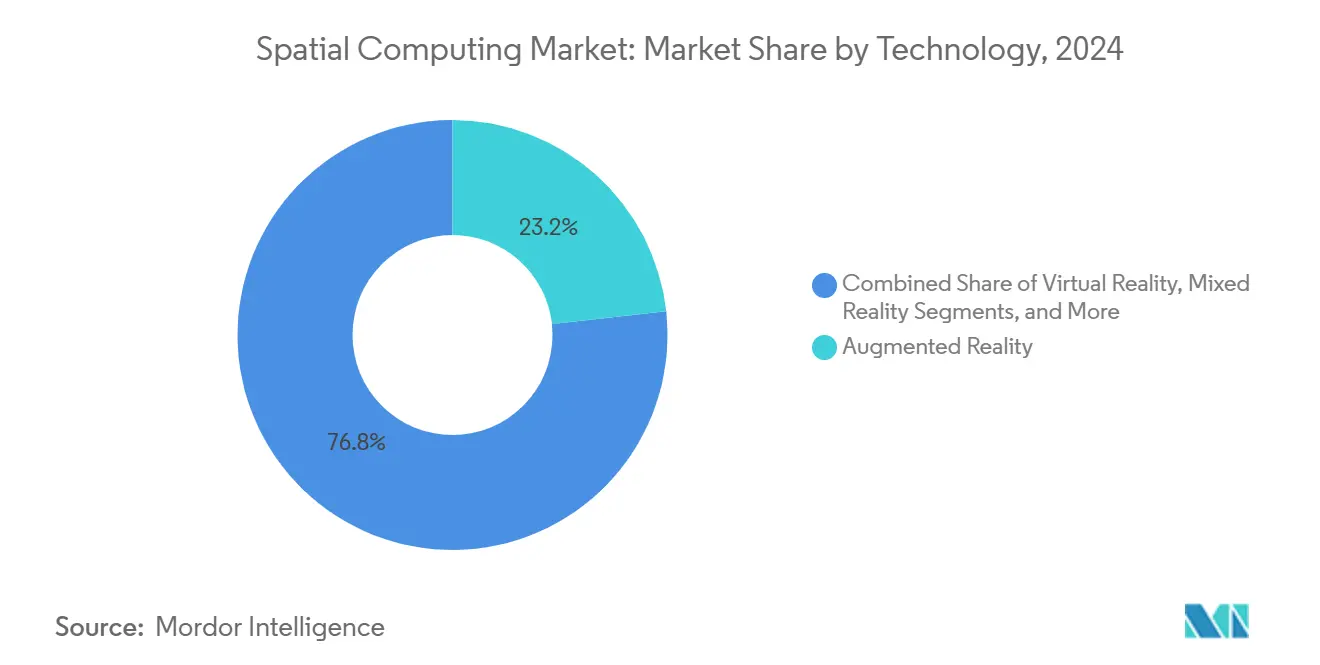
- By technology, augmented reality captured 23.24% of the spatial computing market share in 2024; artificial intelligence is projected to expand at a 43.56% CAGR through 2030.
- By end-user, gaming and eSports held an 18.11% slice of the spatial computing market size in 2024, while architecture/construction is advancing at a 43.96% CAGR to 2030.
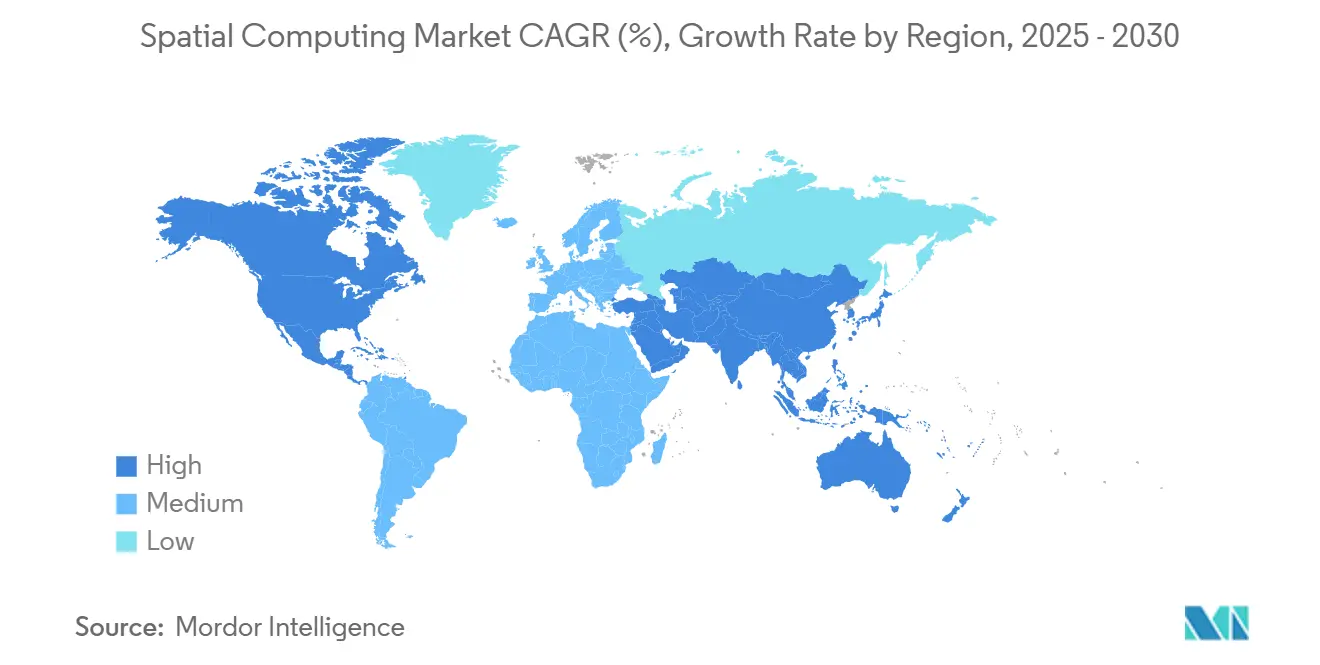
- By geography, North America accounted for 39.45% of 2024 revenue; Asia-Pacific is forecast to post a 44.12% CAGR through 2030.
Global Spatial Computing Market Trends and Insights
Drivers Impact Analysis*
| Driver | (~)% Impact on CAGR Forecast | Geographic Relevance | Impact Timeline |
|---|---|---|---|
| Cost-down mass-market XR headsets | +8.5% | Global, with early gains in North America and Asia-Pacific | Medium term (2-4 years) |
| Edge-enabled ultra-low-latency networking (5G/6G) | +7.2% | North America and EU leading, APAC core expansion | Long term (≥ 4 years) |
| Enterprise digital-twin roll-outs | +6.8% | Global, concentrated in industrial regions | Medium term (2-4 years) |
| Apple Vision Pro ecosystem effects | +5.1% | North America and EU, spillover to APAC | Short term (≤ 2 years) |
| GEOINT-enabled spatial data fusion | +3.4% | Government sectors globally | Long term (≥ 4 years) |
| Surgical-simulation accreditation mandates | +2.7% | Developed markets with advanced healthcare systems | Medium term (2-4 years) |
| Source: Mordor Intelligence | |||
Cost-down Mass-Market XR Headsets Drive Consumer Adoption
Price erosion is redrawing the spatial computing market landscape. Snapdragon XR2+ Gen 2 allows 4.3 K-per-eye optics while cutting bill-of-materials costs, pushing average headset street prices under USD 1,000. The lower entry point expands the addressable base beyond enterprise pilots to mainstream households, echoing the smartphone diffusion curve. Samsung’s joint program with Google and Qualcomm on mixed-reality glasses is expected to supply consumer channels in 2026 and further amplify demand. Higher volumes, in turn, allow chipset makers to negotiate better wafer pricing, reinforcing a virtuous cycle of affordability [2]Qualcomm, “Qualcomm Accelerates New Wave of Mixed Reality Experiences with Snapdragon XR2+ Gen 2,” qualcomm.com.
Edge-Enabled Ultra-Low-Latency Networking Transforms Real-Time Applications
5G standalone deployments now cover most major metro areas in the United States, Germany, South Korea, and China, accelerating real-time use cases in the spatial computing market. Distributed edge nodes shrink round-trip latency to sub-20 millisecond territory, a critical threshold for nausea-free extended reality. Industrial firms are trialing private 5G slices for coordinated robotics and remote assistance, while healthcare providers test telesurgery rigs over dedicated multi-access edge compute clusters. Standards bodies have baked AI-assisted routing into early 6G drafts, signaling that intelligence at the radio edge will be native, not bolted on [3]MIT Technology Review Insights, “AI-powered 6G networks will reshape digital interactions,” technologyreview.com.
Enterprise Digital-Twin Roll-outs Accelerate Industrial Transformation
More than 40% of Global 2000 manufacturers now maintain at least one production digital twin, reinforcing adoption across the spatial computing market, and many run them on NVIDIA Omniverse tied to Siemens or SAP data hubs. Automotive groups such as Hyundai model entire assembly lines, spotting cycle-time bottlenecks and validating robot choreography months before hardware is shipped. Demonstrated ROI, 10-15% reduction in downtime, and up to 30% faster product iteration have convinced finance teams to green-light multiyear spatial computing budgets. Integration consultancies consequently see a revenue surge in simulation orchestration and data-ops services.
Apple Vision Pro Ecosystem Effects Catalyze Developer Innovation
Vision Pro’s hand- and eye-tracking stack offers new input primitives that developers can port to multiplatform engines. Healthcare studios pilot training modules for arthroscopy and cardiac procedures, while media firms prototype volumetric sports viewing. Although initial unit volumes remain niche, the device raises consumer awareness and attracts VC capital into peripheral tool chains such as photogrammetry kits and spatial audio plug-ins. Competing vendors accelerate their release cycles, which keeps the platform race heated and fuels software demand across the spatial computing market.
Restraints Impact Analysis*
| Restraint | (~)% Impact on CAGR Forecast | Geographic Relevance | Impact Timeline |
|---|---|---|---|
| High upfront hardware CAPEX | -4.8% | Global, particularly in price-sensitive markets | Short term (≤ 2 years) |
| Data privacy and cybersecurity gaps | -3.6% | EU (GDPR compliance), North America, Asia-Pacific | Medium term (2-4 years) |
| Lack of cross-platform spatial-map standards | -2.9% | Global, affecting interoperability | Long term (≥ 4 years) |
| Wearable thermal and battery limits | -2.1% | Mobile and untethered applications globally | Medium term (2-4 years) |
| Source: Mordor Intelligence | |||
High Upfront Hardware CAPEX Constrains Enterprise Deployment Scale
Full-featured spatial projects in the spatial computing market still require USD 50,000-500,000 in headsets, sensors, render servers, and software. Small firms hesitate to commit capital without proven payback periods. Equipment leasing helps, but short refresh cycles complicate ROI modelling. European buyers face additional outlays to satisfy GDPR hosting mandates, which often means co-locating edge gear in certified data centers, adding 10-15% to budgeted spend [4]XRSI, “XRSI Privacy Framework,” xrsi.org .
Data privacy and Cybersecurity Gaps Threaten Enterprise Confidence
XR systems collect biometric markers such as gaze vectors and hand geometry that could reveal trade secrets or health conditions. Current security stacks seldom encrypt all telemetry, leaving exposures in transit and at rest. Compliance teams demand end-to-end controls before approving roll-outs, slowing deal velocity. Industry groups have floated frameworks, yet no global standard matches the comprehensive coverage of payment card PCI-DSS, leaving adoption uneven and enforcement spotty.
*Our forecasts treat driver/restraint impacts as directional, not additive. The impact forecasts reflect baseline growth, mix effects, and variable interactions.
Segment Analysis
By Component: Hardware Foundation Enables Services Growth
Hardware still supplies the bulk of 2024 revenue at 64.12% of the spatial computing market share, reflecting costly head-mounted displays, optical engines, and depth sensors. Apple Vision Pro and HoloLens 2 both retail above USD 2,000, inflating average selling prices. The spatial computing market size linked to hardware alone climbed to USD 2.55 billion in 2025. However, services are scaling faster, expanding at a 44.02% CAGR through 2030 as enterprises demand cloud rendering, managed device fleets, and real-time collaboration tool chains.
System integrators bundle Omniverse, Unity, and SAP connectors into turnkey offerings, capturing annuity streams that dwarf one-off hardware margins. Vendors also monetize digital twin subscriptions and AI inference APIs that run on cloud GPUs rather than local cores. As headset ASPs decline, services revenue cushions vendor P&Ls and redirects competition toward platform stickiness.


By Technology: Augmented Reality Leadership Faces AI Disruption
Augmented reality owned 23.24% of 2024 revenue in the spatial computing market, owing to its overlays-on-world model that slots neatly into maintenance and training workflows. AR-guided assembly saved some aerospace plants up to 25% in labor hours. Meanwhile, AI engines that power scene understanding are scaling at a 43.56% CAGR, the fastest within the taxonomy. Spatial mapping, object segmentation, and procedural asset generation all lean on transformer models trained on synthetic data, moving the value stack toward AI middleware.
Virtual reality retains a stronghold in eSports and design review, while mixed reality blends optical-see-through with environmental occlusion for healthcare and defense. Further down, computer vision and SLAM algorithms map spaces for robot navigation, and cloud/edge rendering lets lower-power devices stream advanced visuals. AI upgrades AR accuracy, while VR worlds become twin proxies for AI simulations, looping innovations back into every layer of the spatial computing market.
By End-User Vertical: Gaming Dominance Yields to Enterprise Applications
Gaming and eSports delivered 18.11% of 2024 turnover in the spatial computing market, owing to Quest-class hardware and established distribution on Steam VR. Competitive titles such as Echo VR validate demand for 90 Hz, low-latency play that requires robust rendering stacks. Yet architecture/construction is sprinting ahead at a 43.96% CAGR as builders overlay BIM data onto job sites, shaving weeks off rework cycles.
Healthcare adopts patient-specific holographic planning tools, while automotive OEMs iterate cabin concepts in days instead of months. Energy firms twin offshore platforms for predictive maintenance, and retail pilots interactive planograms that raise basket size. Government agencies test GEOINT fusion for disaster-response planning. Each use case underscores how immersive visualization accelerates decision loops and unlocks tangible ROI beyond entertainment.
Geography Analysis
North America captured 39.45% of 2024 revenue in the spatial computing market, driven by Meta’s USD 100 billion Reality Labs spend and Microsoft’s HoloLens contracts with defense and enterprise accounts. U.S. cloud titans supply elastic GPU farms, and telecoms such as Verizon host private 5G slices for industrial campuses. Canada contributes AI frameworks out of Montreal research hubs, while Mexico’s maquiladora corridor deploys digital twins to optimize automotive paint shops.
Asia-Pacific is the growth hotspot, advancing at a 44.12% CAGR through 2030. China’s metaverse action plan seeks to nurture 3-5 global champions by 2025, funneling low-interest loans into headset fabs and content studios. Japan invests in robotics-AR convergence, pairing collaborative bots with spatial UIs on the factory floor. South Korea tops 90% population 5G coverage, enabling cloud-rendered XR gaming cafés. India’s 850 million smartphone users will receive lightweight AR glasses tethered to handsets, leapfrogging power-hungry standalone rigs.
Europe holds steady, propelled by Germany’s Industrie 4.0 grants that co-fund Omniverse factories at BMW and Schaeffler. The United Kingdom’s fintech labs test volumetric trading dashboards, while France’s aerospace suppliers use mixed reality for wing assembly checks. Strict GDPR rules force on-premises edge nodes, spurring a regional service ecosystem around compliant hosting. Latin America and the Middle East, and Africa are earlier-stage, but mobile-first AR campaigns in retail and agriculture indicate a rising appetite for cost-efficient spatial experiences.
Mordor Intelligence provides coverage of the spatial computing market across other key regional markets. Detailed country-level analysis extends to United States incorporating local coverage and market participation, as required.

Competitive Landscape
Spatial computing remains semi-consolidated. Meta leads consumer shipments with Quest and Ray-Ban smart eyewear. Microsoft retains enterprise credibility via HoloLens and Mesh software. Apple’s entrance with Vision Pro raises the bar for premium optics and hands-free UI. Google focuses on Android XR to seed wider hardware diversity, while NVIDIA positions Omniverse as the neutral, GPU-accelerated backbone for industrial digital twins.
Qualcomm’s reference designs and Snapdragon chipsets give it leverage across multiple OEMs, from Samsung to PICO. Start-ups carve niches: Varjo sells pixel-dense headsets for aviation training; Magic Leap courts healthcare; and Augmodo targets retail analytics with computer-vision overlays. Patent filings in 2024-2025 surged 28% year-over-year, reflecting a scramble to own waveguides, foveated rendering, and dynamic distributed compute.
Strategic partnerships multiply. Qualcomm, Samsung, and Google co-develop XR silicon and software stacks. NVIDIA joins Siemens and SAP to sync Omniverse with industrial ERP. Rockwell Automation integrates Omniverse APIs into Emulate3D. These alliances pool R&D risk and accelerate enterprise traction, especially where customers expect single-throat-to-choke support.
Spatial Computing Industry Leaders
Meta Platforms Inc. (Reality Labs)
Microsoft Corporation
Google LLC (Alphabet Inc.)
Sony Group Corporation
HTC Corporation
- *Disclaimer: Major Players sorted in no particular order

Recent Industry Developments
- July 2025: PICO partnered with Blender to bring open-source 3D tools into enterprise XR pipelines .
- July 2025: CREAL secured USD 8.9 million to miniaturize light-field displays for thin AR glasses.
- July 2025: Augmodo raised USD 37.5 million to expand spatial commerce analytics for brick-and-mortar stores.
- June 2025: NVIDIA began building an industrial AI cloud in Germany with 10,000 GPUs to fuel Omniverse workloads.
- May 2025: HUMAIN and NVIDIA announced a 500-MW AI factory initiative in Saudi Arabia aligned with Vision 2030.
- March 2025: NVIDIA extended its Omniverse Physical AI OS through new Ansys, SAP, and Siemens hooks.


Global Spatial Computing Market Report Scope
| Hardware | Head-Mounted Displays (HMD) |
| Sensors and Cameras | |
| Haptic and Controller Devices | |
| Edge and AI Chipsets | |
| Software | Spatial SDK / Engines |
| XR Operating Systems | |
| Digital-Twin Platforms | |
| Services | System Integration and Consulting |
| Managed and Support Services |
| Augmented Reality |
| Virtual Reality |
| Mixed Reality |
| Artificial Intelligence |
| Digital Twins |
| Internet of Things |
| Computer Vision and SLAM |
| Cloud / Edge Rendering |
| Healthcare | Surgical Planning and Simulation |
| Remote Collaboration and Training | |
| Automotive | |
| Gaming and eSports | |
| Aerospace and Defense | |
| Energy and Utilities | |
| Consumer Electronics | |
| Retail and E-commerce | |
| Architecture / Construction (AEC) | |
| Government and Public Sector | |
| IT and Telecom |
| North America | United States |
| Canada | |
| Mexico | |
| Europe | Germany |
| United Kingdom | |
| France | |
| Russia | |
| Rest of Europe | |
| Asia-Pacific | China |
| Japan | |
| South Korea | |
| India | |
| Australia and New Zealand | |
| Rest of Asia-Pacific | |
| South America | Brazil |
| Argentina | |
| Rest of South America | |
| Middle East and Africa | Gulf Cooperation Council |
| Turkey | |
| South Africa | |
| Rest of Middle East and Africa |
| By Component | Hardware | Head-Mounted Displays (HMD) |
| Sensors and Cameras | ||
| Haptic and Controller Devices | ||
| Edge and AI Chipsets | ||
| Software | Spatial SDK / Engines | |
| XR Operating Systems | ||
| Digital-Twin Platforms | ||
| Services | System Integration and Consulting | |
| Managed and Support Services | ||
| By Technology | Augmented Reality | |
| Virtual Reality | ||
| Mixed Reality | ||
| Artificial Intelligence | ||
| Digital Twins | ||
| Internet of Things | ||
| Computer Vision and SLAM | ||
| Cloud / Edge Rendering | ||
| By End-User Vertical | Healthcare | Surgical Planning and Simulation |
| Remote Collaboration and Training | ||
| Automotive | ||
| Gaming and eSports | ||
| Aerospace and Defense | ||
| Energy and Utilities | ||
| Consumer Electronics | ||
| Retail and E-commerce | ||
| Architecture / Construction (AEC) | ||
| Government and Public Sector | ||
| IT and Telecom | ||
| By Geography | North America | United States |
| Canada | ||
| Mexico | ||
| Europe | Germany | |
| United Kingdom | ||
| France | ||
| Russia | ||
| Rest of Europe | ||
| Asia-Pacific | China | |
| Japan | ||
| South Korea | ||
| India | ||
| Australia and New Zealand | ||
| Rest of Asia-Pacific | ||
| South America | Brazil | |
| Argentina | ||
| Rest of South America | ||
| Middle East and Africa | Gulf Cooperation Council | |
| Turkey | ||
| South Africa | ||
| Rest of Middle East and Africa | ||


Key Questions Answered in the Report
How big is the spatial computing market today?
It generated USD 3.98 billion in 2025 and is forecast to top USD 23.45 billion by 2030, a 42.53% CAGR.
Which segment is growing fastest?
Services are expanding at a 44.02% CAGR as firms seek cloud rendering, integration, and managed solutions.
Which region shows the highest growth potential?
Asia-Pacific is projected to compound at 44.12% per year through 2030 on the back of 5G coverage and public investment.
What drives enterprise spending?
Digital-twin ROI, lower downtime and quicker iteration, plus the availability of edge nodes that meet latency targets.
What hampers adoption?
High upfront hardware costs and unresolved data-privacy standards remain the strongest brakes on scale deployments.
Who are the key players?
Meta, Microsoft, Apple, Google, NVIDIA, and Qualcomm dominate, while Varjo and Magic Leap hold specialist niches.
Page last updated on:


