Augmented Reality Market Size and Share
Market Overview
| Study Period | 2020 - 2031 |
|---|---|
| Market Size (2026) | USD 125.11 Billion |
| Market Size (2031) | USD 387.23 Billion |
| Growth Rate (2026 - 2031) | 25.35% CAGR |
| Fastest Growing Market | Asia Pacific |
| Largest Market | North America |
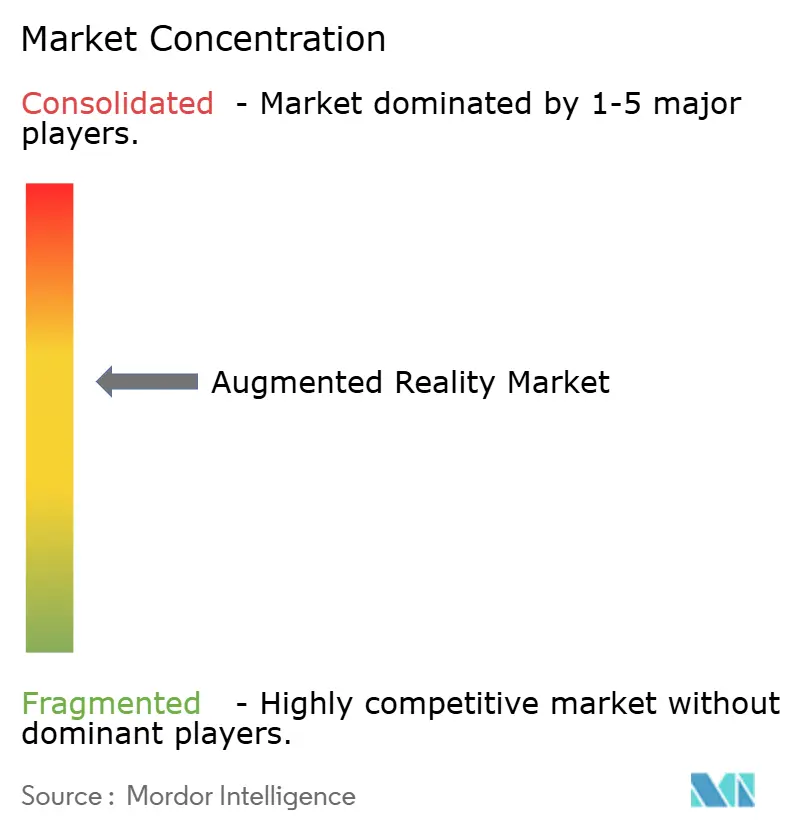
| Market Concentration | Medium |
Major Players *Disclaimer: Major Players sorted in no particular order Image © Mordor Intelligence. Reuse requires attribution under CC BY 4.0. | |
Augmented Reality Market Analysis by Mordor Intelligence
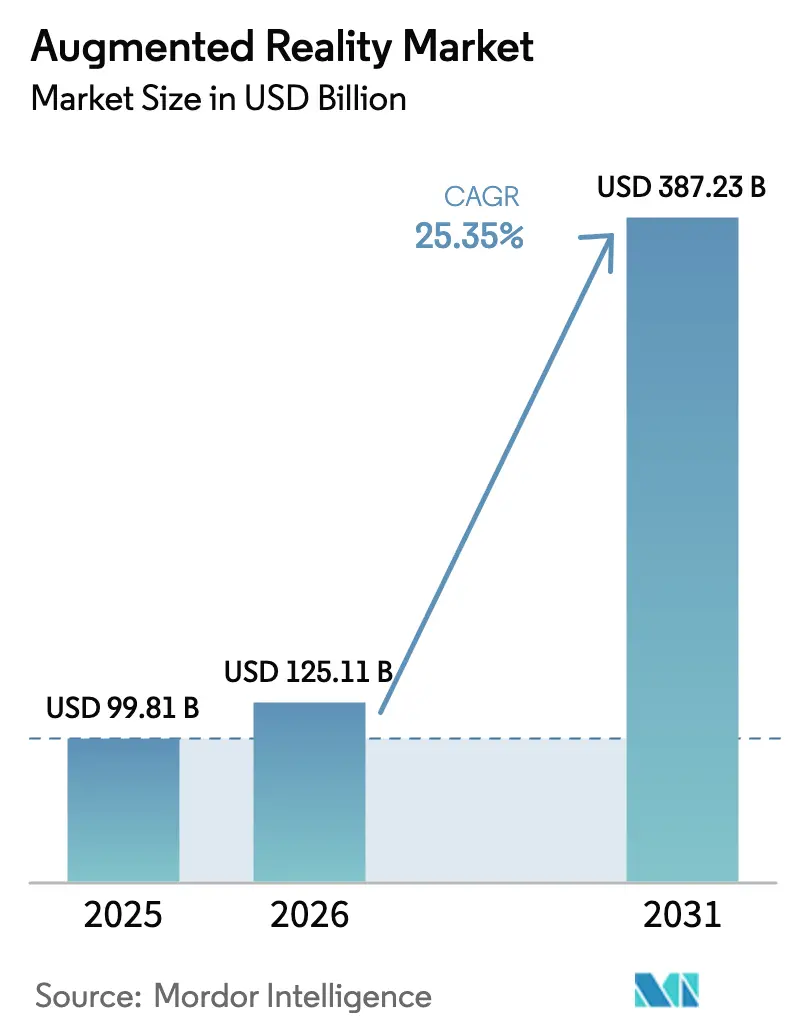
The Augmented Reality Market size is projected to expand from USD 99.81 billion in 2025 and USD 125.11 billion in 2026 to USD 387.23 billion by 2031, registering a CAGR of 25.35% between 2026 to 2031.Continued 5G roll-outs, maturing cloud-edge architectures, and a growing pipeline of enterprise proofs of concept moving into scaled production are sustaining double-digit growth. Rapid uptake of generative-AI authoring tools is lowering content-creation costs, broadening the developer base, and driving recurring revenue from software subscriptions. Apple’s tightly integrated Vision Pro hardware-software stack has validated premium spatial-computing experiences, while Meta’s aggressive hardware subsidies are enlarging the installed base at the value end, together amplifying competitive intensity. On the industrial side, measurable efficiency gains in training, field service, and remote assistance are convincing manufacturers, utilities, and defense agencies to green-light multi-year roll-outs, giving the technology a durable enterprise foothold.
Key Report Takeaways
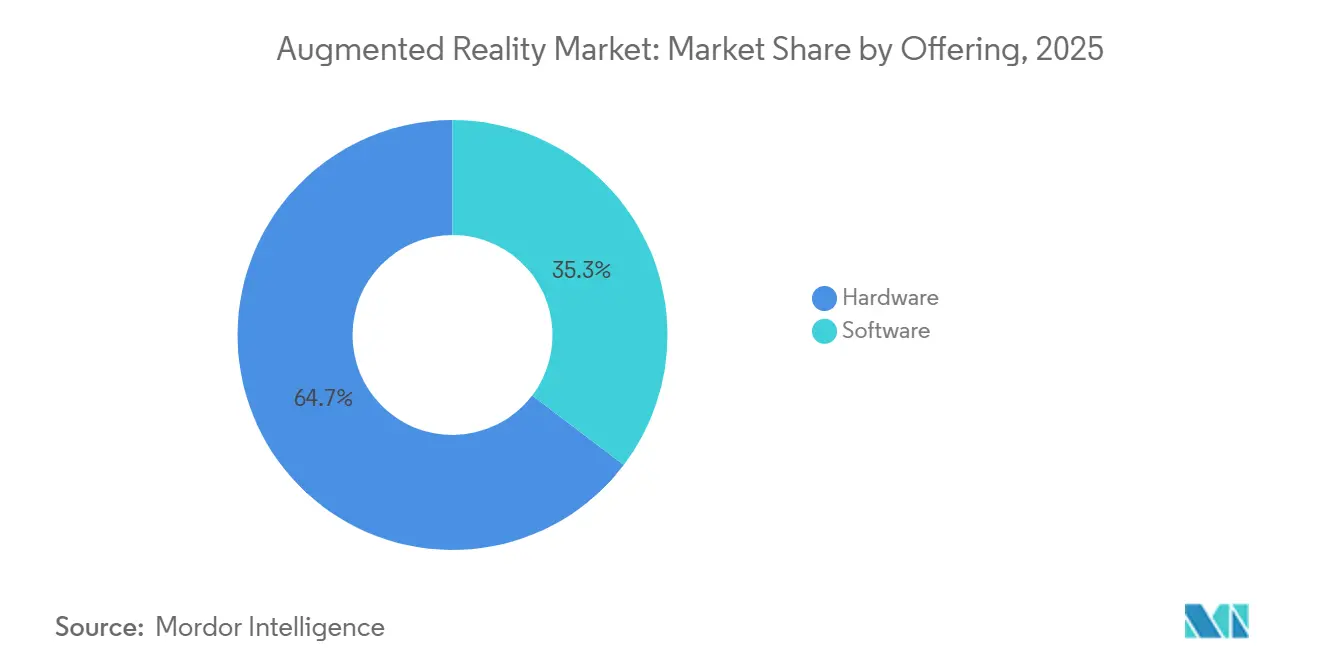
- By offering, hardware commanded 64.66% revenue share in 2025, but software is forecast to expand at a 28.76% CAGR through 2031, indicating that platform monetization will eclipse device margins as penetration deepens.
- By core technology, OLED and micro-OLED displays led with 48.25% share in 2025, while microLED is positioned to advance at 27.52% CAGR through 2031 as suppliers work through yield challenges.
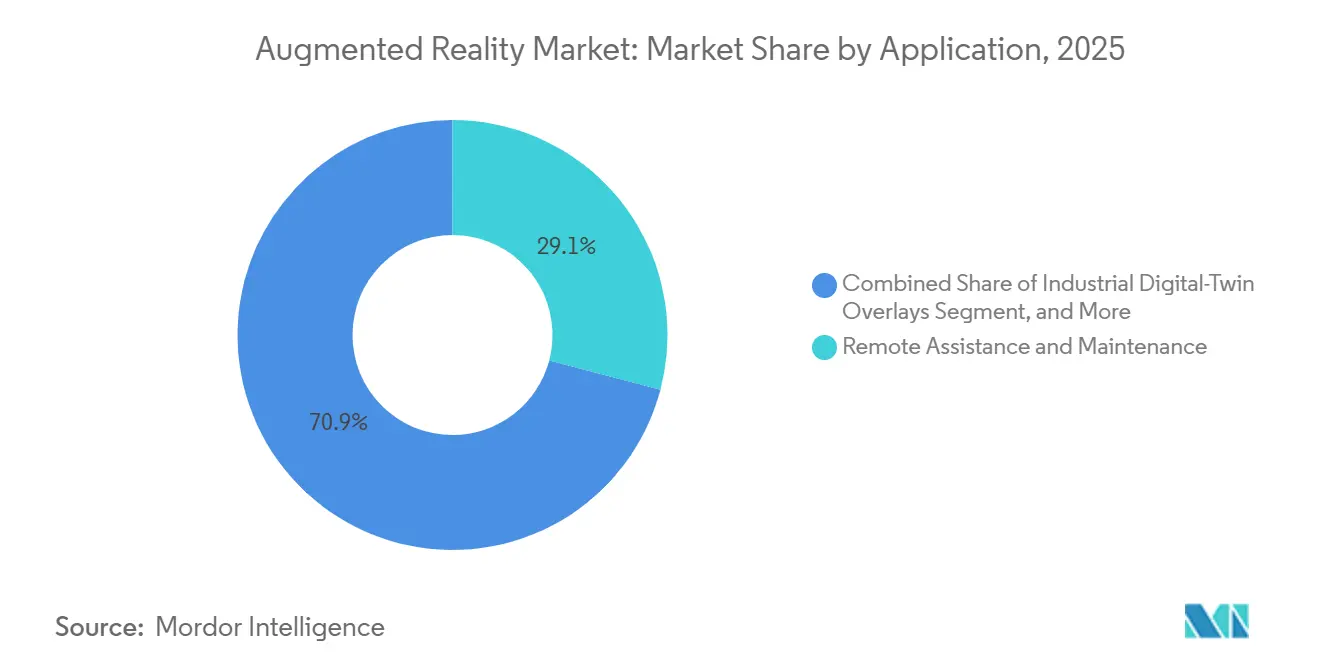
- By application, remote assistance and maintenance accounted for 29.09% of the augmented reality (AR) market size in 2025 and remained the largest individual application by revenue. Industrial digital-twin overlays are projected to grow at 26.12% CAGR, the fastest among tracked applications, as manufacturers integrate real-time IoT data into production workflows.
- By end-user vertical, gaming and entertainment held 36.26% share of the AR market in 2025, whereas healthcare is forecast to expand at 26.76% CAGR on the back of surgical-training and diagnostic approvals.
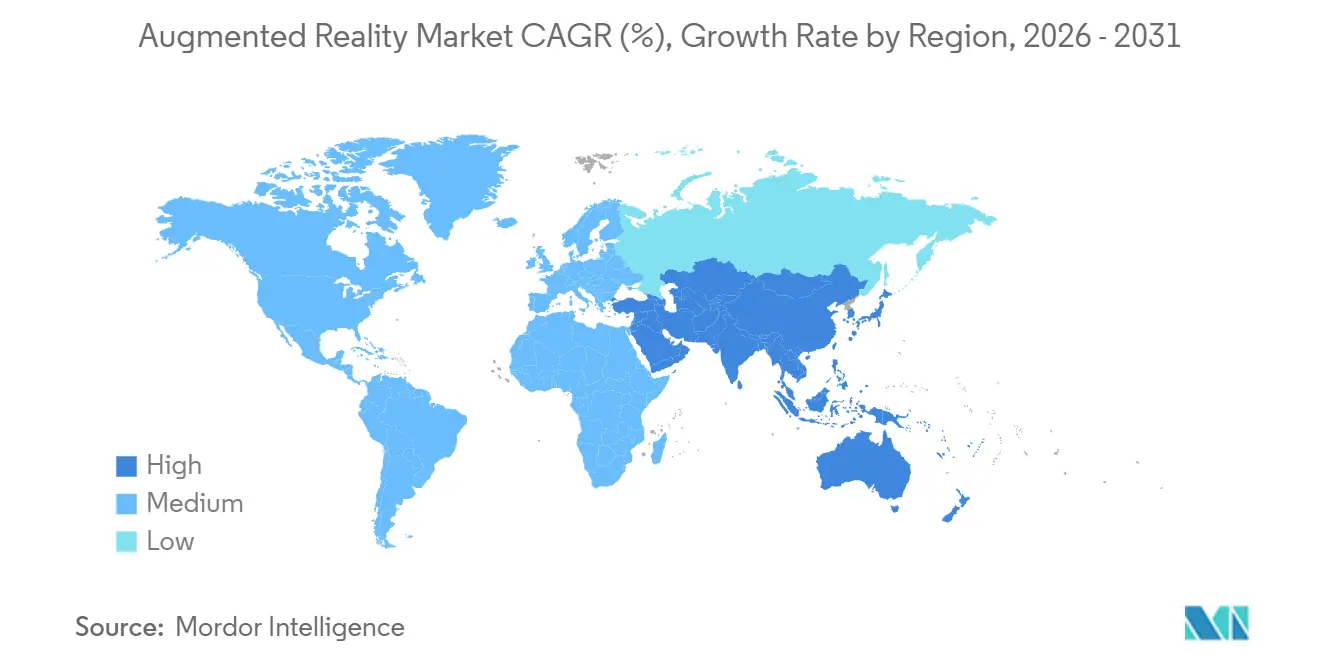
- By geography, North America represented 44.42% of 2025 revenue, maintaining regional leadership, while Asia Pacific is forecast to grow at 25.94% CAGR through 2031, the fastest among all geographies.
Note: Market size and forecast figures in this report are generated using Mordor Intelligence’s proprietary estimation framework, updated with the latest available data and insights as of January 2026.
Global Augmented Reality Market Trends and Insights
Drivers Impact Analysis*
| Driver | (~) % Impact on CAGR Forecast | Geographic Relevance | Impact Timeline |
|---|---|---|---|
| 5G-Enabled Low-Latency Mobile Networks | +4.2% | Global, with early density in South Korea, United States, China | Medium term (2-4 years) |
| Rising Smartphone Penetration and AR-Ready Apps | +3.8% | Asia Pacific core, spill-over to Middle East and Africa | Short term (≤ 2 years) |
| Enterprise Training and Field-Service Efficiency Gains | +5.1% | North America and Europe, expanding to Asia Pacific manufacturing hubs | Medium term (2-4 years) |
| Generative-AI Tools for Rapid AR Content Creation | +4.5% | Global, concentrated in North America and Europe developer communities | Short term (≤ 2 years) |
| Industrial Digital-Twin Overlays for Real-Time IoT Data | +3.9% | Europe and Asia Pacific industrial corridors, North America automotive | Long term (≥ 4 years) |
| Apple Vision Pro-Led Spatial-Computing Ecosystem Push | +4.0% | North America and Europe premium segments, gradual Asia Pacific adoption | Medium term (2-4 years) |
| Source: Mordor Intelligence | |||
5G-Enabled Low-Latency Mobile Networks
Standalone 5G cores are now delivering round-trip latency under 10 milliseconds, enabling cloud-rendered overlays that move compute off constrained headsets to edge servers.[1]T-Mobile, “T-Mobile Expands 5G Coverage to 330 Million Americans,” t-mobile.com Chipset makers have embedded dedicated AI engines alongside 5G modems, meaning real-time object recognition can continue even when connectivity drops. 3GPP Release 18 adds XR-specific quality-of-service classes that network operators are trialing to guarantee frame-rate stability during peak congestion.[2]Ericsson, “Ericsson Mobility Report,” ericsson.com Urban coverage remains uneven, yet factories, ports, and warehouses are bypassing the public grid with private 5G networks, ensuring deterministic performance for industrial digital twins. As coverage gaps close, outdoor AR navigation, tourism overlays, and large-venue entertainment are expected to see a usage inflection in the augmented reality market.
Enterprise Training and Field-Service Efficiency Gains
Enterprises deploying head-mounted displays have documented return-on-investment profiles that shorten payback periods to fewer than 24 months. Independent studies show remote-expert guidance can cut technician travel by 40%, while immersive workflows reduce assembly defects by double-digit percentages. Aerospace, automotive, and heavy-equipment manufacturers report 20%–30% shorter production cycles once AR work instructions replace paper manuals. Beyond the factory floor, frontline service organizations using hands-free overlays note technician reversion rates below 5%, indicating sticky behavioral change. As macro uncertainty pushes cost-optimization agendas, the documented savings from AR deployments are expected to accelerate procurement decisions in the augmented reality market.
Generative-AI Tools for Rapid AR Content Creation
Large multimodal models embedded in authoring suites are cutting 3D-asset development time by more than 50%, democratizing creation beyond specialized artists. Platform holders are rolling out text-to-filter functionality that has already increased the volume of published effects by a third, sustaining engagement on social media channels. Retailers gain the ability to generate personalized try-ons in real time, while enterprises can spin up digital twins that adapt to in-field sensor data without manual modeling. Quality-control review loops remain necessary, yet the cost curve is bending downward, feeding a virtuous cycle of content availability and user adoption in the augmented reality market.
Apple Vision Pro-Led Spatial-Computing Ecosystem Push
Vision Pro’s launch established a performance benchmark, 4K-per-eye resolution and sub-12 millisecond eye-tracking latency that is reshaping consumer expectations.[3]Apple Inc., “VisionOS 2 Brings New Spatial-Computing Experiences,” apple.com Within 18 months, more than 2,500 visionOS titles covered productivity, design, and collaboration, signaling developer commitment to a closed, premium ecosystem. Large retailers piloting spatial configuration tools reported conversion lifts above 20%, validating mixed-reality’s commercial upside. Price remains a barrier for mass consumers, yet Apple’s historical product glide path suggests lower-cost variants that will expand the addressable base by the end of the forecast horizon in the AR market.
Restraints Impact Analysis*
| Restraint | (~) % Impact on CAGR Forecast | Geographic Relevance | Impact Timeline |
|---|---|---|---|
| Battery-Life and Ergonomics of Head-Mounted Displays | -2.8% | Global, acute in consumer segments | Short term (≤ 2 years) |
| Privacy and Data-Security Concerns | -2.1% | Europe under GDPR, North America enterprise, China data-localization mandates | Medium term (2-4 years) |
| Optical-Waveguide Glass Supply Bottlenecks | -1.9% | Global, supply concentrated in United States and Japan | Medium term (2-4 years) |
| Fragmented Developer Standards and Cross-Platform Issues | -1.6% | Global, most acute in multi-platform enterprise deployments | Long term (≥ 4 years) |
| Source: Mordor Intelligence | |||
Battery-Life and Ergonomics of Head-Mounted Displays
Most commercial headsets offer under 2.5 hours of continuous operation, well below the four-hour threshold required for all-day workflows. Device masses still hover around 500–600 grams, generating neck fatigue within an hour for many users, which curtails session length in gaming and prolonged industrial scenarios. Brighter, higher-resolution optics boost immersion but drain batteries faster, while adding battery capacity exacerbates weight. Solid-state prototypes promise 50% energy-density gains but are unlikely to ship in volume before 2028. Until then, for the augmented reality market, ergonomic limits will restrain consumer uptake and compel enterprises to limit headset usage to discrete tasks rather than entire shifts.
Privacy and Data-Security Concerns
Biometric tracking eye, hand, and face data sits at the heart of immersive UX, yet falls under sensitive-data provisions in GDPR Article 9. European deployments often require on-premise or edge processing to avoid cloud transfer, increasing cost and integration complexity. North American enterprises cite liability concerns around recording bystanders in shared workspaces, delaying roll-outs in regulated industries. In China, data-localization mandates push suppliers toward on-device inference, limiting use of global cloud-XR services. Vendors that can guarantee encryption, local processing, and auditable data flows will enjoy a procurement edge, yet compliance overhead will still temper expansion in privacy-sensitive segments in the AR market.
*Our forecasts treat driver/restraint impacts as directional, not additive. The impact forecasts reflect baseline growth, mix effects, and variable interactions.
Segment Analysis
By Offering: Platform Revenue Overtakes Hardware Margins
The software tier generated the fastest revenue expansion in 2025, tracking a 28.76% CAGR projection through 2031 as subscriptions, in-app purchases, and cloud-rendering services outstrip one-off headset margins. Within hardware, standalone and tethered head-mounted displays plus screenless mobile viewers maintained 64.66% of 2025 spending, yet gross margins narrowed when value-tier devices such as Meta Quest were sold near cost to enlarge the installed base. Unity’s development framework underpins roughly two-thirds of mobile and headset AR releases, anchoring recurring license spreads as the cohort of professional creators mushrooms. Unreal Engine continues to gain traction in photorealistic visualization, while enterprise buyers gravitate to low-code toolkits that integrate with existing asset-management systems. The software opportunity scales with every incremental user, positioning platform operators to capture expanding lifetime value even as bill-of-materials costs decline. Meanwhile, hardware roadmaps focus on lighter form factors and energy-efficient chipsets, but commoditization is inevitable, steering profit pools decisively toward software and services in the augmented reality market.
Asset pipelines that once demanded specialized designers can now auto-generate textures, lighting, and animations on demand. This shift tilts total cost of ownership toward usage-based pricing. As regulatory and insurance frameworks solidify, sectors such as healthcare and defense are expected to commit to multi-year platform subscriptions, reinforcing the virtuous flywheel for software vendors. Consequently, hardware OEMs are already experimenting with revenue-sharing models tied to app-store take rates, underscoring the gradual inversion of value from physical units to digital channels in the AR market.


By Core Technology: MicroLED Gains Traction Despite Manufacturing Hurdles
OLED and Micro-OLED displays combined for 48.25% revenue share of the augmented reality market in 2025 owing to mature supply chains and competitive pricing, yet inherent luminance decay and limited peak brightness constrain multiyear durability. MicroLED prototypes showcased by leading display vendors deliver superior contrast, reduced motion blur, and energy efficiency that could elongate session lengths without sacrificing form factor. Current mass-transfer processes, however, report yield losses that inflate costs, keeping MicroLED production largely in the pilot phase. Investment announcements by top smartphone assemblers and display fabs indicate the technology will cross commercial viability between 2027 and 2029, after which category incumbents will accelerate a migration to longer-life panels.
Waveguide combiners remain another chokepoint, with leading suppliers experiencing sub-60% yields due to nanoscale tolerance demands. Glass-based waveguides dominate high-end systems, while polymer variants are progressing in color uniformity and may unlock cost-effective alternatives for consumer eyewear. Liquid-Crystal-on-Silicon retains niche relevance in defense applications requiring ultra-high resolution under low-light conditions. The transition toward MicroLED ultimately depends on coordinated advances in display backplanes, transfer equipment, and waveguide materials. Nonetheless, once solved, the resulting performance uplift is expected to catalyze a new product cycle favoring lighter, all-day wearable formats in the AR market.
By Application: Industrial Digital Twins Emerge as Growth Leader
Remote assistance and maintenance preserved the highest individual revenue share at 29.09% during 2025, confirming its foundational role in early enterprise adoption. Yet industrial digital-twin overlays are forecast to outpace all other application clusters with a 26.12% CAGR through 2031 in the augmented reality market. Manufacturers now pair plant-level IoT telemetry with 3D spatial context, allowing engineers to visualize stress points, thermal gradients, and predictive alerts directly on machinery. Major energy and automotive groups have reported downtime reductions in the high single-digit percentage range after overlaying live sensor data on physical assets, validating a clear payback narrative.
Product visualization and configuration continue to raise conversion rates in home goods, apparel, and automotive retail by providing high-fidelity previews within natural environments. Navigation and mapping solutions are maturing as 5G densifies, delivering lane-level instructions layered onto streetscapes, while social filters sustain daily usage at scale although monetization per active user remains modest. Education and healthcare are expanding into high-risk training and pre-operative planning, taking advantage of simulation and 3D anatomy overlays. Overall, industrial twins benefit from edge-compute architectures capable of sub-50-millisecond refresh rates, ensuring that overlays remain actionable rather than static visual aids.

By End-User Vertical: Healthcare Surges on Surgical Training and FDA Approvals
The gaming and entertainment cohort maintained 36.26% of 2025 revenues, fuelled by blockbuster titles and billions of daily social-filter interactions. Healthcare, however, is poised for the fastest trajectory at 26.76% CAGR as regulatory clearances unlock reimbursable diagnostic and operative workflows in the augmented reality market. Multiple neurosurgical navigation systems now provide tumor boundary overlays, supported by peer-reviewed studies demonstrating reduced operative time and radiation exposure. Universities are integrating AR simulation modules into resident programs, producing measurable proficiency gains against traditional training.
Education, retail, and automotive follow as growth contributors. Educators simulate hazardous environments such as welding or confined‐space rescue without physical risk, while retailers leverage try-on utilities to reduce product returns. Automotive OEMs embed HUD-grade augmented reality into windshields, projecting navigation cues and driver-assist alerts that lower cognitive load. Defense uses continue in the AR market, yet procurement cycles and ergonomic constraints slow large-scale fielding timelines.
Geography Analysis
North America generated 44.42% of 2025 revenues in the augmented reality market, underpinned by high 5G penetration across metro areas, a concentration of platform incumbents, and deep venture-capital ecosystems that bankrolled over USD 2 billion in start-ups across 2024-2025. Enterprise deployments at aerospace, logistics, and defense organizations continue to scale, though year-on-year headset unit growth has moderated as early adopters shift from initial roll-outs to optimization phases. Canada’s Toronto tech cluster is gaining visibility in healthcare-related applications, whereas Mexico’s automotive corridor is embracing AR for assembly training and quality inspection.
Asia Pacific is projected to post the fastest regional expansion at 25.94% CAGR through 2031 in the AR market. China’s industrial policy targets 100 million AR-capable devices by 2030, pairing data-localization rules with incentives for domestic OEMs to incorporate on-device AI inference. India’s consumer engagement leans heavily on smartphone-based AR, counting hundreds of millions of monthly filter users thanks to affordable 5G data plans and vernacular content libraries. Japan’s robotics-intensive manufacturing sector is integrating hands-free visualization to offset skilled-labor shortages, while South Korea serves as a proving ground for high-fidelity gaming experiences layered onto dense urban landscapes. Australia is piloting AR across remote mining operations and large-scale construction. Regulatory fragmentation and uneven purchasing power nonetheless temper absolute dollar growth relative to North America.
Europe’s progress is methodical due to GDPR’s stringent biometric-data rules, yet the same framework is catalyzing privacy-preserving enterprise deployments that avoid public-cloud dependencies. Germany, the United Kingdom, and France lead in automotive and aerospace use cases, deploying AR to cut assembly errors and shorten training windows. Italy and Spain harness the technology in tourism and cultural-heritage installations, elevating visitor engagement. EU-level AI legislation will require transparent disclosure of AI-generated AR content, which could raise compliance costs but also build baseline consumer trust. In the Middle East and Africa, pilots remain concentrated in smart-city initiatives such as NEOM and in education and retail showcases within major urban centers. South America is experimenting with e-commerce visualization tools, although macroeconomic variability and import tariffs introduce headwinds.

Regulatory Landscape
Augmented reality deployments are increasingly shaped by a mix of device safety, biometric privacy, and AI-content transparency requirements that differ by region. In the European Union, the EU AI Act (Regulation (EU) 2024/1689) adds transparency obligations under Article 50 for certain AI systems, including requirements to mark AI-generated or manipulated content with robust, interoperable, machine-readable disclosure mechanisms, which can affect AR experiences that incorporate generative AI outputs.
Compliance requirements are also tightening in key growth markets. In India, the Bureau of Indian Standards issued implementation guidance for mandatory migration to IS/IEC 62368-1:2023 for XR products, with an effective date of 01 May 2026, creating a time-bound certification and labeling pathway for vendors shipping AR/VR/MR devices. For safety guidance, ISO/IEC 5927:2024 provides internationally recognized recommendations covering safe immersion and visual-stimulus risks, while the US FDA maintains a dedicated framework and resources for AR/VR medical devices authorized for marketing, shaping adoption in regulated healthcare workflows.
Value Chain Analysis
The augmented reality value chain runs from semiconductor platforms, including application processors, connectivity, and on-device AI, through microdisplays, waveguides and combiners, sensing modules, and headset or eyewear assembly, before moving to downstream software platforms and content distribution. Qualcomm anchors many reference designs and developer ecosystems at the silicon layer, while microdisplay and optics suppliers can drive performance and unit economics because their processes remain yield-sensitive. A notable manufacturing shift is the move of AR optics and microdisplay components toward semiconductor-grade workflows: Goertek commenced operations at a dedicated 12-inch AR micro-nano optical wafer facility in Shanghai (Lingang) in June 2026 to support products such as waveguides and microlens arrays, underscoring how capacity and yields at wafer-scale fabs can affect device availability and pricing.
On the software side, monetization depends on engines and toolchains, AR operating systems, cloud-edge rendering, and enterprise workflow integration, with distribution increasingly tied to platform app stores and subscriptions. Interoperability is also becoming a clearer layer of the value chain: ETSI ISG ARF is defining a modular functional reference architecture to reduce fragmentation, and the AR Alliance (now a division of SPIE) has expanded membership to include companies such as Vuzix and Magic Leap, pointing to coordinated supplier and ecosystem alignment around optics and photonics supply-chain standards and integration practices.
Competitive Landscape
Competition is intensifying as vertically integrated platforms seek to lock in developers and end users through proprietary operating systems, chipsets, and app stores. Meta pursues a land-grab strategy by subsidizing Quest hardware and recouping value in software, advertising, and in-app purchases. Apple, conversely, layers premium pricing atop tightly controlled hardware-software integration, creating durable switching costs reminiscent of its mobile playbook. Microsoft maintains a stronghold in enterprise collaboration and defense, while Google is re-entering the device tier via a partnership with Samsung that aims to introduce an Android-based XR stack by 2026.
Component suppliers wield disproportionate influence because of bottlenecks in waveguide glass and advanced displays. Corning’s limited yield rates effectively cap headset production volumes, placing smaller OEMs like Magic Leap and Vuzix at a negotiating disadvantage. Qualcomm anchors many headset reference designs with Snapdragon Spaces, integrating AI cores that move inference on-device to cut latency. Unity and Unreal contest developer mindshare with cross-platform APIs that mitigate porting friction.
PTC acquired Augmentir to fold connected-worker analytics into its Vuforia suite, while Niantic raised substantial capital to scale its Lightship AR developer kit. Emerging standards from the Khronos Group and ISO aim to reduce fragmentation, yet platform vendors have limited incentive to surrender proprietary moats. Looking ahead, sustained differentiation will hinge on AI integration, battery efficiency breakthroughs, and the ability to navigate tightening data-governance regimes.
Augmented Reality Industry Leaders
Microsoft Corporation
Meta Platforms Inc.
Apple Inc.
Qualcomm Technologies Inc.
Google LLC (Alphabet)
- *Disclaimer: Major Players sorted in no particular order

Market Opportunities and Future Outlook
One opportunity is the shift from premium headsets toward more scalable, AI-enabled AR eyewear, supported by developer infrastructure. In June 2026, Snap introduced Specs augmented reality glasses alongside agentic development tooling and low-latency performance claims, and NVIDIA released an NVIDIA XR AI public beta to help developers build multimodal AI agents on AR glasses. Together, these announcements reinforce movement toward AI-native AR experiences and new monetization paths such as tooling, subscriptions, and enterprise agents.
Standardization work is also supporting ecosystem expansion. In February 2026, ETSI ISG ARF published updated guidance on the virtual-world standards landscape, and industry advocacy in 2026 (for example, XR Association policy recommendations) emphasizes coordinated federal and international standards participation, which targets cross-platform deployment friction for enterprise buyers. A second opportunity is reducing risk around hardware supply constraints through optics industrialization and manufacturing partnerships. Goertek shifting AR waveguide and micro-nano optics production onto a 12-inch wafer platform, with commercial production commencing in July 2026 at Lingang, is a direct signal of scaling capacity for bottleneck components. In June 2026, EssilorLuxottica finalizing a long-term AR display development and manufacturing arrangement with Applied Materials reflects deeper vertical collaboration between eyewear leaders and semiconductor equipment ecosystems. These moves create whitespace for component suppliers, assemblers, and software platforms that can package compliant, interoperable solutions, particularly when privacy and AI transparency requirements call for local processing, auditable data flows, and content marking capabilities.
Recent Industry Developments
- June 2026: Goertek commenced operations at a dedicated 12-inch AR micro-nano optics wafer facility in Shanghai Lingang to support waveguides and microlens arrays. This expansion signals scaling capacity for core optical components and could influence device availability and pricing.
- June 2026: EssilorLuxottica finalized a long-term AR display development and manufacturing arrangement with Applied Materials. The collaboration strengthens integration between eyewear brands and semiconductor equipment ecosystems and advances manufacturing capability for AR displays. The deal signals deeper vertical collaboration in AR display supply chains.
- June 2024: The EU approved the AI Act (Regulation (EU) 2024/1689), establishing transparency obligations for AI-generated or manipulated content in AR experiences across Europe. This creates a regulatory anchor that informs AR platform governance and content marking practices within EU member states.


Research Methodology Framework and Report Scope
Market Definition and Coverage
This market is sized as the total revenue generated from augmented reality solutions that overlay digital content onto real-world views. The scope includes AR hardware and AR software sold for consumer and enterprise use across major regions.
Scope exclusions: We exclude pure virtual reality systems and any mixed reality products that are sold and reported only as MR without a clear AR revenue split.
Segmentation Overview
- By Offering
- Hardware
- Stand-Alone HMDs
- Tethered HMDs
- Screenless Viewers
- Software
- Hardware
- By Core Technology
- OLED / Micro-OLED
- MicroLED
- Waveguide and Diffractive Optics
- Liquid-Crystal-on-Silicon (LCOS)
- By Application
- Remote Assistance and Maintenance
- Product Visualisation and Configuration
- Navigation and Mapping
- Social and Communication Filters
- Other Applications
- By End-User Vertical
- Gaming and Entertainment
- Education
- Healthcare
- Retail
- Automotive and Transportation
- Other End-User Verticals
- By Geography
- North America
- United States
- Canada
- Mexico
- Europe
- Germany
- United Kingdom
- France
- Italy
- Spain
- Rest of Europe
- Asia Pacific
- China
- Japan
- India
- South Korea
- Australia
- Rest of Asia Pacific
- South America
- Brazil
- Argentina
- Rest of South America
- Middle East
- Saudi Arabia
- United Arab Emirates
- Turkey
- Rest of Middle East
- Africa
- South Africa
- Egypt
- Nigeria
- Rest of Africa
- North America
Data Sources, Market Sizing, and Validation
Desk Research
Desk research was used to set the foundation for the model and keep assumptions grounded in what is observable across the AR ecosystem. We reviewed public sources such as the International Telecommunication Union for connectivity indicators, the World Bank for macro and income trends, the United States Patent and Trademark Office for innovation signals, and the National Institute of Standards and Technology for relevant technical references.
To translate technology activity into market value, we also relied on company filings, investor presentations, earnings call transcripts, and reputable press releases that describe product launches, pricing direction, and partner ecosystems. When needed, we used paid subscription data for company financials and patent intelligence to cross-check reported revenue lines, acquisition notes, and portfolio shifts. These examples are not exhaustive, and we referenced other public sources as well for data collection, validation, and research clarification.
Primary Interviews and Surveys
Primary work focused on interviews and structured surveys with AR device and software stakeholders, channel partners, and large enterprise buyers, so adoption timing and price points could be checked against real procurement behavior. Inputs were collected across APAC, EMEA, and the Americas to cover differences in device availability, enterprise digitization pace, and use-case maturity, and then used to confirm desk assumptions and close gaps where public reporting is limited.
Distribution of primary research fieldwork respondents
| Company type | Respondent position | Region |
|---|---|---|
| Top tier: 27% | CXOs: 16% | APAC: 47% |
| Mid tier: 51% | Functional/Unit leaders: 29% | EMEA: 31% |
| Smaller Players: 22% | Managers: 55% | Americas: 22% |
Market-Sizing & Forecasting
The core build uses a top-down approach where the addressable demand pool is reconstructed from device shipment direction, installed base replacement cycles, and enterprise rollout patterns for AR-supported workflows. We then corroborate totals through selective bottom-up checks such as sampled average selling price by device class, software spend per active deployment, and channel feedback on discounting to adjust for overstatement risk in early-stage adoption.
Key inputs that shape the model include smart device penetration and 5G readiness, AR headset and smart-glass shipment momentum, enterprise training and remote assistance adoption rates, content creation tool uptake, and the typical hardware versus software spend mix. When data is missing at a country or vertical level, we bridge the gap using proxy indicators such as sector employment mix and IT spending direction, then confirm with primary inputs whether the proxy holds.
Forecasts are developed using scenario analysis supported by trend smoothing, with each scenario tied to practical drivers such as hardware price decline speed, supply availability, and the pace of enterprise proof-of-concept conversion into scaled deployments. Assumptions are reviewed with experts so the forward curve reflects what buyers are budgeting for, not only what technology roadmaps claim.
Data Validation & Update Cycle
Validation is done through triangulation across independent signals, followed by variance checks at the region and offering levels so one outsized assumption does not distort the total. We also run anomaly reviews, such as revenue per device checks and growth step-change tests, and any mismatch triggers a re-check of sources and a re-contact with relevant interviewees.
Before sign-off, the model goes through multi-step analyst review where drivers, unit economics, and key conversions are challenged and reconciled back to the final market value. The report is refreshed annually, with interim updates when major product launches, policy changes, or macro events materially shift adoption or pricing, and a final pre-delivery pass is completed so the delivered view reflects the latest signals.
Mordor Intelligence's Augmented Reality Market Size Measured Against Other Published Estimates
Published AR market sizes can differ even when they appear to cover the same category, mainly because the boundary between AR, MR, and adjacent software stacks is not handled consistently across studies. Variations also come from how quickly pricing is assumed to fall, which use cases are counted as revenue-generating versus pilots, and what year currency conversion and inflation assumptions are anchored to.
By tracking device shipment signals, enterprise rollout conversion rates, and pricing curves, Mordor Intelligence keeps the AR total tied to counted hardware and software revenue streams, rather than bundling broader immersive spending that cannot be cleanly isolated. In contrast, some estimates expand the scope by folding MR-heavy product lines into AR, or they assume a faster move from consumer engagement to paid enterprise scale, which lifts the near-term base year value.
Benchmark comparison
| Source | Market Size | Gaps in Research Methodology |
|---|---|---|
| Mordor Intelligence | USD 99.81 B (2025) | |
| Global Consultancy A | USD 120.21 B (2025) | A broader scope is implied by its component and application framing, which can pull in adjacent immersive categories and apply higher early adoption weights across regions, raising the 2025 base. |
| Industry Publisher B | USD 140.34 B (2025) | The 2025 value is higher partly because the demand curve appears to assume faster enterprise scale-up and a more aggressive pricing and penetration progression over the near term, which expands the counted revenue pool. |
The spread across the three numbers is mainly explained by scope boundaries and the speed of assumed adoption into paid deployments, which then changes how much revenue is counted in the base year. When the model is anchored to observable shipments, enterprise conversion, and realistic price paths, the resulting market size stays easier to trace, explain, and refresh when new signals arrive.


Key Questions Answered in the Report
How fast is the augmented reality market growing through 2031?
The augmented reality market is forecast to rise from USD 125.11 billion in 2026 to USD 387.23 billion by 2031, delivering a 25.35% CAGR over the period.
Which region will post the highest growth rate during the forecast?
Asia Pacific is projected to record a 25.94% CAGR, propelled by China’s policy targets, India’s mobile adoption, and Japan’s industrial automation investments.
What segment is expanding faster than hardware revenues?
Software and platform services, including subscriptions and cloud rendering, are projected to outpace devices, with a 28.76% CAGR through 2031.
Why are MicroLED displays considered the next major technology shift?
MicroLED offers higher brightness, better power efficiency, and longer lifespan than OLED, though manufacturing yields must improve for mass adoption anticipated after 2027.
What is the biggest restraint holding back consumer adoption?
Limited battery life and headset ergonomics currently cap continuous usage to under 3 hours, restricting all-day productivity and extended gaming sessions.
Which end-user vertical will see the fastest growth?
Healthcare leads with a 26.76% CAGR, driven by FDA-cleared diagnostic overlays and accelerated surgical-training modules.
Page last updated on:


