
Smart Spaces Market Size and Share
Market Overview
| Study Period | 2020 - 2031 |
|---|---|
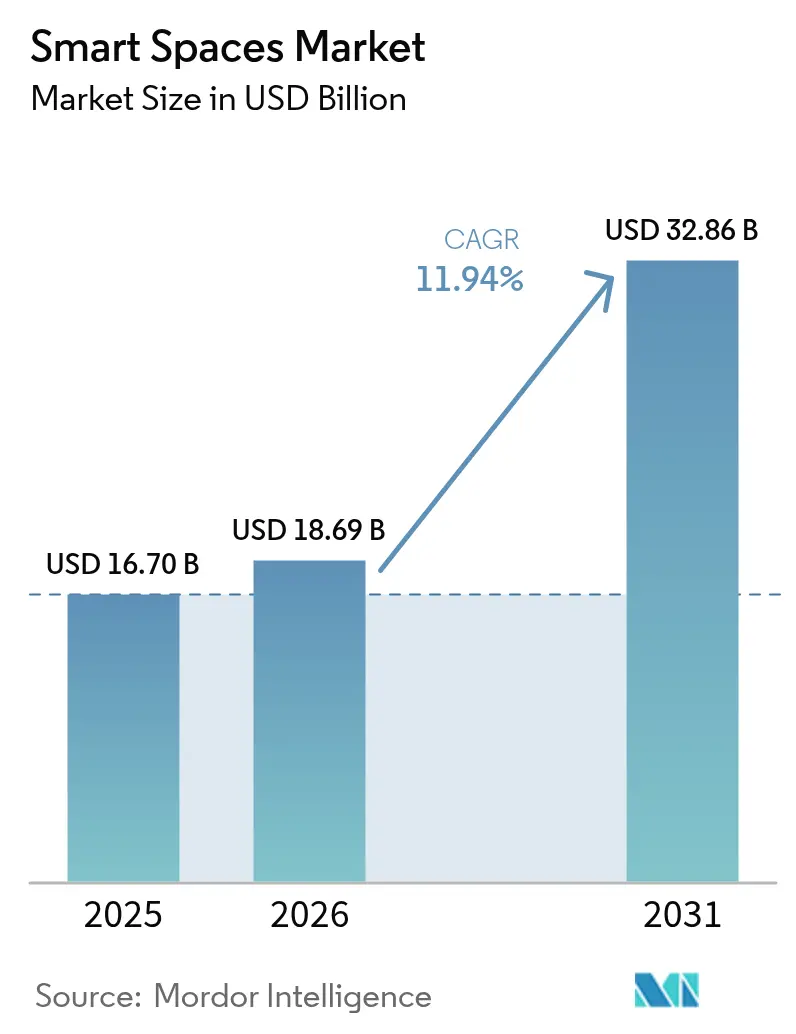
| Market Size (2026) | USD 18.69 Billion |
| Market Size (2031) | USD 32.86 Billion |
| Growth Rate (2026 - 2031) | 11.94 % |
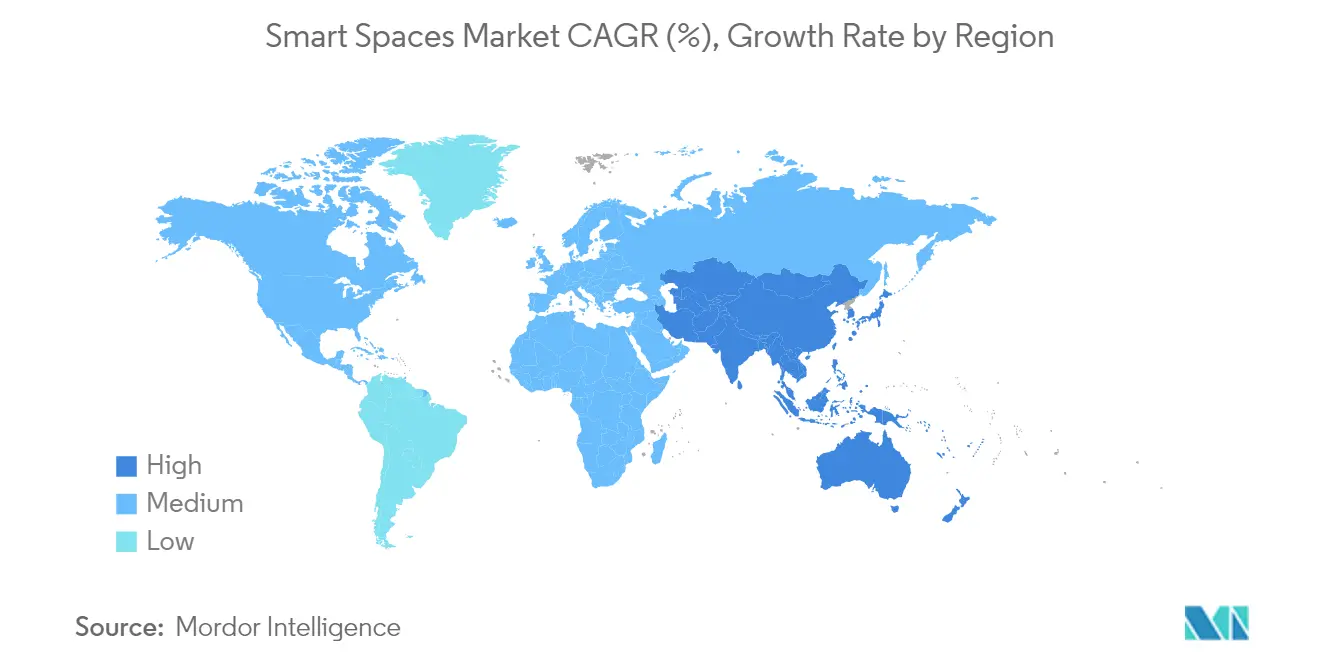
| Fastest Growing Market | Asia Pacific |
| Largest Market | North America |
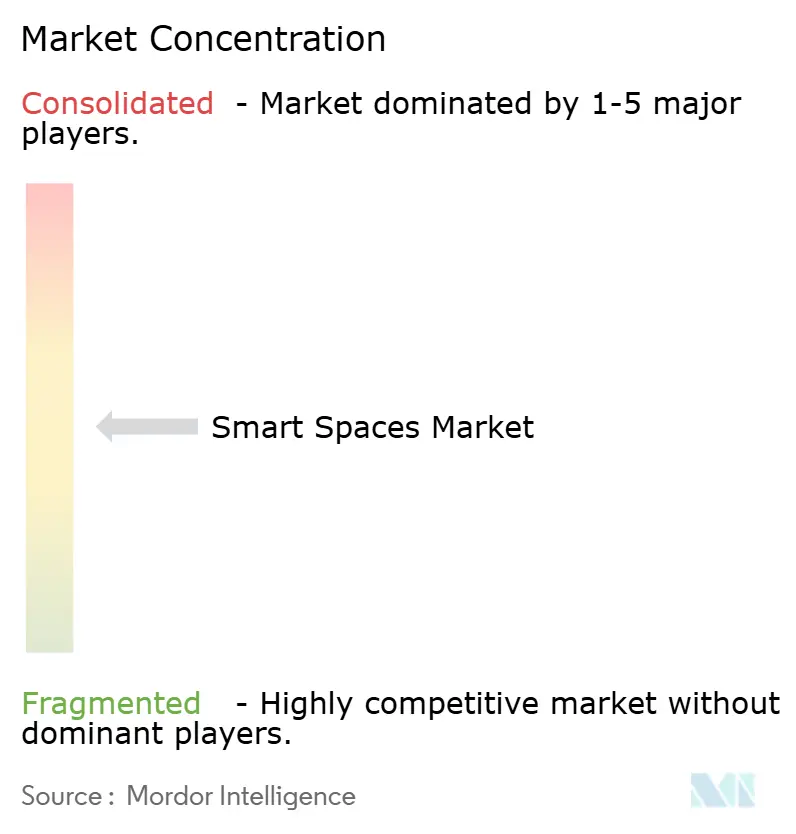
| Market Concentration | Medium |
Major Players *Disclaimer: Major Players sorted in no particular order Image © Mordor Intelligence. Reuse requires attribution under CC BY 4.0. | |
Smart Spaces Market Analysis by Mordor Intelligence
The Smart spaces market size is expected to grow from USD 16.70 billion in 2025 to USD 18.69 billion in 2026 and is forecast to reach USD 32.86 billion by 2031 at 11.94% CAGR over 2026-2031.[1]Thread Group, “Thread 1.4 Product Certifications Pass 670 Milestone,” threadgroup.org The upward trajectory is shaped by falling IoT sensor prices that simplify large-scale deployment, mandatory net-zero building codes that accelerate digital retrofits, and hybrid-work policies that reward real-time space optimisation. Interoperable standards such as Thread 1.4, certified on more than 670 products by Q1 2025, remove integration risks and shorten payback windows. Private 5G rollouts across commercial campuses underpin advanced analytics that lower utilities and maintenance costs while enabling predictive workplace services. Vendors are also scaling software-as-a-service models that bundle continuous optimisation with outcome-based pricing, a shift that converts one-time capital expenditure into recurring revenue. The Smart space market, therefore, benefits from both top-line demand for compliance and bottom-line demand for efficiency.
Key Report Takeaways
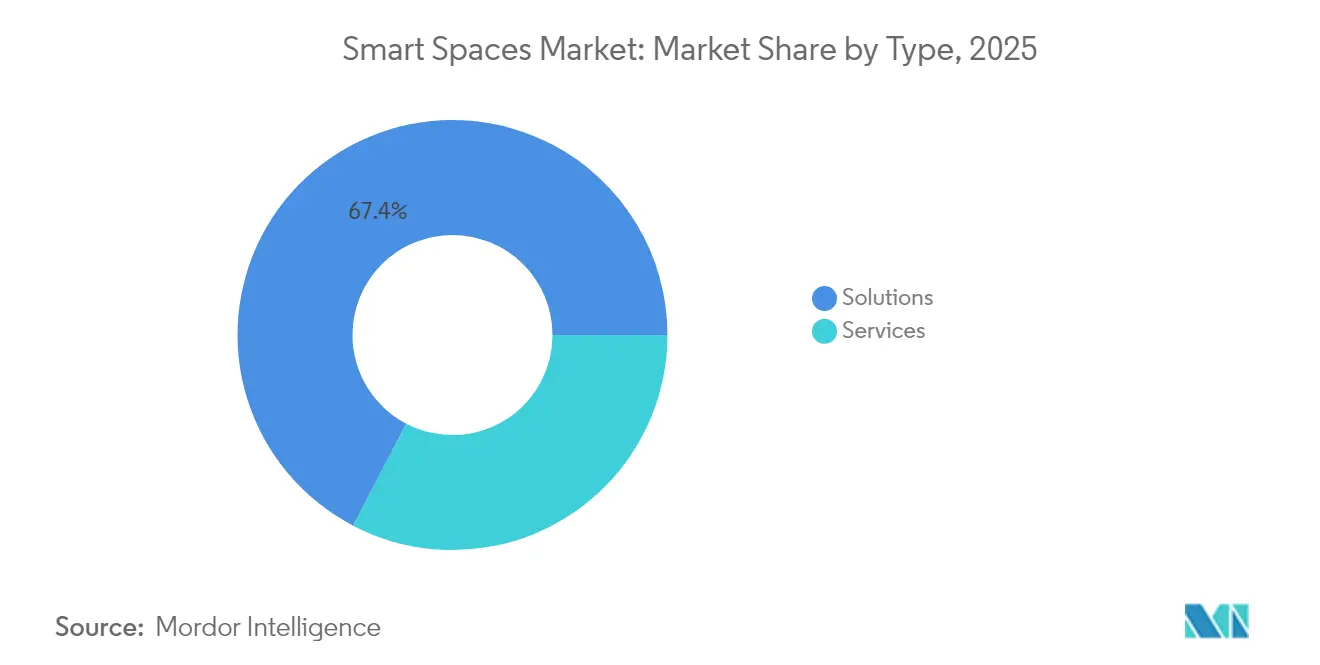
- By type, Solutions captured 67.35% of the Smart spaces market share in 2025, whereas Services are projected to expand at a 13.61% CAGR through 2031.
- By end-user industry, the commercial segment led with 58.40% revenue in 2025; residential deployments are forecast to advance at a 13.28% CAGR to 2031.
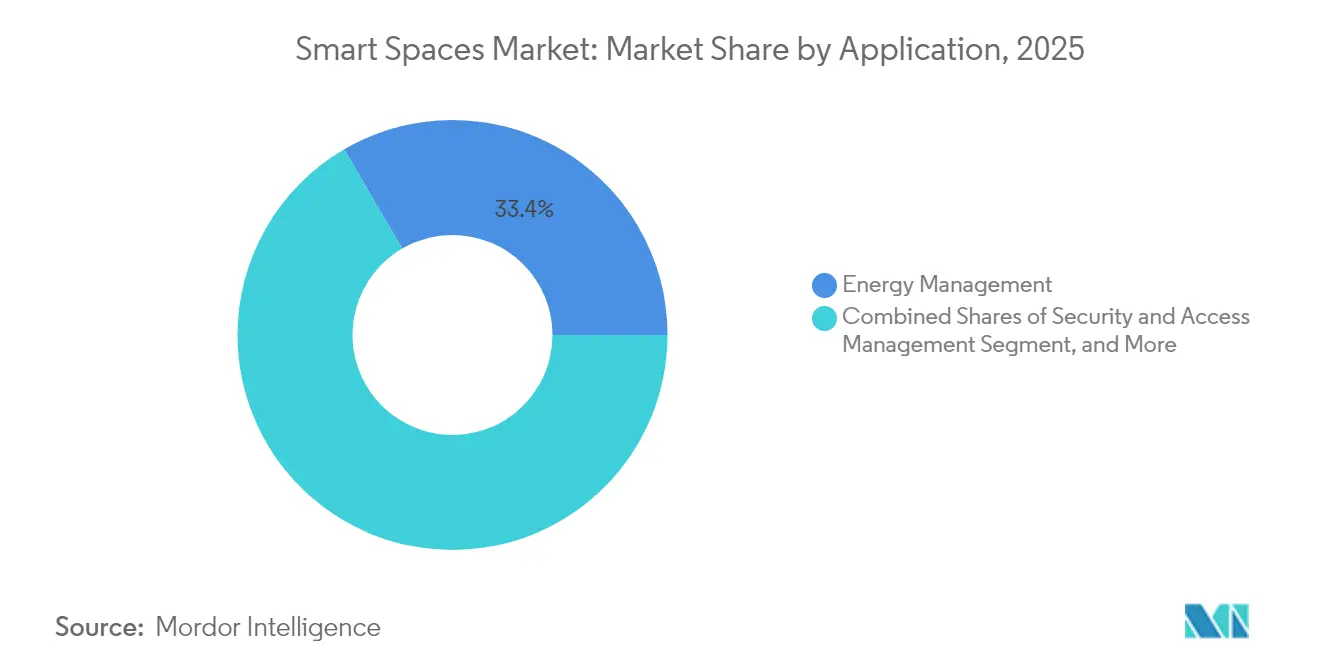
- By application, Energy Management accounted for 33.40% of the Smart space market size in 2025, while Occupancy and Space Analytics are projected to grow at a 12.21% CAGR.
- By connectivity, Wi-Fi held 47.10% of 2025 revenue; Thread/Matter networks are expected to rise at a 12.62% CAGR over the forecast period.
- By geography, North America commanded 36.40% of 2025 revenue, yet, Asia Pacific is on track for a 13.06% CAGR through 2031.
Note: Market size and forecast figures in this report are generated using Mordor Intelligence’s proprietary estimation framework, updated with the latest available data and insights as of 2026.
Market Trends and Insights
Drivers Impact Analysis of Smart Spaces Market*
| Driver | (~) % Impact on CAGR Forecast | Geographic Relevance | Impact Timeline |
|---|---|---|---|
| IoT-enabled device proliferation and falling sensor prices | +2.8% | Global, APAC leads volume deployment | Medium term (2-4 years) |
| Accelerated hybrid-work redesign of offices | +2.1% | North America and EU core markets | Short term (≤2 years) |
| Mandatory green-building / net-zero regulations | +1.9% | EU, California, select APAC markets | Long term (≥4 years) |
| AI-driven workplace analytics reducing real-estate OPEX | +1.7% | Global, concentrated in Tier-1 cities | Short term (≤2 years) |
| Rapid 5G private-network roll-outs in commercial estates | +1.4% | North America, EU, Japan, South Korea | Medium term (2-4 years) |
| Rise of occupancy-based insurance and leasing models | +1.3% | North America, select EU markets | Long term (≥4 years) |
| Source: Mordor Intelligence | |||
IoT-enabled device proliferation and falling sensor prices
Semiconductor oversupply has pushed sensor average selling prices down by double-digits since 2023, allowing building owners to blanket properties with occupancy, air-quality and power-meter nodes that feed granular data to cloud analytics. More than 670 Thread-certified devices shipped by early 2025, a clear signal that vendors now view multi-vendor interoperability as table stakes. A 352-sensor deployment at Milesight’s headquarters cut annual utilities by USD 45,000, a case that has circulated widely among facilities managers. Expanded memory bandwidth in edge AI chips eliminates latency penalties and supports real-time control loops, yet brownfield integration still varies by legacy wiring and controls. As capital costs decline, decisions hinge on energy-saving proof points rather than hardware affordability, a pivot that keeps the Smart space market in a demand-led cycle.
Accelerated hybrid-work redesign of offices
Hybrid scheduling fluctuates weekday headcounts, making legacy time-of-day HVAC programming obsolete. Johnson Controls logged 16% order growth in Q1 2025 for adaptive controls that modulate airflow and lighting to actual presence rather than historical averages. A Washington D.C. office building realised 33% energy savings after replacing static set-points with multi-sensor occupancy data that instructs chillers to follow demand curves. AI ventilation models have kept CO₂ concentrations below 1,000 ppm while trimming ventilation energy by 12.5%, aligning wellness goals with bottom-line targets. The commercial landlord community is experimenting with dynamic rent that flexes by verified utilisation, turning data exhaust into revenue streams. Real-time analytics, however, require cyber-hardened networks and secure data lakes to protect tenant privacy under GDPR and CCPA.
Mandatory green-building / net-zero regulations
The EU’s recast Energy Performance of Buildings Directive stipulates that all new structures must be zero-emission from 2030, effectively mandating smart controls that verify consumption targets. California’s 2025 code revision imposes similar thresholds, while China’s Urban Digital Public Infrastructure Standard galvanises local governments to hard-wire energy dashboards into permitting flows. These policies translate sustainability rhetoric into enforceable building-level metrics, anchoring a stable demand floor for energy-management software. Smaller asset owners face compliance cost anxiety, yet service-contract models that combine hardware, software and performance guarantees distribute financial load over multi-year terms. Regulatory certainty therefore crowds in capital, particularly from infrastructure funds that treat digital retrofits as eligible green-bond assets.
Rapid 5G private-network rollouts in commercial estates
Enterprises are deploying stand-alone 5G cores to guarantee latency below 10 ms for mission-critical building systems. Ericsson’s 2025 Istres pilot showed capital outlay 25% under fibre rewiring while providing deterministic bandwidth for encrypted video and autonomous robots.[2]Ericsson, “Private 5G Powers Smart Aviation Campus,” ericsson.comVodafone Business and Lufthansa Technik now stream terabytes of telemetry inside hangars without interference losses. The telecom-grade slice allows hundreds of thousands of sensors to coexist without Wi-Fi congestion, paving the way for predictive maintenance at the component level. Although spectrum licensing and network engineering costs remain steep, landlords with multi-tenant industrial parks use shared-network pricing to amortise investment. As equipment costs fall, private 5G coverage is expected to permeate premium offices first, then cascade into retail and education campuses, further expanding the Smart space market.
Restraints Impact Analysis of Smart Spaces Market*
| Restraint | (~) % Impact on CAGR Forecast | Geographic Relevance | Impact Timeline |
|---|---|---|---|
| High upfront retrofit costs for brown-field buildings | -1.8% | Global, particularly acute in mature markets | Medium term (2-4 years) |
| Cyber-security and data-privacy liabilities | -1.2% | EU (GDPR), California (CCPA), global enterprise | Short term (≤2 years) |
| Inter-vendor interoperability gaps and standards fragmentation | -0.9% | Global, diminishing with Matter adoption | Short term (≤2 years) |
| Volatility in commercial real-estate valuations | -1.1% | North America, select EU markets | Medium term (2-4 years) |
| Source: Mordor Intelligence | |||
High upfront retrofit costs for brown-field buildings
Older properties often contain proprietary HVAC or lighting systems that resist open-protocol overlays. QuadReal required a passive optical backbone across 30 million sq ft to unify disparate subsystems, a capital project justifiable only by projected 50-70% operational savings. Limbach’s digitisation of 20 sites spanning multiple HVAC vintages exposed inconsistent data granularity that complicated analytics. Pilot programmes such as PHOENIX delivered headline efficiency gains of 39-61% but demanded customised middleware to normalise telemetry. Energy-service-company financing and outcome-based leases help convert cash outlays into service fees, yet decision cycles still elongate when stakeholders must coordinate mechanical, electrical, and IT upgrades under one project charter.
Cyber-security and data-privacy liabilities
Smart-building networks lengthen the attack surface, and multidecade asset lifecycles mean hardware cannot be patched as quickly as consumer devices. The US IoT Advisory Board flagged building controls as priority risk zones in its 2024 roadmap, citing weak default credentials and unencrypted backhauls.[3]National Institute of Standards and Technology, “IoT Advisory Board 2024 Recommendations,” nist.gov Healthcare operators face HIPAA overlay on top of GDPR, complicating vendor selection when sensor data may reveal patient movement patterns. Thread 1.4 improves secure-by-design posture via AES-encrypted mesh, but operators still require zero-trust frameworks spanning edge gateways to cloud APIs. Insurance underwriters have begun adjusting premiums based on cyber-rating of building systems, turning security diligence into a direct operating expense.
*Our forecasts treat driver/restraint impacts as directional, not additive. The impact forecasts reflect baseline growth, mix effects, and variable interactions.
Smart Spaces Market Segment Analysis
By Type:
Services scale as clients pivot from ownership to outcomesSolutions retained the lion’s share at 67.35% of 2025 revenue, equal to USD 11.25 billion of the Smart space market size. Hardware devices and supervisory software form the digital backbone, yet end-users increasingly outsource optimisation to third parties. Services are set to post a 13.61% CAGR, reflecting appetite for continuous commissioning, remote diagnostics, and AI-driven decision support. BrainBox AI launched its generative building assistant in March 2024, enabling conversational queries about energy anomalies and prescriptive adjustments. Trane Technologies quickly folded the capability into its aftermarket portfolio, bundling autonomous HVAC controls inside outcome-based contracts that guarantee double-digit utility cuts. Managed-service vendors monetise hourly telemetry by feeding algorithms that keep chillers within narrow set-point bands, reducing wear and curbing carbon fees. As labour shortages constrain in-house facility teams, executives view external expertise as risk insurance against performance penalties.
In the long run, hybrid cloud architectures will blur product and service boundaries because device firmware, analytics models, and security patches update continuously. Vendors that own both edge devices and cloud platforms can push over-the-air enhancements without onsite visits, deepening lock-in while squeezing pure-play hardware rivals. The Smart space market therefore rewards firms that pivot from one-and-done installations toward lifecycle stewardship, reinforcing the Services growth premium.



By End-user Industry:
Residential acceleration meets commercial incumbencyCommercial real estate, healthcare, hospitality and retail collectively generated 58.40% of 2025 revenue, or USD 9.75 billion of the Smart space market size. Offices pursue flexible seating that demands analytics-ready occupancy data, whereas hospitals track air exchange and device uptime for infection control. Yet residential demand, especially in multi-dwelling units, is forecast to rise at a 13.28% CAGR. Logical Buildings is orchestrating a USD 110 million virtual power plant across multifamily stock to monetise demand response, demonstrating fleet-scale residential economics. SmartRent earmarked USD 10 million in December 2024 to widen landlord adoption of self-service resident portals, access control, and sub-metering. Utilities in deregulated markets offer cash incentives for smart thermostats linked to peak-shave programmes, aligning homeowner interests with grid stability. While consumer price sensitivity remains a restraint, bundled broadband plus energy packages lower acquisition friction, tilting the Smart space market toward balanced demand across sectors by 2030.
Regulators also push home energy management via mandatory sub-meters in new apartments across parts of the EU and select US states. This policy tailwind elevates residential volumes, though per-unit revenue lags commercial averages. Vendors combat margin dilution through platform multiproduct cross-sales spanning security, wellness and eldercare monitoring. As service portfolios deepen, the residential curve narrows its gap with commercial incumbents, confirming the Smart space industry’s evolution into a ubiquitous infrastructure layer.
By Application:
Analytics ascend while energy management remains coreEnergy Management held 33.40% of 2025 spending, anchoring the Smart spaces market at USD 5.58 billion. Mandatory disclosure of carbon intensity and volatile power tariffs sustains the category. Occupancy and Space Analytics, however, is pencilled in for the fastest 12.21% CAGR as hybrid-work firms seek real-time dashboards that reconcile lease costs with headcount trends. Schneider Electric’s 2025 SpaceLogic controller embeds edge AI to coordinate HVAC, lighting, and blinds, slicing energy by up to 35% in pilot sites. In parallel, grocery-chain refrigeration projects such as Hussmann’s Refrigeration IQ deploy computer vision to detect leaks before refrigerant-loss fines mount. Data-rich analytics pipelines become revenue engines themselves, with some landlords packaging anonymised utilisation trends for workplace designers. As models mature, insight outputs will integrate with enterprise planning suites, reinforcing the Smart space market’s strategic role in real-estate valuation.
Legacy categories like Security and Access Management converge toward unified credential platforms that share device identifiers with occupancy systems, improving threat resolution times. Facility Automation Integration Platforms glue disparate OEM equipment into a single semantic layer, reducing integration debt. Vendors that expose open APIs gain ecosystem gravity, whereas closed protocols risk isolation as Thread/Matter momentum compounds.
By Connectivity Technology:
Thread/Matter momentum challenges Wi-Fi orthodoxyWi-Fi supplied 47.10% of 2025 link-layer revenue, courtesy of mature infrastructure and high throughput. Yet Thread/Matter is forecast to post a 12.62% CAGR through 2031 as energy-scavenging radios extend battery life and mesh topology trims gateway counts. Apple baked Thread 1.4 into tvOS 26 in 2025, while Google and Amazon prepare 2026 rollouts, legitimising the stack for commercial estates. Siemens, Enlighted, and Zumtobel now co-develop intelligent lighting that doubles as a Thread backbone, accelerating fixture-level sensor density. Bluetooth Low Energy survives for beaconing and proximity tags, whereas NB-IoT/LoRaWAN address long-range metering. Wired Ethernet with Power-over-Ethernet persists in CCTV and high-draw LED drivers. The connectivity shakeout shrinks custom gateway SKUs and simplifies commissioning, lowering total cost of ownership and broadening the Smart space market.
For emerging-market projects where Wi-Fi affordability remains decisive, multi-radio modules ensure forward compatibility. Vendors hedge by certifying identical firmware across Thread, Zigbee and Bluetooth, enhancing supply-chain flexibility. In effect, interoperability ceases to be a differentiator and becomes a prerequisite, shifting competitive focus to analytics depth and service quality.
Geography Analysis
North America Smart Spaces Market
North America contributed 36.40% of 2025 revenue, driven by stringent state-level energy codes and early adoption of hybrid-work analytics. California’s aggressive standards and federal tax credits support deep retrofits, while private 5G pilots in logistics parks validate latency-sensitive use cases. Honeywell recorded 8% organic growth across its building automation lines in Q1 2025, underpinned by US demand for cloud-native dashboards. Cyber-security regulation accelerates managed-service uptake as firms outsource compliance tasks to trusted vendors. Retrofit costs for ageing stock temper rollout pace, but outcome-based contracts that tie fees to measured savings unlock conservative budgets, keeping the Smart space market on a solid expansion path.
APAC and EMEA Smart Spaces Market
Asia Pacific is on track for a 13.06% CAGR and will increasingly tilt global volume. China allocated USD 4.5 billion to smart city pilots in its 2024 budget, stipulating that all new municipal buildings integrate digital twins. Japan’s Society 5.0 roadmap bundles smart buildings with wider robotics and mobility networks, while India’s Smart Cities Mission spans 8,000 live projects worth USD 19.67 billion. Corporate investments match the public push: Toyota’s Woven City near Mount Fuji serves as a private testbed for sensor-dense neighbourhoods. Heterogeneous regulatory landscapes complicate multinational scaling, but common motivations—urban density, energy security and ageing populations—sustain demand across the region. Europe maintains disciplined growth on the back of climate policy. The EU’s zero-emission mandate guarantees a replacement market for inefficient controls, and GDPR ensures that privacy-by-design features carry premium pricing. Siemens committed EUR 750 million to regenerate Berlin’s Siemensstadt with digital twins, reflecting confidence in smart campus models. Middle East and Africa trail in adoption but showcase showcase megaprojects: Saudi Arabia’s Neom and the UAE’s Masdar City rely on fully digital building fabrics, serving as regional proof points. Budget volatility and political risk keep deployment skewed to government-backed ventures, yet demonstrable returns draw private co-investors over time, widening the addressable Smart spaces market.

Regulatory Landscape
Smart spaces deployments increasingly track building energy performance and cyber risk in regulated markets. In Europe, the recast Energy Performance of Buildings Directive (EPBD) anchors digital retrofit demand by tying compliance to measurable building-level performance. It also tasks the European Commission to report on testing the Smart Readiness Indicator (SRI) by June 30, 2026, reinforcing the role of connected controls and monitoring. Separately, CENELEC standardization is tightening interoperability expectations, including EN 50090-6-2:2025 (HBES IoT semantic ontology model for buildings), with national implementation due by June 30, 2026. This affects how vendors model and exchange building data across multi-vendor estates.
Cybersecurity regulation is moving from guidance to enforceable product obligations. The EU Cyber Resilience Act (Regulation (EU) 2024/2847) introduces horizontal cybersecurity requirements for products with digital elements placed on the EU market. That includes smart home and building control devices that form part of the smart spaces stack. Key CRA milestones in 2026 include applicability of Chapter IV provisions on notifying conformity assessment bodies on June 11, 2026, and manufacturer reporting obligations for actively exploited vulnerabilities and severe incidents starting September 11, 2026. In the United States, NIST work on building digitization and semantic interoperability, including alignment with ASHRAE 223P targeted for publication in FY2026, is shaping procurement requirements for interoperable, machine-readable building metadata, particularly for large enterprise and public-sector projects.
Value Chain Analysis
The smart spaces value chain spans component and device suppliers (sensors, controllers, gateways, cameras, access readers), connectivity layers (Wi-Fi, BLE, Thread/Matter, cellular and private 5G), platform software (BMS, energy management, space analytics, digital twins), and lifecycle services (integration, commissioning, managed optimization, cybersecurity and compliance). Large incumbents (including Siemens, ABB, Honeywell, Schneider Electric, Johnson Controls, and Cisco) increasingly bundle device-to-cloud stacks. System integrators and facility service firms also implement multi-site rollouts and ongoing performance contracts that convert one-time deployments into recurring operations and optimization.
Interoperability standards are increasingly embedded into the chain by reducing custom integration work and widening partner ecosystems. In April 2025, CENELEC EN 50090-4-4:2025 defined a vendor-independent Point API over IPv6 networks for smart home and building devices. The Connectivity Standards Alliance also advanced cross-vendor device onboarding and orchestration with Matter 1.6 (June 2026), and introduced Aliro 1.0 (February 2026) to standardize digital access across NFC, BLE, and UWB for corporate, hospitality, and residential use cases. On the upstream side, supply constraints and cost inflation have influenced procurement and retrofit economics, with HVAC equipment prices cited as having increased by as much as 68% between 2019 and 2025, pushing building owners toward phased retrofits and outcome-based service bundles. Cloud and edge infrastructure providers are taking a larger role as open standards integration efforts (for example, Siemens Building X with Microsoft Azure IoT Operations using W3C Web of Things and OPC UA PubSub) shift value from proprietary gateways toward software-defined integration and data models.
Competitive Landscape
The competitive field is moderately fragmented. A cohort of diversified conglomerates—Honeywell, Siemens, Johnson Controls, ABB, and Schneider—leverages large installed bases to cross-sell analytics subscriptions. Each is bulking up through targeted M&A: Honeywell finalised the USD 4.95 billion purchase of Carrier’s Global Access Solutions in June 2024, folding credential management into its Forge stack. Trane acquired BrainBox AI in December 2024, gaining autonomous HVAC controls and a 14,000-site footprint for data harvesting. Market disruptors include software-first firms such as ThoughtWire and Spacewell that pitch vendor-agnostic digital twins, competing on deployment speed rather than hardware breadth.
Interoperability standards de-risk smaller entrants. Thread 1.4 and Matter certification levels the connectivity playing field, allowing sensor start-ups to sell into large enterprises without proprietary gateways. Private 5G creates a new value chain where telecom operators and edge-infra specialists like Nokia and HPE GreenLake vie to host building automation workloads. Patent filings emphasise semantic data models that simplify multi-system orchestration, indicating the next battleground is contextual data not device count.
Price competition is muted because buyers prioritise proven savings and regulatory compliance over lowest capex. Vendors differentiate with AI credibility: Johnson Controls markets generative AI planning tools inside OpenBlue, while Bosch earmarked EUR 2.5 billion for AI agents that learn behavioural patterns to pre-empt maintenance. System integrators such as Accenture and Infosys play orchestration roles but do not control device roadmaps, positioning hardware-software hybrids to capture the lion’s share of future Smart space market expansion.
Smart Spaces Industry Leaders
ABB Ltd
Siemens AG
Adappt Intelligence Inc.
Spacewell Faseas
Cisco Systems Inc.
- *Disclaimer: Major Players sorted in no particular order
Smart Spaces Market Companies Covered in this Report
- ABB Ltd
- Siemens AG
- Cisco Systems Inc.
- Schneider Electric SE
- IBM Corporation
- Microsoft Corporation
- Honeywell International Inc.
- Johnson Controls International
- Huawei Technologies Co. Ltd.
- Hitachi Vantara LLC
- ICONICS Inc.
- Spacewell (Nemetschek Group)
- SmartSpace Software PLC
- Ubisense Ltd.
- Adappt Intelligence Inc.
- Enlighted Inc. (Siemens)
- Bosch Building Technologies
- Legrand SA
- Crestron Electronics Inc.
- Verkada Inc.

Market Opportunities and Future Outlook
A key opportunity area is district-scale smart spaces that extend building automation into multi-asset campuses and mixed-use developments, where unified energy, mobility, and water management increases the value of shared data models and common operating platforms. Recent project activity points to demand for large sensor footprints and AI-enabled operations, with Msheireb Properties, Ooredoo Qatar, and Honeywell deploying an AI-powered management platform across Msheireb Downtown Doha integrating more than 650,000 IoT sensors (February 2026). The Diriyah Gate Development Authority also awarded Hitachi a master systems integrator contract for AI-driven management across energy, mobility, water, and heritage for the Diriyah master plan (April 2026). These programs pull through adjacent requirements in cybersecurity, interoperability, and systems integration, creating whitespace for vendors that can standardize onboarding across heterogeneous devices while maintaining governance for privacy and operational risk.
Another opportunity is standards-led data sharing and semantic interoperability that lowers integration costs for brownfield retrofits and multi-vendor portfolios. Government and standards bodies are pushing this direction through initiatives such as the UK Smart Data Roadmap (2024-2025), which frames legislative mandates for data sharing in targeted sectors, and NIST convening work on technologies and use cases for smart standards (March 2026), which supports procurement language for consistent data definitions. Infrastructure-led smart spaces in logistics and ports also broaden addressable use cases beyond offices. Midports Holdings broke ground on Malaysia’s first Smart AI Container Port in Pasir Panjang under Malaysia Vision Valley 2.0 (July 2026), highlighting demand for sensor-rich operational control, edge compute, and secure connectivity across large physical environments where downtime and energy intensity are material cost drivers.
Recent Industry Developments in Smart Spaces Market
- July 2026: Cisco published an intelligent workplace blueprint that details how Cisco Spaces, Webex devices, and Meraki cameras can be integrated to improve space utilization and building operations. The update highlighted a Washington, D.C. U.S. GSA pilot that reported 73% energy efficiency gains, reinforcing the role of network-native telemetry in quantifying outcomes for smart space programs.
- July 2025: Siemens Smart Infrastructure and Microsoft announced an integration of Siemens Building X with Azure IoT Operations to simplify building data interoperability using open standards. The collaboration targets faster onboarding of heterogeneous building systems and helps enterprise owners reduce integration effort across multi-vendor portfolios.
- June 2024: Honeywell completed its USD 4.95 billion acquisition of Carrier’s Global Access Solutions business, adding identity and access capabilities to its building technology stack. The combination strengthens end-to-end smart space offerings where credential management and occupancy data increasingly feed unified analytics and automation workflows.


Smart Spaces Market Report Scope and Research Methodology
Market Definition and Coverage
For this methodology, the smart space market is counted as the annual revenue generated from solutions and services that make physical spaces responsive, connected, and more automated through sensors, software platforms, and connectivity.
Scope exclusions: we exclude general construction spend, basic IT networking that is not deployed for smart-space use cases, and standalone consumer gadgets that do not support space-level monitoring or automation.
Segments Covered in This Report
- By Type
- Solutions
- Software Platforms
- Hardware and Edge Devices
- Services
- Professional Services
- Managed Services
- Solutions
- By End-user Industry
- Commercial
- Offices and Co-working Spaces
- Retail and Malls
- Healthcare Facilities
- Hospitality and Leisure
- Residential
- Single-family Homes
- Multi-dwelling Units
- Commercial
- By Application
- Energy Management
- Occupancy and Space Analytics
- Lighting and HVAC Control
- Security and Access Management
- Facility Automation Integration Platforms
- By Connectivity Technology
- Wi-Fi
- Bluetooth Low Energy (BLE)
- Zigbee
- Thread / Matter
- Z-Wave
- NB-IoT and LoRaWAN
- Wired (Ethernet / PoE)
- By Geography
- North America
- United States
- Canada
- Mexico
- South America
- Argentina
- Brazil
- Rest of South America
- Europe
- United Kingdom
- France
- Germany
- Rest of Europe
- Asia Pacific
- China
- Japan
- India
- South Korea
- Rest of Asia Pacific
- Middle East and Africa
- Middle East
- Saudi Arabia
- United Arab Emirates
- Turkey
- Rest of Middle East
- Africa
- Nigeria
- South Africa
- Rest of Africa
- Middle East
- North America
Data Sources, Market Sizing, and Validation
Desk Research
Desk research was used to set the market boundary, build the initial demand pool, and sanity check how adoption is shifting across commercial and residential settings. We referenced public and official sources such as the US Energy Information Administration (building energy use data), the International Energy Agency (efficiency indicators), NIST (smart building and cyber guidance), the FCC (spectrum and connectivity references), and ISO/IEC publications that describe interoperability and device standards.
Along with these, we reviewed company annual reports, investor presentations, product documentation, and reputable press to map solution types, typical pricing logic, and how deployments are packaged into software, hardware, and services. For cross-checking shipments, patents, and corporate activity signals, we also used selected paid subscriptions for company financials and patent databases. These examples are not exhaustive, and additional public and paid references were used for data collection, validation, and clarification during the work.
Primary Interviews and Surveys
Primary work focused on validating what gets purchased in a smart space project, how revenue splits between platforms, connected devices, and services, and how buying cycles differ by building type. We spoke with solution providers, channel partners, and end-user teams across major regions, so assumptions from the desk research could be corrected, then rechecked before finalizing the model.
Distribution of primary research fieldwork respondents
| Company type | Respondent position | Region |
|---|---|---|
| Top tier: 30% | CXOs: 13% | APAC: 49% |
| Mid tier: 54% | Functional/Unit leaders: 30% | EMEA: 29% |
| Smaller Players: 16% | Managers: 57% | Americas: 22% |
Market-Sizing & Forecasting
Sizing started with a top-down model where the addressable spend was reconstructed using indicators tied to smart-space rollouts, such as building energy-efficiency programs, connected-device penetration in facilities, and the practical share of spaces that adopt centralized monitoring and automation. Those totals were then corroborated using selective bottom-up approximations, including sampled pricing for platforms and services, typical device counts per site, and channel checks on project scale. Where coverage was limited, gaps were handled by using conservative adoption ranges.
To keep the model grounded, we used inputs that can be traced back to repeatable signals, including smart building retrofit activity, connectivity mix (Wi-Fi, BLE, Zigbee, Thread/Matter, cellular IoT, and wired Ethernet/PoE), average software subscription progression, service attach rates in deployments, and the pace of policy-driven energy management adoption. For forecasting, scenario analysis was applied and then calibrated with expert consensus on adoption timing, pricing pressure, and the shift toward software-led recurring revenue.
Data Validation & Update Cycle
Outputs were validated through multiple checks, including cross-verifying regional totals against independent signals such as construction and retrofit cycles, device connectivity adoption, and public energy-efficiency targets. When large variances appeared, assumptions were re-opened, interview notes were revisited, and follow-up discussions were triggered to confirm what was changing in scope or pricing.
Before sign-off, the model and key assumptions are reviewed in steps by analysts, and anomalies are challenged until the logic is clear and reproducible. Reports are refreshed annually, and interim updates are made when material events shift demand or pricing. Right before delivery, we do a final pass to ensure the latest public indicators and market events are reflected.
Mordor Intelligence's Smart Space Market Size Compared With Other Published Estimates
Published numbers for smart space often differ because firms do not count the same revenue streams, and they also time their base year and currency conversions differently. Differences also show up when one estimate treats software, connected devices, and services as one bundle, but another estimate counts only a narrower part of the deployment.
Public signals such as reported software-led building optimization uptake and the connectivity mix used in smart facilities are evidence checks that keep Mordor Intelligence's estimate aligned to deployments that include space monitoring, automation, and ongoing optimization, rather than broad smart building spend. Gaps typically come from adjacent categories being added in, faster pricing expansion assumptions for subscriptions, or longer forecast periods that stack growth over more years.
Benchmark comparison
| Source | Market Size | Gaps in Research Methodology |
|---|---|---|
| Mordor Intelligence | USD 18.69 B (2026) | |
| Industry Research Firm A | USD 15.69 B (2024) | Uses a different base year and a shorter forecast window, and its scope description is broader around integrated environments, which can shift what is counted as smart space versus adjacent smart building activity. |
| Industry Research Firm B | USD 15.20 B (2024) | Leans on an indoor-location and smart infrastructure framing and may weight early adoption differently across premises types, which can pull down near-term revenue recognition compared with a deployment-led definition. |
Taken together, the spread is mainly explained by year choice, the exact boundary between smart space deployments and nearby categories, and how recurring software revenue is progressed. Our approach keeps assumptions traceable to clear adoption and pricing inputs, which helps buyers understand what is included and replicate the steps if they need to adjust scope.


Key Questions Answered in the Report
What is the current size of the Smart space market?
The Smart space market size reached USD 18.69 billion in 2026 and is projected to hit USD 32.86 billion by 2031.
Which segment is expanding fastest?
Services are forecast to post the highest 13.61% CAGR as enterprises shift from capital purchases to managed optimisation contracts.
How large is the Smart space market share of North America
North America accounted for 36.40% of 2025 revenue, the largest regional share in the industry.
Why are Thread and Matter standards important?
They enable devices from different manufacturers to interoperate without custom gateways, lowering integration costs and accelerating deployment.
What role does private 5G play in smart buildings?
Private 5G delivers low-latency, interference-free connectivity that supports mission-critical applications such as autonomous HVAC control and high-resolution video analytics.
Which application area leads spending today?
Energy Management holds the top spot with 33.40% of 2025 revenue, reflecting the direct financial returns of reducing electricity and heating costs.
Page last updated on:





