AI Infrastructure Market Size and Share
Market Overview
| Study Period | 2020 - 2031 |
|---|---|
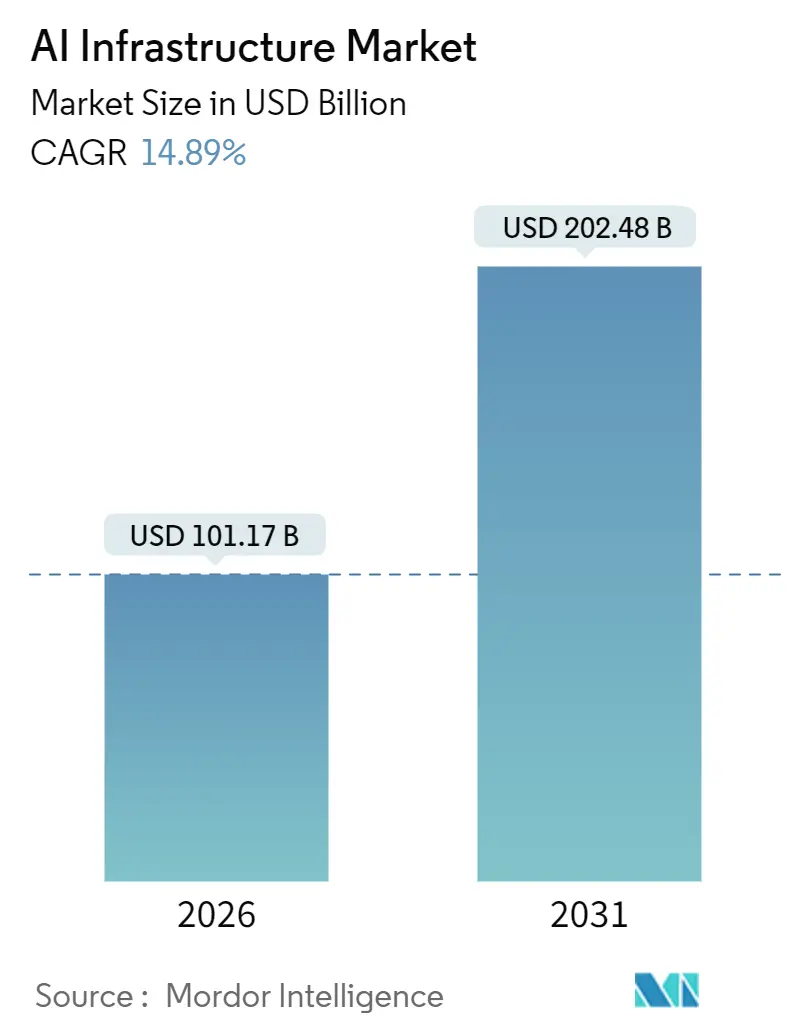
| Market Size (2026) | USD 101.17 Billion |
| Market Size (2031) | USD 202.48 Billion |
| Growth Rate (2026 - 2031) | 14.89% CAGR |
| Fastest Growing Market | Asia Pacific |
| Largest Market | North America |
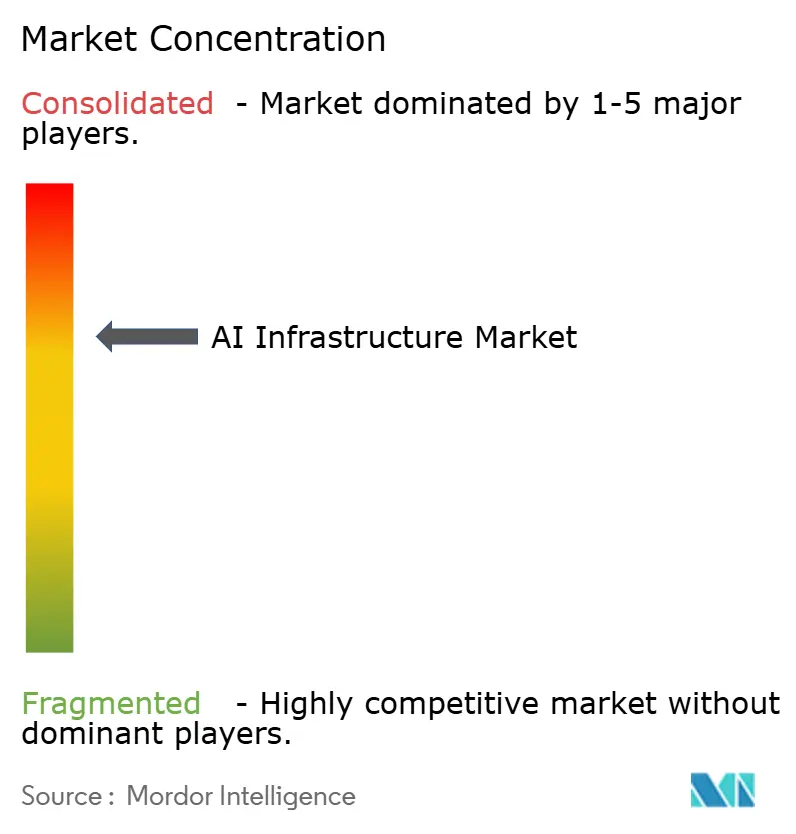
| Market Concentration | Medium |
Major Players *Disclaimer: Major Players sorted in no particular order Image © Mordor Intelligence. Reuse requires attribution under CC BY 4.0. | |
AI Infrastructure Market Analysis by Mordor Intelligence
Market Analysis
The AI infrastructure market size reached USD 101.17 billion in 2026 and is projected to reach USD 202.48 billion by 2031, reflecting a 14.89% CAGR over the forecast period. The expansion aligns with sustained allocations toward compute-intensive workloads, continued subsidy inflows for advanced semiconductor fabs, and a persistent premium on high-bandwidth memory that lengthens lead times for top-tier GPUs. Intensifying liquid-cooling adoption mitigates racks that now surpass 100 kilowatts, while export controls enacted by the United States in 2023 accelerate sovereign AI projects across the Middle East and Asia Pacific. Semiconductor policy has become a growth catalyst, as CHIPS-type incentives underpin fab expansions in the United States, Europe, and Japan. Hyperscalers, facing multi-year backlogs for NVIDIA H100 and H200 accelerators, have responded by pre-ordering next-generation devices and designing custom ASICs to secure capacity.
Key Report Takeaways
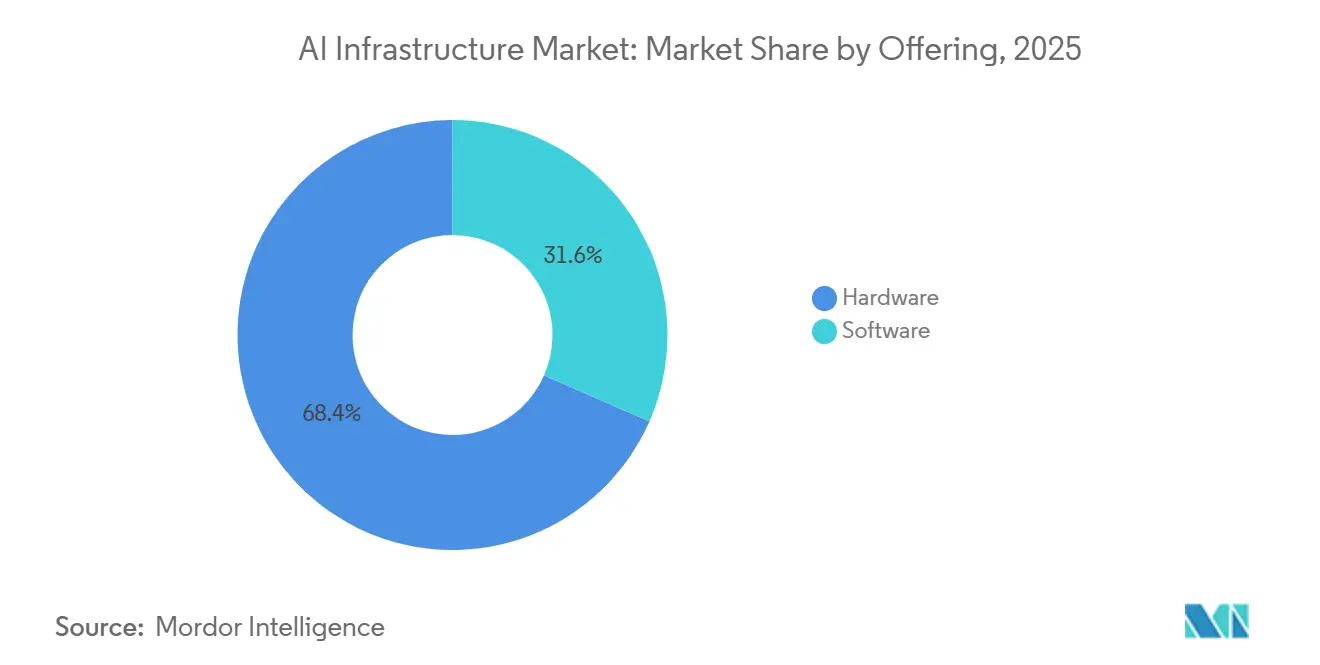
- By offering, hardware led with 68.42% of revenue in 2025; the software segment is forecast to expand at a 16.02% CAGR to 2031.
- By deployment, on-premise architectures held 57.46% of the AI infrastructure market share in 2025, while cloud deployments are projected to advance at a 15.76% CAGR through 2031.
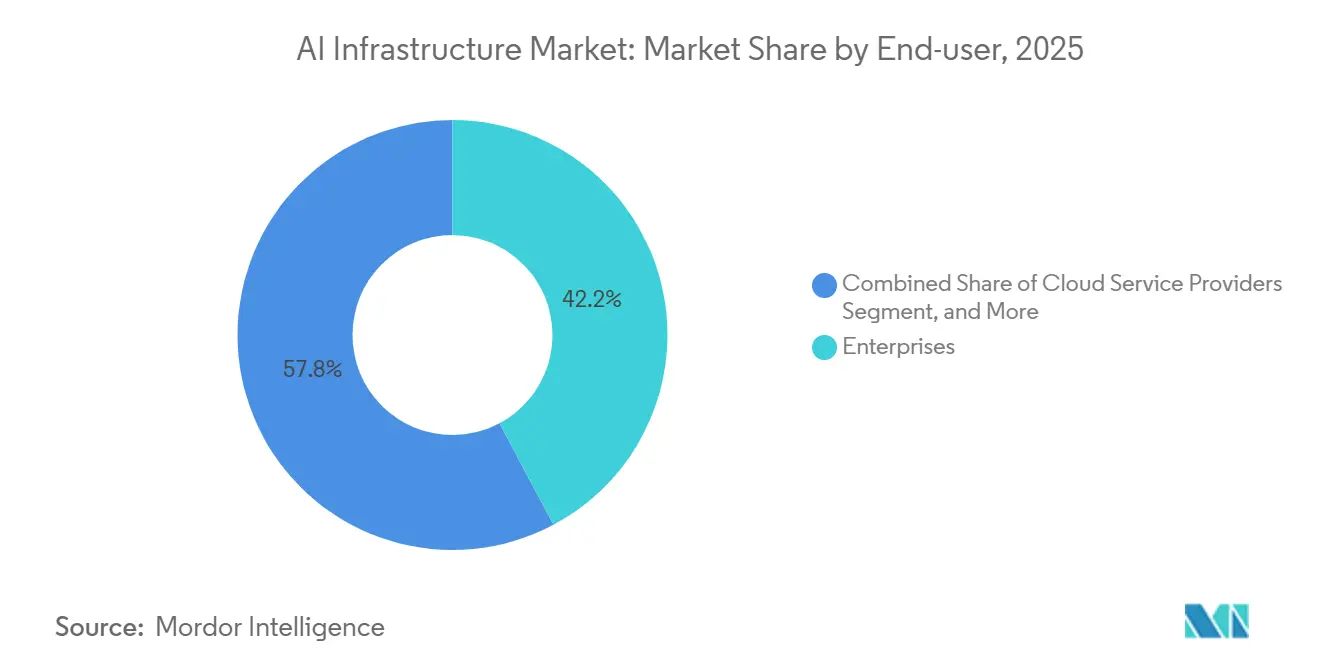
- By end user, enterprises commanded 42.22% share of the AI infrastructure market size in 2025; cloud service providers represent the fastest-growing cohort at 15.24% CAGR to 2031.
- By processor architecture, GPUs retained 88.82% of revenue in 2025, whereas FPGA and ASIC alternatives are poised to grow at 16.89% CAGR through 2031.
- By geography, North America accounted for 39.56% of 2025 revenue; Asia Pacific is expected to expand at a 16.44% CAGR between 2026-2031.
Note: Market size and forecast figures in this report are generated using Mordor Intelligence’s proprietary estimation framework, updated with the latest available data and insights as of January 2026.
Global AI Infrastructure Market Trends and Insights
Drivers Impact Analysis*
| Driver | (~) % Impact on CAGR Forecast | Geographic Relevance | Impact Timeline |
|---|---|---|---|
| Soaring H100 and H200 GPU backlogs | +3.2% | Global, concentrated in North America and Asia Pacific | Medium term (2-4 years) |
| Rapid AI-specific network fabrics | +2.8% | Global, early adoption in North America and Europe | Medium term (2-4 years) |
| Energy-efficient liquid cooling adoption | +2.1% | Global, led by North America and Europe | Long term (≥ 4 years) |
| Government CHIPS-type subsidies for AI fabs | +2.5% | North America, Europe, Asia Pacific | Long term (≥ 4 years) |
| Cloud-native AI accelerator instances | +2.4% | Global, strongest in North America and Asia Pacific | Short term (≤ 2 years) |
| Open-source AI framework optimization | +1.9% | Global | Medium term (2-4 years) |
| Source: Mordor Intelligence | |||
Soaring H100 and H200 GPU Backlogs Among Hyperscalers
NVIDIA reported that 2025 pre-orders for H100 and H200 devices tripled available supply, prompting Microsoft to earmark USD 80 billion for multi-year allocations and AWS to expand its infrastructure budget by USD 100 billion through 2028.[1]Microsoft Communications, “Microsoft Announces USD 80 Billion AI Datacenter Investment,” Microsoft, microsoft.com High-bandwidth memory bottlenecks intensified the imbalance, as SK Hynix and Samsung controlled 95% of HBM3E output. Hyperscalers now co-design memory packaging directly with fabs, weakening the negotiating leverage of traditional GPU vendors. TSMC’s 3-nanometer capacity remained oversubscribed, extending device lead times past 12 months and accelerating a pivot toward custom ASICs such as Google TPU v6e. Enterprises, facing unpredictable delivery schedules, increasingly rent guaranteed instances from cloud providers even when on-demand prices exceed USD 30 per hour for eight-GPU bundles.
Rapid AI-Specific Network Fabrics (InfiniBand NDR, Ethernet 800G)
InfiniBand NDR operated at 400 Gbps and connected about 70% of 2025 AI training clusters, delivering latency that was 40% lower than traditional Ethernet.[2]NVIDIA Networking Team, “InfiniBand Solutions,” nvidia.com Hyperscalers, however, began evaluating 800 Gbps Ethernet as Broadcom’s Tomahawk 5 and Spectrum-X switched traffic at competitive latencies with a 25% reduction in capital cost. Meta validated Ethernet performance by scaling its 10,000-GPU AI Research SuperCluster on 800 Gbps links, widening vendor choice and eroding InfiniBand lock-in. IEEE 802.3df work on 1.6 Tbps Ethernet continues, signaling more convergence between AI and standard data-center workloads.
Energy-Efficient Liquid Cooling Adoption
Liquid cooling penetration rose to 18% of AI racks in 2025 as power densities crossed 100 kilowatts, a threshold at which air systems struggle to remove heat. Direct-to-chip solutions lowered facility energy use by up to 40% and freed 60% of floor space compared with air-cooled equivalents. Microsoft piloted single-phase immersion baths that trimmed cooling infrastructure costs by 45% and expects to roll the approach across hyperscale campuses from 2026 onward. Regulatory incentives in the European Union, including looming carbon price mechanisms, reinforce adoption, whereas deployments in Asia Pacific lag due to lower electricity tariffs.
Government CHIPS-Type Subsidies for AI Fabs
The United States allocated USD 52.7 billion for domestic semiconductor manufacturing, disbursing USD 8.5 billion to Intel, USD 6.6 billion to TSMC, and USD 6.4 billion to Samsung. Europe passed its EUR 43 billion (USD 47 billion) Chips Act to double regional wafer output by 2030. Japan set aside JPY 2 trillion (USD 13.5 billion) to back TSMC’s Kumamoto plant and a 2-nanometer roadmap led by Rapidus. Subsidies accelerate advanced-packaging capacity and de-risk geopolitical concentration in Taiwan, yet the Semiconductor Industry Association projects a 67,000-person talent gap that may delay full utilization.
Restraints Impact Analysis*
| Restraint | (~) % Impact on CAGR Forecast | Geographic Relevance | Impact Timeline |
|---|---|---|---|
| AI-class GPUs in chronic short supply through 2026 | -2.8% | Global, acute in Asia Pacific and Europe | Short term (≤ 2 years) |
| 400 V and 48 V power-conversion limits in legacy sites | -1.9% | Global, concentrated in North America and Europe | Medium term (2-4 years) |
| Sovereign-AI export controls | -2.3% | Global, most severe in Asia Pacific | Long term (≥ 4 years) |
| Rising Scope-2 emissions compliance costs | -1.6% | Europe, emerging in North America | Medium term (2-4 years) |
| Source: Mordor Intelligence | |||
AI-Class GPUs in Chronic Short Supply Through 2026
Lead times for H200 cards lengthened past 52 weeks in 2025, while AMD’s MI300X backlog mirrored the constraint.[3]Reuters Staff, “NVIDIA AI Chip Orders Exceed Supply, Lead Times Stretch,” Reuters, reuters.com CoWoS packaging capacity at TSMC hit 35,000 wafer starts per month, far below demand estimates above 100,000 equivalents. High-bandwidth memory remains scarce because each H100 device needs 80 GB of HBM3 stacked across five layers. Enterprises consequently delayed large-scale deployments and reprioritized model architectures that require fewer parameters. Cloud platforms countered by over-provisioning inventory, dropping utilization rates, and charging elevated spot prices, a tactic that distorts supply signals and suppresses near-term market adoption.
Sovereign-AI Export Controls
October 2023 regulations barred unlicensed shipment of NVIDIA’s A100, H100, and H800 devices to China. China responded with a USD 50 billion chip program, and Huawei’s Ascend 910C achieved parity with A100 on some inference tests in 2025. The European Union’s AI Act adds EUR 5-15 million (USD 5.5-16.5 million) in compliance costs per cross-border deployment. Divergent standards risk a bifurcated ecosystem and elevate switching costs for international firms.
*Our forecasts treat driver/restraint impacts as directional, not additive. The impact forecasts reflect baseline growth, mix effects, and variable interactions.
Segment Analysis
By Offering: Software Gains as Inference Optimization Trumps Raw Compute
Hardware commanded 68.42% of 2025 spending, reflecting capital-intensive GPU clusters, high-bandwidth memory, and NVMe fabrics that push rack densities beyond 100 kilowatts. Software is projected to rise at a 16.02% CAGR to 2031 as enterprises emphasize inferencing efficiency, model observability, and MLOps automation. Tools like Triton Inference Server compress latency by as much as 50% through quantization and kernel fusion. System vendors now bundle orchestration frameworks with observability dashboards, converting one-off licenses into subscriptions. The AI infrastructure market size attributed to software is therefore expanding faster than GPU capital investment, even though absolute spending on accelerators remains larger. Training workloads will stay GPU-centric, but inference is already moving toward purpose-built ASICs that lower total cost of ownership for production pipelines. Enterprises gaining cost relief redeploy freed budgets into data-quality initiatives and retrieval-augmented generation pipelines, pushing middleware adoption higher.
A second catalyst is the rise of large-language-model-as-a-service offerings that embed guardrails for content safety and bias mitigation. Vendors who package middleware with pre-trained models secure recurring revenue and deepen customer lock-in. Independent software providers respond by hardening open-source deployment stacks, ensuring that proprietary licensing does not impede model portability. The emergent dynamic elevates software gross margins toward 75%, well above hardware reselling levels, underscoring why investors favor code over silicon in later-stage funding rounds. The AI infrastructure market therefore shifts from a capital-expenditure cycle to a blended model where subscription revenue stabilizes earnings and mitigates hardware refresh volatility.


By Deployment: Cloud Instances Erode On-Premise Moats Despite Sovereignty Concerns
On-premise infrastructure held 57.46% of spending in 2025, driven by data-residency mandates and sectoral frameworks like HIPAA. Cloud deployments are forecast to grow at 15.76% CAGR as AWS Trainium2 and Google TPU v6e instances deliver multi-petaflop performance at favorable economics. The AI infrastructure market size associated with cloud offerings is thus expanding faster than enterprise capex, especially as hyperscalers standardize pay-per-inference pricing. Financial institutions that once insisted on sovereign hosting now pilot confidential-compute enclaves that keep encryption keys under customer control, reducing regulatory friction.
Hybrid patterns proliferate as enterprises train sensitive models on-premise then shift inference to geographic edge nodes that lower latency for end users. Sovereign AI initiatives in Saudi Arabia and the United Arab Emirates inject more than USD 140 billion to build domestic hyperscale campuses, sustaining a countervailing demand for local deployments. Cloud providers accommodate sovereignty by offering dedicated regions with jurisdictionally ring-fenced networking, certifications, and auditing. Over the long term, however, hardware obsolescence cycles of 18-24 months tilt the cost curve toward shared infrastructure, compelling on-premise defenders to adopt modular designs that swap node boards without re-cabling entire halls.
By End User: Cloud Service Providers Outspend Enterprises to Lock In Competitive Moats
Enterprises accounted for 42.22% of the 2025 AI infrastructure market share, reflecting diversified use cases in manufacturing, retail, and professional services. Cloud service providers are projected to post 15.24% CAGR as hyperscalers pre-commit multi-billion-dollar blocks of HBM3E-attached accelerators. Bulk procurement secures lower unit prices, enabling hyperscalers to offer burstable training clusters at hourly rates still below the amortized cost of enterprise-owned equivalents. Government and defense agencies adopt air-gapped, top-secret enclosures that insulate classified workloads yet benefit from cloud-like management software.
Enterprises weighing build versus rent must navigate capital risk, personnel shortages, and warranty uncertainty. A 1,000-GPU private cluster runs USD 15-30 million upfront and becomes partially obsolete inside two years, while subscription models convert that outlay into predictable operating expense. Hyperscalers compound the advantage with integrated data labeling, MLOps, and fine-tuning services. Governments, however, view AI sovereignty as strategic. Japan’s Ministry of Defense budgeted JPY 500 billion (USD 3.4 billion) for indigenous systems, reflecting geopolitical urgency rather than mere cost considerations.

By Processor Architecture: FPGA and ASIC Alternatives Challenge GPU Hegemony in Inference
GPUs controlled 88.82% of 2025 revenue due to the entrenched CUDA ecosystem and parallelism requirements of transformer training. FPGA and ASIC devices are forecast to expand at 16.89% CAGR as inference workloads prioritize energy efficiency and predictable latency. Intel Gaudi 3 delivers 50% better performance-per-watt than H100 for transformer inference, while Cerebras WSE-3 packs 900,000 cores on a wafer-scale die suited to physics simulations. Google’s TPU v6e already runs production inference at 2.5 times GPU energy efficiency.
The AI infrastructure market therefore splinters between general-purpose GPUs and domain-specific ASICs. Custom silicon carries high non-recurring engineering costs, limiting feasibility to hyperscalers with trillions of inference queries per quarter. FPGAs serve a middle niche in telecommunications and automotive, where algorithms evolve rapidly and field-upgrade flexibility is crucial. Vendors now develop chiplet-based SoCs that interconnect via die-to-die links like UCIe, cutting time-to-market and allowing incremental memory upgrades. NVIDIA’s acquisition of interposer IP and AMD’s investment in chiplet packaging signal a future where modular substrates dilute single-vendor dominance.
Geography Analysis
North America commanded 39.56% of 2025 spending, supported by USD 52.7 billion in CHIPS Act grants and by hyperscalers that operate roughly 60% of global AI capacity. The Semiconductor Industry Association warns of a 67,000-worker talent shortage by 2030, which could slow fab ramp-ups even as capital is plentiful. Canada positions Toronto and Montreal as research hubs backed by supportive immigration policy, whereas Mexico’s grid reliability questions dampen large-scale build-outs. The United States Department of Defense awarded Amazon a USD 50 billion cloud contract, underscoring that sovereign security concerns coexist with a broader shift toward centrally managed compute.
Asia Pacific is expected to grow at a 16.44% CAGR through 2031, propelled by China’s USD 50 billion semiconductor fund and India’s USD 15 billion hyperscaler commitments. Alibaba deployed 100,000 Huawei Ascend 910C accelerators in 2025, illustrating rapid indigenous progress despite export curbs. Japan allocated JPY 2 trillion (USD 13.5 billion) for TSMC’s Kumamoto site and 2-nanometer R&D to hedge geopolitical exposure. South Korea enjoys 95% share of HBM3E supply, an essential choke point in the AI supply chain. Australia’s high power tariffs limit hyperscale, but Sydney and Melbourne still attract colocation players looking for resilient connectivity to submarine cables.
Europe’s growth moderates as AI Act compliance layers EUR 5-15 million (USD 5.5-16.5 million) in incremental cost per multi-nation deployment. Germany and France lead semiconductor subsidies, while Sweden leverages cold climate and hydroelectric power to tempt hyperscalers; Microsoft confirmed a USD 3.2 billion Stockholm campus for 2026. The United Kingdom confronts post-Brexit data transfer frictions that add latency and legal overhead to continent-wide services. Middle East sovereign wealth funds pledge USD 140 billion to converge energy advantage with AI ambitions, supporting Riyadh and Abu Dhabi data center corridors that operate largely outside Western export control regimes.


Competitive Landscape
Oligopolistic structure remains evident at the silicon layer, where NVIDIA captured roughly 80% of 2025 accelerator revenue and maintains a 4-million-developer CUDA moat. Hyperscalers responded by designing ASICs such as Google TPU v6e, AWS Trainium2, and Microsoft Maia 100 that should reach 20% of training hours by 2026, pressuring NVIDIA’s list prices by up to 30% for bulk orders. AMD’s MI325X leverages 288 GB of HBM3E to undercut H200 on price-per-gigabyte, finding early traction in Oracle Cloud deployments. Intel’s Gaudi 3 emphasizes Ethernet connectivity, appealing to enterprises wary of single-vendor ecosystems.
The interconnect layer witnesses consolidation around optical roadmaps, with Broadcom’s Tomahawk 6 offering 1.6 Tbps switching that aligns with IEEE 802.3df milestones. Patent filings trend toward chiplets and die-to-die protocols like UCIe, indicating that modular integration could dilute incumbent advantages by shortening time-to-market for challengers. Triton Inference Server and Apache TVM hold growing mindshare, letting customers switch hardware without wholesale code rewrites, thereby eroding proprietary middleware margins. Edge inference, defined by sub-75-watt power budgets, attracts startups such as Tenstorrent and Graphcore, though deployments remain pilot-scale today.
Environmental scrutiny grows. European carbon mechanisms may add 5-8% to operating expenses by 2028, nudging providers toward renewable energy and liquid cooling. Hyperscalers lead renewable power purchase agreements exceeding 25 GW cumulative, putting sustainability on par with latency as a competitive factor. Talent scarcity also shapes rivalry; NVIDIA and AMD opened combined training academies for 30,000 engineers per year to defend ecosystem loyalty. Overall, competitive intensity rises, but architectural lock-in has begun to erode as open standards mature.
AI Infrastructure Industry Leaders
NVIDIA Corporation
Intel Corporation
Advanced Micro Devices (AMD)
Microsoft Corporation
Amazon Web Services, Inc.
- *Disclaimer: Major Players sorted in no particular order

Recent Industry Developments
- January 2026: NVIDIA unveiled the Blackwell B200 GPU with 208 billion transistors and 20 petaflops FP4 throughput, Microsoft and AWS pre-ordered 50,000 units each for Q3 2026 delivery.
- December 2025: NVIDIA unveiled the Blackwell B200 GPU with 208 billion transistors and 20 petaflops FP4 throughput; Microsoft and AWS pre-ordered 50,000 units each for Q3 2026 delivery.
- November 2025: Amazon Web Services introduced Trainium3 instances, tripling previous-generation throughput at the same price point.
- October 2025: SK Hynix entered mass production of 16-high HBM3E stacks, raising per-GPU capacity to 128 GB.


Research Methodology Framework and Report Scope
Market Definitions and Key Coverage
Our study treats the AI infrastructure market as all revenue generated from specialized hardware, system-level software, and high-performance data-center solutions that enable training and inference of machine-learning workloads at scale. This spans GPUs, AI accelerators, associated storage and memory, orchestration layers, and cloud or on-premises delivery models.
Scope exclusion: Consumer-grade edge devices and generic IT services that do not directly accelerate AI workloads are excluded.
Segmentation Overview
- By Offering
- Hardware
- Processor
- Storage
- Memory
- Software
- System Optimisation
- AI Middleware and MLOps
- Hardware
- By Deployment
- On-Premise
- Cloud
- By End User
- Enterprises
- Government and Defence
- Cloud Service Providers
- By Processor Architecture
- CPU
- GPU
- FPGA/ASIC (TPU, Inferentia, Gaudi, Cerebras)
- Other Processor Architectures
- By Geography
- North America
- United States
- Canada
- Mexico
- South America
- Brazil
- Argentina
- Rest of South America
- Europe
- United Kingdom
- Germany
- France
- Sweden
- Rest of Europe
- Asia Pacific
- China
- Japan
- India
- Australia
- South Korea
- Rest of Asia Pacific
- Middle East
- Saudi Arabia
- United Arab Emirates
- Turkey
- Rest of Middle East
- Africa
- South Africa
- Nigeria
- Rest of Africa
- North America
Detailed Research Methodology and Data Validation
Primary Research
To validate desk findings, Mordor analysts interviewed data-center designers, hyperscale cloud architects, semiconductor road-map managers, and procurement leads across North America, Europe, and Asia Pacific. Guided conversations clarified average selling prices for GPU-dense servers, expected refresh cadences, and the realistic pace of liquid-cooling retrofits, filling gaps that public sources left open.
Desk Research
Analysts began with foundational data from tier-1 sources such as the US Energy Information Administration for data-center power trends, the Semiconductor Industry Association and WSTS for chip shipment volumes, and OECD AI Policy Observatory for policy drivers. Trade bodies like the Open Compute Project, AI Infrastructure Alliance, and Uptime Institute provided cost, rack-density, and cooling benchmarks that feed our supply-side build-out model. Company 10-K filings, investor decks, and earnings calls gave real-world pricing clues, and curated feeds on Dow Jones Factiva and D&B Hoovers flagged new capacity announcements. This list is illustrative; many additional public and paid references were reviewed for data cross-checks.
A second sweep collected import-export signals from Volza, recent liquid-cooling patents through Questel, and regional capital-expenditure statistics from government gazettes in the United States, China, and the EU, helping us anchor regional spreads and technology adoption curves.
Market-Sizing & Forecasting
A top-down construct starts with national data-center stock and annual AI-linked capex, which are then reconciled with GPU shipment records and server ASPs to approximate current value. Select bottom-up roll-ups, sampled supplier revenues, channel checks, and cloud usage disclosures fine-tune totals before a triangulation loop. Key variables in our model include GPU attach rate per rack, median server ASP, global cloud capex growth, liquid-cooling penetration, and power-usage-effectiveness shifts; each series is trended to 2030.
For forecasting, a multivariate regression couples those variables with macro pointers like AI workload growth and sovereign computing incentives. Scenario analysis stress-tests energy-price spikes and silicon supply shocks, and gaps in micro-level data are bridged with regional coefficient estimates vetted by domain experts.
Data Validation & Update Cycle
Outputs undergo two-step peer review, anomaly scans against third-party indicators, and management sign-off. Models are refreshed annually, with interim updates triggered by large fab capacity moves or cloud-spending inflections.
Why Mordor's AI Infrastructure Baseline Commands Reliability
Published numbers often diverge because firms vary scope (for example, some fold generic servers into totals) and apply dissimilar refresh cadences. Our disciplined filter locks onto hardware and system software directly tied to AI acceleration, and we update once fresh shipment or capex data land, keeping clients ahead of the curve.
Key gap drivers include wider component baskets in some studies, aggressive currency-conversion assumptions, or extrapolations that lack on-the-ground price validation. Mordor's mix of primary ASP inputs, annual model upkeep, and segment-specific exclusions curbs such drift.
Benchmark comparison
| Market Size | Anonymized source | Primary gap driver |
|---|---|---|
| USD 87.60 B (2025) | Mordor Intelligence | - |
| USD 58.78 B (2025) | Global Consultancy A | Includes only cloud workloads, omits on-prem refresh cycle |
| USD 135.81 B (2024) | International Analyst B | Adds generic servers and networking gear, uses one-time exchange rates |
In sum, Mordor Intelligence delivers a balanced, transparent baseline anchored to clearly traceable variables and repeatable steps, giving decision-makers a dependable view of the fast-moving AI infrastructure landscape.


Key Questions Answered in the Report
What is the projected value of the AI infrastructure market in 2031?
The market is forecast to reach USD 202.48 billion by 2031, expanding at a 14.89% CAGR over the period.
Which region will grow the fastest in AI infrastructure spending?
Asia Pacific is expected to post a 16.44% CAGR through 2031, spurred by large semiconductor funds in China and hyperscaler expansions in India.
How dominant are GPUs in current AI accelerator revenue?
GPUs held 88.82% of processor architecture revenue in 2025, although ASIC and FPGA devices are now growing faster for inference workloads.
Why are liquid-cooled data centers gaining momentum?
Rising rack densities above 100 kilowatts and stricter carbon pricing make liquid cooling essential, reducing facility energy use by up to 40%.
How do export controls influence AI infrastructure strategy?
U.S. restrictions on high-end GPU shipments to China drive parallel investment in domestic chips, leading to divergent technology stacks and higher compliance costs for multinational deployments.
Page last updated on:


