Digital Infrastructure Market Size and Share
Market Overview
| Study Period | 2020 - 2031 |
|---|---|
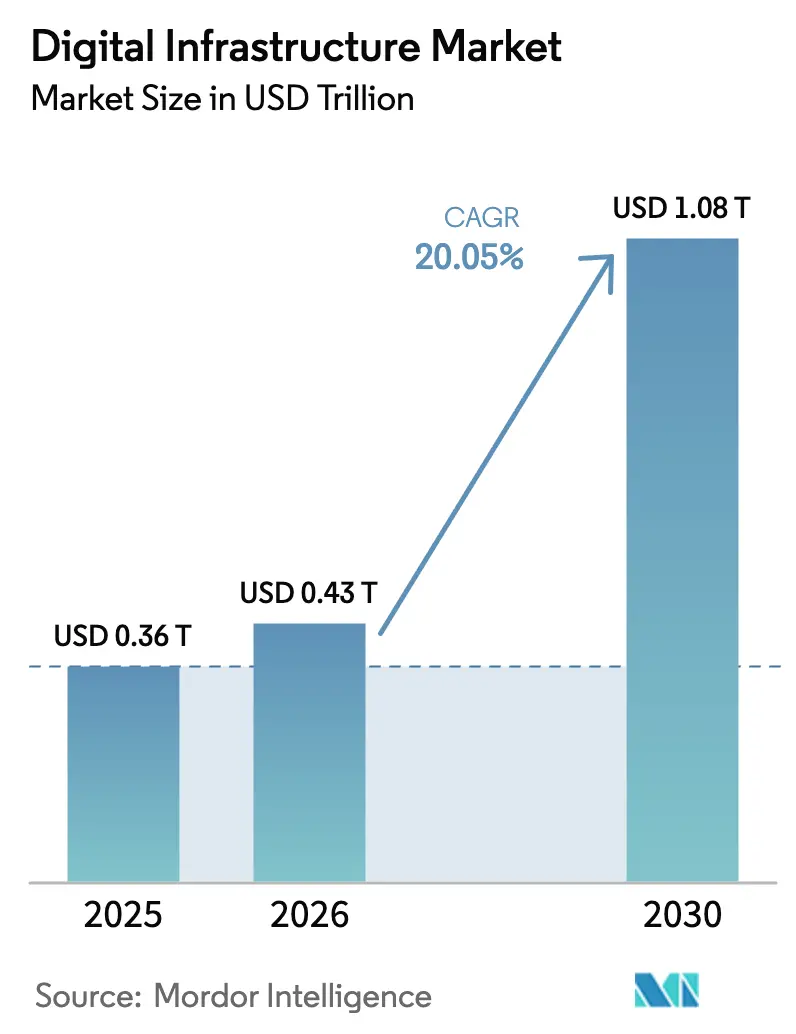
| Market Size (2026) | USD 0.43 Trillion |
| Market Size (2030) | USD 1.08 Trillion |
| Growth Rate (2026 - 2031) | 20.05% CAGR |
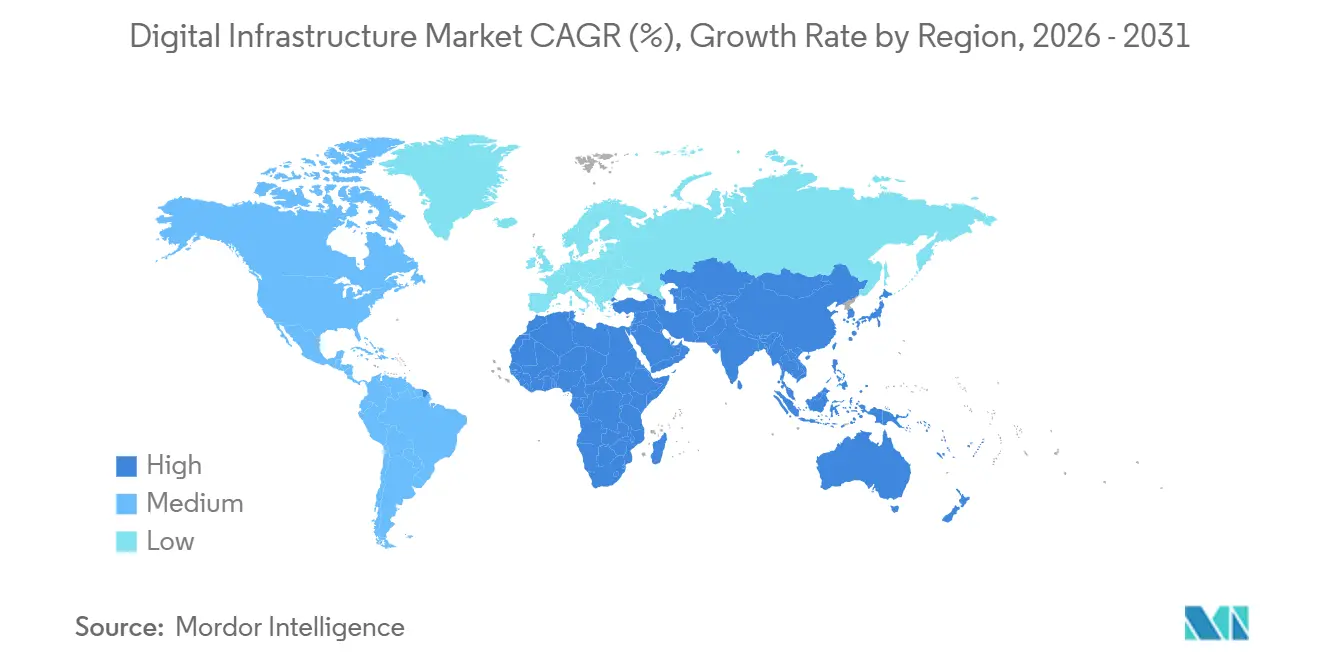
| Fastest Growing Market | Middle East |
| Largest Market | North America |
| Market Concentration | Medium |
Major Players *Disclaimer: Major Players sorted in no particular order Image © Mordor Intelligence. Reuse requires attribution under CC BY 4.0. | |
Digital Infrastructure Market Analysis by Mordor Intelligence
The digital infrastructure market size is projected to be USD 0.36 trillion in 2025, USD 0.43 billion in 2026, and reach USD 1.08 trillion by 2031, growing at a CAGR of 20.05% from 2026 to 2031. Hyperscale operators accelerated capital outlays yet encountered tightening grid capacity, encouraging modular micro-data-center roll-outs that shorten deployment cycles. Sovereign-cloud mandates in Europe, India, and the Middle East continue to steer location decisions toward domestically controlled facilities, while custom silicon cuts both cost and energy per AI task, widening performance gaps between vertically integrated hyperscalers and general-purpose colocation providers. Power-efficient liquid-cooling systems, two-phase immersion designs, and renewable-energy purchase agreements are becoming prerequisites for capacity approvals. Together, these forces are redrawing value pools toward edge nodes, sovereign regions, and specialized compute layers inside the digital infrastructure market.
Key Report Takeaways
- By deployment model, colocation led with 36.21% of the digital infrastructure market share in 2025, while edge and far-edge installations advance at a 23.70% CAGR through 2031.
- By enterprise size, large enterprises accounted for 58.11% of 2025 spending, whereas SMEs are projected to expand at a 21.40% CAGR to 2031.
- By infrastructure layer, AI accelerators and specialized chips register the fastest growth at a 29.40% CAGR between 2026-2031.
- By end-user vertical, IT and telecom captured 24.34% of 2025 revenue, and manufacturing and industrial workloads are on course for a 29.35% CAGR through 2031.
- By geography, North America commanded 38.14% of 2025 revenue; the Middle East is forecast to post a 28.81% CAGR over 2026-2031.
Note: Market size and forecast figures in this report are generated using Mordor Intelligence’s proprietary estimation framework, updated with the latest available data and insights as of January 2026.
Global Digital Infrastructure Market Trends and Insights
Drivers Impact Analysis*
| Driver | (~) % Impact on CAGR Forecast | Geographic Relevance | Impact Timeline |
|---|---|---|---|
| Proliferation of hyperscale and edge data centers | +4.2% | North America, Asia Pacific, Middle East | Medium term (2-4 years) |
| Accelerating cloud and hybrid adoption across verticals | +3.8% | North America and Europe | Short term (≤2 years) |
| 5G and fiber roll-out boosting bandwidth demand | +2.9% | Asia Pacific core, spill-over to Middle East and Africa | Medium term (2-4 years) |
| Surge in AI/ML workloads demanding specialized compute | +5.1% | North America, Asia Pacific | Short term (≤2 years) |
| Grid-constrained regions fast-tracking modular micro-DCs | +2.3% | Europe, Asia Pacific, North America | Short term (≤2 years) |
| Sovereign-cloud mandates driving localized build-outs | +3.2% | Europe, Middle East, India, South America | Long term (≥4 years) |
| Source: Mordor Intelligence | |||
Surge In AI/ML Workloads Demanding Specialized Compute
In 2025, the surge in AI model sizes led to a significant increase in the number of GPUs used per training run, resulting in compute bills soaring into the nine-figure range.[1]OpenAI, “Trends in Model Training Compute,” openai.com This rapid escalation in computational demands has placed immense pressure on infrastructure costs and resource availability. In response, hyperscalers turned to custom silicon solutions to address these challenges: Google’s TPU v5p boasts a 2.8-fold improvement in training throughput over its predecessor, TPU v4, all while achieving a 40% reduction in energy consumption. This advancement not only enhances efficiency but also contributes to more sustainable operations by reducing energy usage. Meanwhile, AWS's Trainium2 not only slashes training costs by 30% but also delivers a fourfold boost in inference performance compared to its inaugural generation, showcasing significant progress in performance optimization. These advancements in chip technology not only reduce reliance on the limited GPU supply but also decrease the overall cost of ownership, positioning specialized accelerators at the forefront of the evolving infrastructure economics. As a result, these custom silicon solutions are becoming critical components in addressing the growing demands of AI workloads while ensuring cost-effectiveness and scalability for next-generation infrastructure.
Proliferation Of Hyperscale And Edge Data Centers
By the end of 2025, operators had activated 1,297 hyperscale sites and had another 770 under construction, marking a significant 59% increase in their pipeline compared to 2023. These capacities are being strategically divided between 100-MW campuses located in cost-effective power hubs and sub-5-MW edge nodes situated within 20 km of end-users to ensure optimal performance and efficiency. In 2025, both Verizon and AT&T launched over 200 multi-access edge locations, effectively capitalizing on the immense potential of 5G network slicing to enhance their service offerings.[2]Verizon Communications, “Multi-Access Edge Expansion,” verizon.com This dual-tier strategy not only optimizes capital expenditure but also strategically allocates edge real estate for latency-sensitive tasks, such as real-time data processing and critical applications, while batch processes and less time-sensitive workloads are efficiently handled at centralized farms. This approach ensures a balanced and cost-effective distribution of resources, catering to the growing demand for high-performance computing and low-latency services.
Accelerating Cloud And Hybrid Adoption Across Verticals
In a 2025 study conducted by Deloitte, 87% of enterprises indicated their plans to deploy new AI workloads in public clouds, highlighting the growing reliance on cloud-based solutions for advanced technologies. However, 78% of these enterprises also foresee an increase in edge deployments, reflecting a dual approach to managing workloads. A significant 37% of organizations, influenced by a cost sensitivity of 60-70% on-premise utilization, are repatriating selected applications back to colocation or private sites during the 2024-2025 period. This shift emphasizes the evolving strategies organizations are adopting to balance cost efficiency and operational flexibility. The adoption of hybrid models, while beneficial, introduces additional layers of complexity, particularly in terms of security. Misconfigured federations, for instance, accounted for 34% of cloud incidents in 2024, underscoring the critical need for robust security measures in hybrid environments.
Sovereign-Cloud Mandates Driving Localized Build-Outs
In response to the EU's 2024 sovereign-cloud framework, which mandates member states to host sensitive workloads on infrastructure operated by EU-based entities, AWS has allocated a significant budget of EUR 7.8 billion (USD 8.3 billion) to establish a dedicated and ring-fenced cloud region within Europe.[3]European Commission, “EU Sovereign Cloud Framework,” ec.europa.eu This initiative underscores the growing emphasis on data sovereignty and compliance with regional regulations. Similarly, France has introduced a 2024 decree requiring all public workloads to transition to domestic platforms by 2027. This regulatory push has led to the formation of a joint venture between Thales and Google, designed to ensure that key management and control remain firmly under French jurisdiction. Reflecting this global trend, countries like India and the UAE have implemented comparable regulations, further driving the demand for localized cloud infrastructure and in-country builds to meet these stringent requirements.
Restraints Impact Analysis*
| Restraint | (~) % Impact on CAGR Forecast | Geographic Relevance | Impact Timeline |
|---|---|---|---|
| Escalating energy and water-use constraints | -2.1% | Europe, Asia Pacific, North America | Short term (≤2 years) |
| Data privacy and cross-border compliance complexity | -1.4% | Global, acute in Europe and Asia Pacific | Medium term (2-4 years) |
| Carrier-neutral colocation shortages in secondary cities | -0.9% | North America secondary, Europe Tier 2, emerging Asia Pacific | Medium term (2-4 years) |
| Volatile GPU supply chain and rare-earth dependency | -1.2% | Global, acute in North America and Asia Pacific | Short term (≤2 years) |
| Source: Mordor Intelligence | |||
Escalating Energy And Water-Use Constraints
In response to the significant energy consumption by data centers, which accounted for 21% of Ireland's grid load, Dublin implemented a moratorium to address the strain on the energy infrastructure. Singapore, on the other hand, has introduced stringent regulations, allowing only data center builds with a Power Usage Effectiveness (PUE) of less than 1.2, provided they integrate on-site renewable energy sources to enhance sustainability. Meanwhile, Northern Virginia faces challenges with its interconnection queue, which has now extended to an overwhelming 36 months, reflecting the growing demand for data center capacity in the region. As the demand for energy-intensive AI racks continues to rise, operators are increasingly adopting liquid cooling technologies. These advanced cooling solutions not only reduce facility energy consumption by 30-40%, as demonstrated in Microsoft pilot projects, but also achieve a remarkable reduction in water usage by up to 90%, showcasing their potential to improve operational efficiency and environmental sustainability.
Data Privacy And Cross-Border Compliance Complexity
In 2024, GDPR fines reached a staggering EUR 4.3 billion (USD 4.6 billion), marking a significant increase in regulatory enforcement. Among these fines, Meta faced a hefty EUR 1.2 billion penalty for violations related to trans-Atlantic data transfers, highlighting the growing scrutiny on global data practices. China's amendments to its 2024 Data Security Law further intensified data governance by broadening the definition of "important data." These changes require foreign cloud service providers to store and process such data domestically, ensuring compliance with national security standards. Echoing these regulatory trends, India introduced similar restrictions in its 2025 legislation, emphasizing the importance of localized data management. As a result of these evolving regulations, enterprises are now allocating an average of USD 2.4 million annually for compliance efforts. This figure is even higher in heavily regulated sectors, where compliance costs can double, reflecting the increasing complexity and financial burden of adhering to stringent data protection laws.
*Our forecasts treat driver/restraint impacts as directional, not additive. The impact forecasts reflect baseline growth, mix effects, and variable interactions.
Segment Analysis
By Deployment Model: Edge Nodes Gain Speed Over Centralized Builds
Edge and far-edge sites are advancing at a 23.70% CAGR, eclipsing overall digital infrastructure market growth as autonomous vehicles, retail analytics, and industrial controls demand sub-10 ms responses. The digital infrastructure market size for colocation accounted for 36.21% revenue in 2025, a figure under pressure as hyperscalers package comparable cages at discounted rates. Enterprises now orchestrate workloads across on-premise, public cloud, and edge footprints, relying on Kubernetes and service meshes to maintain portability.
Repatriation trends reflect cost-elasticity thresholds: once steady-state cloud utilization tops 70%, CFOs often shift predictable loads back to colocation for 20-30% savings. Micro data centers under 100 kW flourish inside retail stores and branch offices, while 1-5 MW regional edge hubs aggregate demand for multiple tenants. This twin-layer approach keeps latency-intolerant inference close to users and funnels batch tasks to cheaper megawatt campuses.


By Infrastructure Layer: Custom Silicon Restructures Compute Economics
AI accelerators exhibit the fastest trajectory at 29.40% CAGR. Their share of the digital infrastructure market size is climbing as hyperscalers tailor chips to specific workloads and bypass GPU shortages. TPU v5p, Trainium2, and Maia 100 exemplify silicon that improves performance-per-watt and eases supply constraints.
Traditional facility spending remains sizable, but permitting delays and grid caps temper growth. Liquid-cooling investments are rising because rack densities exceed 100 kW for AI clusters. Network backbones upgrade to 800 Gb Ethernet to relieve east-west congestion, led by Arista’s 51.2 Tbps switches. Management software gains strategic weight as operators must automate placement across sovereign, public, and edge pools.
By Enterprise Size: SME Cloud-First Strategies Narrow Capability Gaps
Large enterprises still contributed 58.11% of 2025 revenue, yet SME spending is expanding 21.40% annually, narrowing the digital divide. Consumption-based serverless compute and vertical SaaS strip away capex and specialist-staff requirements, allowing firms with under 500 employees to run advanced analytics on pay-per-invocation pricing.
SMEs increasingly bypass on-premise hardware entirely, while regulated incumbents sustain hybrid stacks to retain privileged data internally. Generative-AI copilots accelerate software output for constrained teams, enlarging the potential buyer pool for platform vendors. For large enterprises, cloud growth tilts toward optimization rather than green-field expansion, placing margin focus on observability, governance, and cost-control suites.

By End-User Vertical: Manufacturing Accelerates Industry 4.0 Roll-Outs
Manufacturing infrastructure spending is projected to climb at a 29.35% CAGR, topping all verticals, as digital-twin synchronization and predictive maintenance require deterministic low latency. The digital infrastructure market share remains highest in IT and telecom at 24.34% thanks to 5G core disaggregation and multi-access edge adoption among mobile carriers.
Banking and healthcare adopt hybrid clouds to square regulatory data-residency with analytic scale. Retail chains lean on edge compute for inventory accuracy, while government and defense contracts stipulate classified-grade sovereign regions. Energy, media, and emerging sectors such as agriculture round out demand, each with distinct latency, compliance, and resilience profiles that favor diversified deployment mixes.
Geography Analysis
North America led with 38.14% of 2025 revenue. Virginia alone has 1.3 GW contracted, yet grid bottlenecks stretch interconnect queues, pushing developers toward Texas and Pacific Northwest renewable corridors. Canada’s hydro-rich Quebec offers cents-per-kilowatt pricing attractive to batch compute, and Mexico’s nearshoring wave fuels new builds in Querétaro that sync manufacturing systems with U.S. cloud zones.
The Middle East shows the fastest momentum at a 28.81% CAGR, underpinned by the UAE’s USD 2 billion Khazna program and Saudi Arabia’s USD 40 billion Vision 2030 cloud fund. Cheap natural gas and ambitious zero-carbon zones position the region as a sovereign hub serving cross-border workloads that struggle with European or U.S. legal exposure. Asia Pacific’s picture splits among mature hyperscale hubs, stringent efficiency mandates, and rising edge demand. China caps PUE at 1.3 for new facilities, driving immersion-cooling adoption, while India’s incentive scheme encourages domestic server assembly and cuts import duties by 20%. Japan and South Korea secure redundancy against earthquakes and drive early edge trials for AR commerce. Australia counters long-haul cable latency by retaining workloads onshore.
Europe’s growth hinges on data-residency compliance. Germany and the UK anchor demand but wrestle with power-permit delays and renewable quotas. Sovereign builds multiply: Google’s German-staffed region came online in 2025 for EU-restricted workloads. Southern European markets exploit solar abundance and free cooling to lure secondary campus investments. Africa and South America remain supply-constrained yet strategic. South Africa hosts 60% of the continent’s capacity, while Nigeria and Kenya scale modular deployments despite grid instability. Brazil dominates South America via São Paulo and Rio clusters enforced by local-data laws, whereas Chile and Colombia seek foreign direct investment to overcome seismic and connectivity hurdles.

Competitive Landscape
In 2025, the top five hyperscalers secured roughly 65% of the public cloud IaaS revenue, indicating a moderately concentrated digital infrastructure market. The dominant strategy is vertical integration. AWS, Microsoft, and Google are rolling out proprietary accelerators and advanced cooling systems, aiming to streamline unit economics and buffer against supply shocks. These advancements are designed to enhance operational efficiency and ensure resilience in the face of fluctuating supply chain dynamics. In response, colocation giants are broadening their interconnection networks and venturing into underserved regions, with Equinix's USD 3.9 billion acquisition spree in Africa serving as a prime example of strategic expansion to capture emerging opportunities.
Speed is the name of the game for disruptors: CoreWeave is pouring resources into 48-hour GPU-centric setups, luring AI startups eager for capacity. This rapid deployment capability is critical for startups that require immediate access to high-performance computing resources to accelerate their development cycles. Meanwhile, Crusoe Energy is turning stranded flare gas into computing power, significantly reducing electricity costs in remote areas. This innovative approach not only addresses environmental concerns but also provides a cost-effective solution for powering data centers in isolated locations. The spotlight of innovation is now on thermal management, software-driven power distribution, and security solutions that encompass sovereign, public, and edge resources. Notably, patent applications in these areas surged by 23% from 2024 to 2025, reflecting the growing emphasis on technological advancements to meet evolving market demands.
As the digital infrastructure market evolves, partnerships and collaborations are becoming critical for growth. Hyperscalers and colocation providers are increasingly working together to address the rising demand for hybrid cloud solutions. This trend is expected to drive further advancements in interconnection capabilities and foster innovation in areas such as workload optimization and data sovereignty. By leveraging each other's strengths, these collaborations aim to create more robust and flexible infrastructure solutions that cater to the diverse needs of enterprises across various industries. The focus on hybrid cloud solutions also underscores the importance of balancing scalability, security, and compliance in an increasingly complex digital landscape.
Digital Infrastructure Industry Leaders
Amazon Web Services
Microsoft Corporation
Google Cloud Platform
Alibaba Cloud
Huawei Cloud & Infrastructure
- *Disclaimer: Major Players sorted in no particular order


Recent Industry Developments
- January 2026: Microsoft deployed two-phase immersion cooling across 25% of new capacity, reducing water use 90% and enabling 100 kW rack densities.
- December 2025: AWS released Trainium2 chips that lower AI training cost 30% and quadruple inference performance, first rolling out in Ohio and Oregon regions.
- November 2025: Equinix closed a USD 3.9 billion purchase of Teraco, MainOne, and West African Cable System, adding 15 African facilities.
- October 2025: Google Cloud activated its first sovereign region in Germany operated solely by EU residents.


Global Digital Infrastructure Market Report Scope
Digital infrastructure, encompassing data centers, cloud systems, networking tools, and telecom technologies, underpins the delivery of digital services.
The study tracks the revenue accrued through the sale of the digital infrastructure market by various players across the globe. it also tracks the key market parameters, underlying growth influencers, and major vendors operating in the industry, which supports the market estimations and growth rates over the forecast period. The study further analyses the overall impact of COVID-19 aftereffects and other macroeconomic factors on the market. The report’s scope encompasses market sizing and forecasts for the various market segments.
The Digital Infrastructure Market Report is Segmented by Deployment Model (On-Premise, Colocation, Public Cloud IaaS, Hybrid/Multi-Cloud, and Edge/Far-Edge), Infrastructure Layer (Facilities, Network, Compute, AI Accelerators, Software, and More), Enterprise Size (SMEs, and Large), End-User (IT and Telecom, BFSI, Retail, Manufacturing, Healthcare, Government, Energy, and More), and Geography. Market Forecasts are in Value (USD).
| On-Premise |
| Colocation |
| Public Cloud IaaS |
| Hybrid / Multi-Cloud |
| Edge / Far-Edge |
| Data Center Facilities |
| Network Connectivity (Fiber, 5G, Satellite) |
| Cloud Compute and Storage |
| AI Accelerators and Specialized Chips |
| Infrastructure Software and Management |
| Others, Infrastructure Layer |
| Small and Medium Enterprises (SMEs) |
| Large Enterprises |
| IT and Telecom |
| BFSI |
| Retail and E-commerce |
| Manufacturing and Industrial |
| Healthcare and Life Sciences |
| Government and Defense |
| Energy and Utilities |
| Media and Entertainment |
| Others, End-User Vertical |
| North America | United States | |
| Canada | ||
| Mexico | ||
| South America | Brazil | |
| Argentina | ||
| Rest of South America | ||
| Europe | Germany | |
| United Kingdom | ||
| France | ||
| Italy | ||
| Spain | ||
| Rest of Europe | ||
| Asia Pacific | China | |
| Japan | ||
| South Korea | ||
| India | ||
| Australia | ||
| New Zealand | ||
| Rest of Asia-Pacific | ||
| Middle East and Africa | Middle East | United Arab Emirates |
| Saudi Arabia | ||
| Turkey | ||
| Rest of Middle East | ||
| Africa | South Africa | |
| Nigeria | ||
| Kenya | ||
| Rest of Africa | ||
| By Deployment Model | On-Premise | ||
| Colocation | |||
| Public Cloud IaaS | |||
| Hybrid / Multi-Cloud | |||
| Edge / Far-Edge | |||
| By Infrastructure Layer | Data Center Facilities | ||
| Network Connectivity (Fiber, 5G, Satellite) | |||
| Cloud Compute and Storage | |||
| AI Accelerators and Specialized Chips | |||
| Infrastructure Software and Management | |||
| Others, Infrastructure Layer | |||
| By Enterprise Size | Small and Medium Enterprises (SMEs) | ||
| Large Enterprises | |||
| By End-User Vertical | IT and Telecom | ||
| BFSI | |||
| Retail and E-commerce | |||
| Manufacturing and Industrial | |||
| Healthcare and Life Sciences | |||
| Government and Defense | |||
| Energy and Utilities | |||
| Media and Entertainment | |||
| Others, End-User Vertical | |||
| By Geography | North America | United States | |
| Canada | |||
| Mexico | |||
| South America | Brazil | ||
| Argentina | |||
| Rest of South America | |||
| Europe | Germany | ||
| United Kingdom | |||
| France | |||
| Italy | |||
| Spain | |||
| Rest of Europe | |||
| Asia Pacific | China | ||
| Japan | |||
| South Korea | |||
| India | |||
| Australia | |||
| New Zealand | |||
| Rest of Asia-Pacific | |||
| Middle East and Africa | Middle East | United Arab Emirates | |
| Saudi Arabia | |||
| Turkey | |||
| Rest of Middle East | |||
| Africa | South Africa | ||
| Nigeria | |||
| Kenya | |||
| Rest of Africa | |||


Key Questions Answered in the Report
How fast is hyperscale capex growing in the digital infrastructure market?
Hyperscale operators committed more than USD 215 billion during 2025, reflecting sustained double-digit annual expansion.
Which deployment model is expanding quickest?
Edge and far-edge installations are forecast to grow at a 23.70% CAGR through 2031, outpacing centralized builds.
What segment shows the highest digital infrastructure market size growth from new technology?
AI accelerators and specialized chips are expected to post a 29.40% CAGR between 2026-2031 as custom silicon adoption accelerates.
What restraint most threatens near-term capacity additions?
Escalating energy and water constraints, particularly in Dublin, Singapore, and Northern Virginia, already delay new interconnections and limit site approvals.
Page last updated on:


