Space Technology Market Size and Share
Market Overview
| Study Period | 2020 - 2031 |
|---|---|
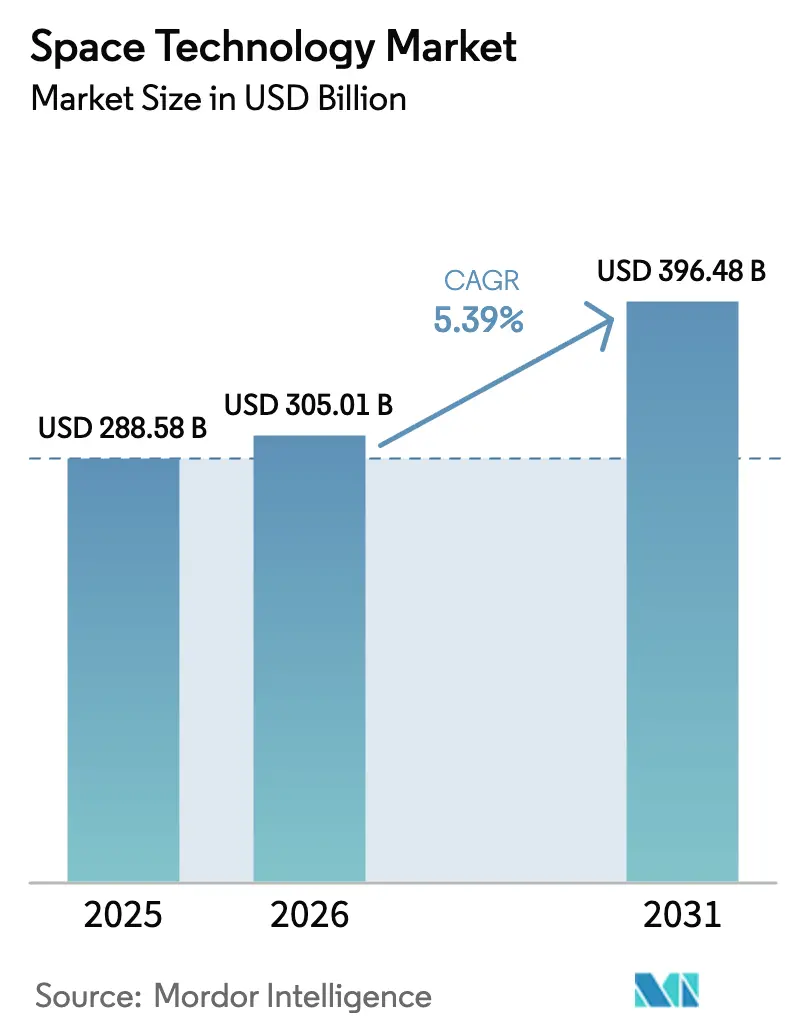
| Market Size (2026) | USD 305.01 Billion |
| Market Size (2031) | USD 396.48 Billion |
| Growth Rate (2025 - 2030) | 5.39% CAGR |
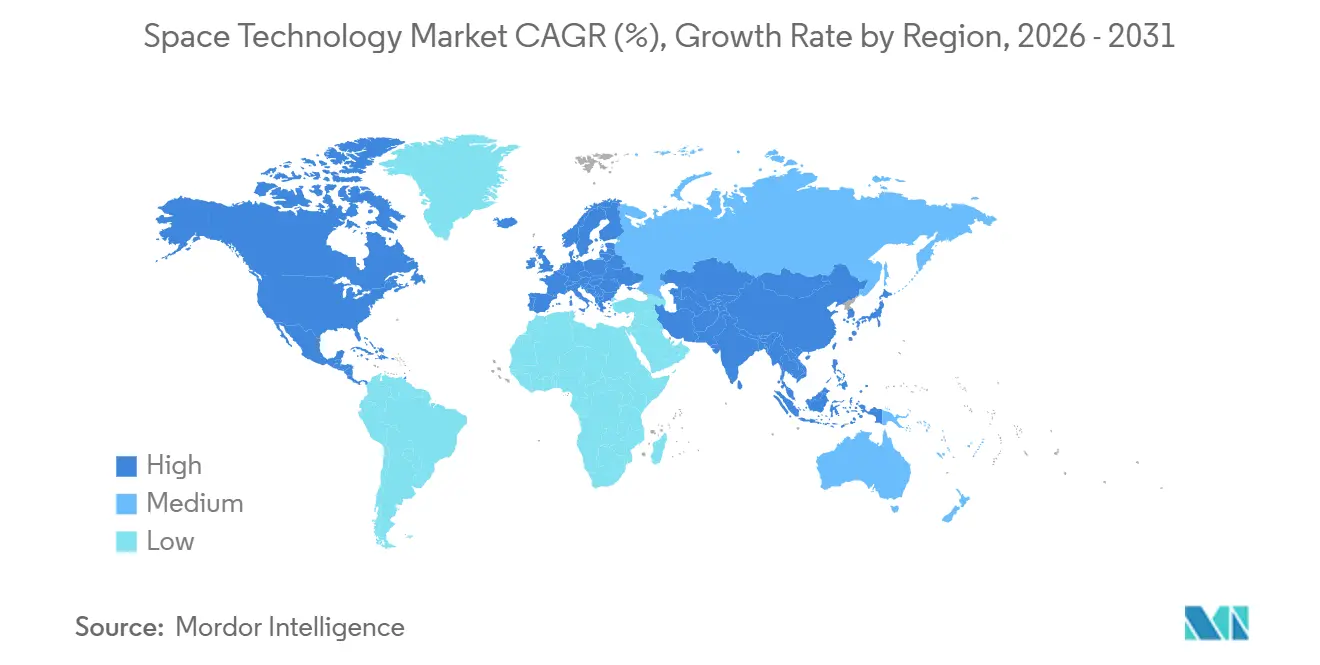
| Fastest Growing Market | Asia Pacific |
| Largest Market | North America |
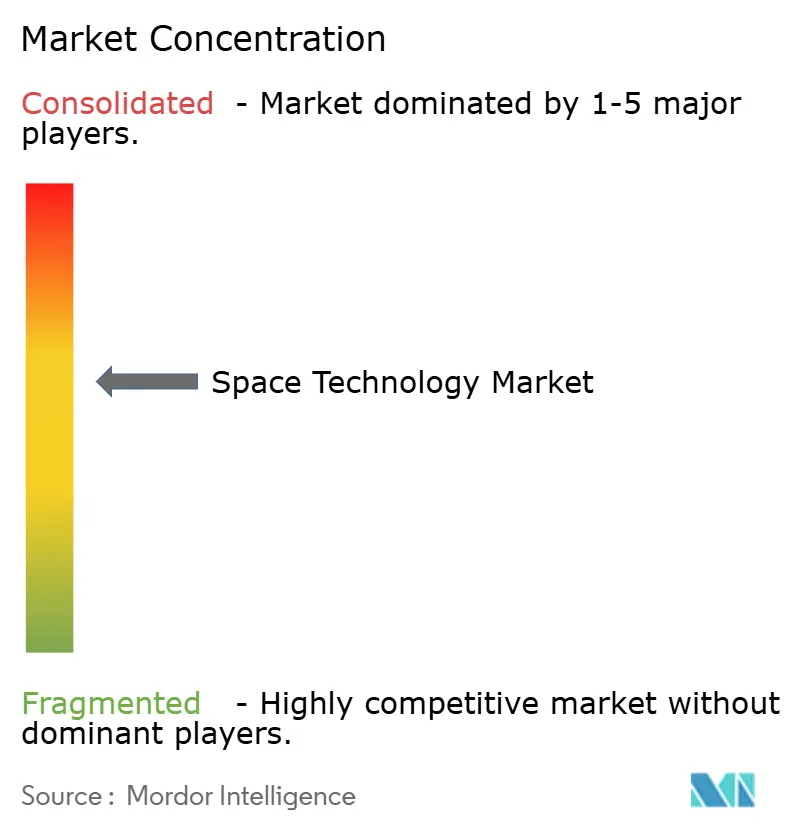
| Market Concentration | Medium |
Major Players *Disclaimer: Major Players sorted in no particular order Image © Mordor Intelligence. Reuse requires attribution under CC BY 4.0. | |
Space Technology Market Analysis by Mordor Intelligence
The space technology market size is projected to expand from USD 288.58 billion in 2025 and USD 305.01 billion in 2026 to USD 396.48 billion by 2031, registering a CAGR of 5.39% between 2026 and 2031. Commercial operators are reshaping what was once a government-centric domain, channelling private capital toward low Earth orbit (LEO) broadband constellations, in-orbit servicing, and space tourism. Reusable launch systems are compressing per-kilogram pricing, software-defined satellites are displacing fixed payloads, and national-security buyers are procuring resilient proliferated constellations instead of a handful of exquisite craft. Operators that align capital spending with these shifts are finding new revenue streams even as regulatory oversight around debris mitigation, export controls, and launch licensing tightens.
Key Report Takeaways
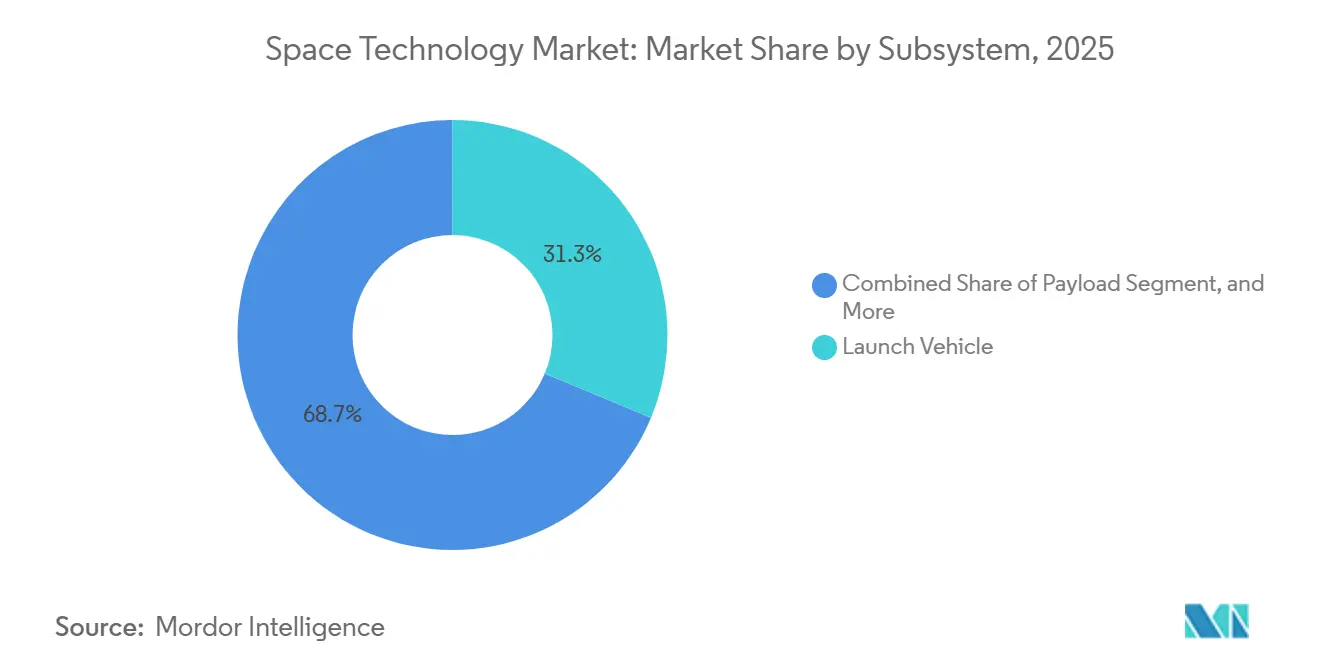
- By subsystem, launch vehicle hardware led with 31.28% of 2025 revenue, while payload equipment is advancing at a 6.17% CAGR through 2031.
- By end-use, commercial entities held 46.48% of 2025 revenue and are expanding at a 6.06% CAGR to 2031.
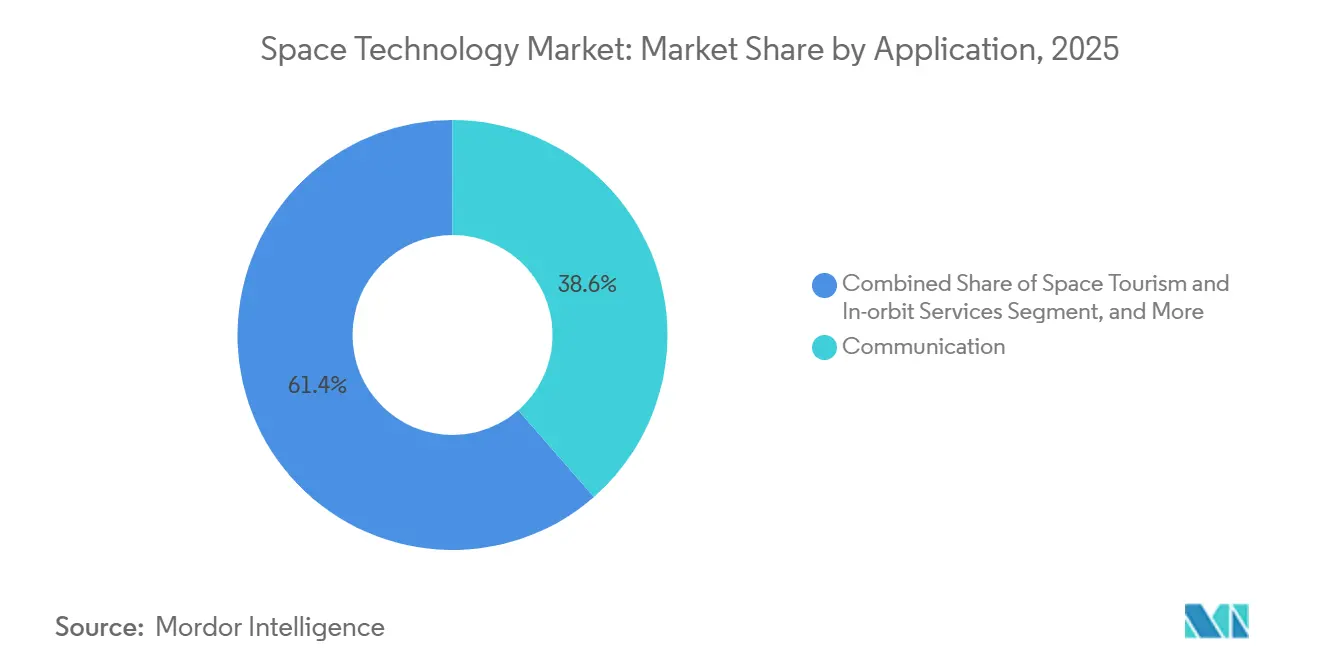
- By application, communication retained 38.57% revenue share in 2025, yet space tourism and in-orbit services post the fastest growth at 5.96% through 2031.
- By orbit type, LEO platforms captured 55.06% of 2025 activity and are rising at a 5.91% CAGR to 2031.
- By geography, North America commanded 40.12% of 2025 revenue, whereas Asia-Pacific shows the quickest advance at 6.29% through 2031.
Note: Market size and forecast figures in this report are generated using Mordor Intelligence’s proprietary estimation framework, updated with the latest available data and insights as of January 2026.
Global Space Technology Market Trends and Insights
Drivers Impact Analysis*
| Driver | (~) % Impact on CAGR Forecast | Geographic Relevance | Impact Timeline |
|---|---|---|---|
| Rapidly Falling Launch Costs via Reusable Vehicles | +1.20% | Global, led by North America and Asia-Pacific | Short term (≤ 2 years) |
| Rising Government Investments in Space Programs | +1.00% | Global, concentrated in North America, Europe, Asia-Pacific | Medium term (2-4 years) |
| Miniaturization Enabling Affordable Satellite Constellations | +0.90% | Global, strongest in North America and Asia-Pacific | Medium term (2-4 years) |
| National-Security Focus on Resilient Space Architectures | +0.70% | North America, Europe, Asia-Pacific | Long term (≥ 4 years) |
| Growing Demand for High-Throughput Satellite Broadband | +0.60% | Global, rural and underserved regions | Medium term (2-4 years) |
| Commercialization of Space Tourism and In-Orbit Services | +0.40% | North America, Middle East, select Asia-Pacific markets | Long term (≥ 4 years) |
| Source: Mordor Intelligence | |||
Rapidly Falling Launch Costs Via Reusable Vehicles
Falcon 9 first stages completed 23 reflights in 2025, lowering marginal launch prices to roughly USD 28 million per mission and proving that hardware can survive repeated entry and landing cycles without major refurbishment.[1]Gwynne Shotwell, “Falcon 9 Reuse Milestones,” SpaceX, spacex.com Rocket Lab introduced helicopter-assisted booster recovery in 2024, cutting refurbishment time below 30 days and giving small-satellite operators the cadence they need.[2]Peter Beck, “Recovering Electron Boosters,” Rocket Lab, rocketlabusa.com Blue Origin’s New Glenn, awarded seven national-security launches, is designed for 25 flights and targets sub-USD 50 million pricing per heavy mission. Cost compression frees capital for satellite replenishment, making frequent refresh cycles economical and shortening design-to-orbit timelines.
Rising Government Investments in Space Programs
NASA’s FY 2026 appropriation rose 7% to USD 27.2 billion, funding Artemis lunar logistics, earth-science missions, and commercial crew contracts.[3]NASA Budget Office, “FY 2026 Request,” NASA, nasa.gov The European Space Agency (ESA) secured a 17% uplift to EUR 17.5 billion (USD 19.8 billion) through 2027, ring-fencing funds for Ariane 6 flights, the IRIS² secure-communications constellation, and zero-debris initiatives. India boosted its Department of Space budget 12% to INR 130 billion (USD 1.56 billion) to finance the Gaganyaan crewed flight and open launch licenses to private firms. State spending is no longer solely science-driven; it now anchors commercial broadband, climate monitoring, and defense-grade surveillance.
Miniaturization Enabling Affordable Satellite Constellations
Component downsizing lets operators squeeze multifunction payloads into sub-500 kg buses. Planet Labs flies more than 200 five-kilogram imagers that deliver daily global coverage for agriculture and insurance clients. Software-defined radios enable one spacecraft to beam across multiple bands without new hardware, shortening development cycles. Optical inter-satellite links fielded on Starlink Gen2 relay traffic through space, trimming latency and shielding data from ground-based jamming. CubeSat kits priced under USD 100,000 are within reach of universities and startups, widening participation but compounding congestion in popular LEO lanes.
National-Security Focus on Resilient Space Architectures
The U.S. Space Force Commercial Space Strategy directs procurement toward proliferated constellations that spread capability across hundreds of units, denying adversaries single shot kill options. Europe is mirroring the approach with the IRIS² program that will deploy secure regional coverage independent of non-European providers. Asia-Pacific defense agencies are funding sovereign tracking and reconnaissance networks to complement imported services, raising baseline demand for launch, payload, and data-analytics contracts.
Restraints Impact Analysis*
| Restraint | (~) % Impact on CAGR Forecast | Geographic Relevance | Impact Timeline |
|---|---|---|---|
| Orbital Debris, Congestion, and Space-Traffic Management Gaps | -0.80% | Global, acute in LEO congested orbits | Short term (≤ 2 years) |
| High Up-Front CAPEX and RandD Expenditure | -0.60% | Global, pronounced in North America and Europe | Medium term (2-4 years) |
| Regulatory Bottlenecks and ITAR Export Controls | -0.40% | North America, Europe, allied markets | Medium term (2-4 years) |
| Limited Launch Window and Pad Capacity | -0.30% | North America, Europe, Asia-Pacific | Short term (≤ 2 years) |
| Source: Mordor Intelligence | |||
Orbital Debris, Congestion, And Space-Traffic Management Gaps
The FCC shortened permissible deorbit time from 25 years to 5 years for U.S.-licensed craft, but enforcement abroad is patchy, leading to asymmetric compliance. ESA’s voluntary Zero Debris Charter seeks debris-neutral missions by 2030, yet funding for active removal remains uncertain. Astroscale’s COSMIC mission will attempt magnetic docking and controlled re-entry in 2026; success could set cost benchmarks for compulsory cleanup. Operators report rising avoidance manoeuvres in sun-synchronous bands, burning propellant and shortening service life.
High Up-Front CAPEX And R&D Expenditure
A single GEO telecom satellite still runs USD 250 million–USD 400 million, and a broadband LEO network demands billions before revenue flows. Private investment climbed to USD 12.5 billion in 2023 but skewed toward late-stage firms, leaving pioneers to rely on government grants or patient family offices. Blue Origin has spent roughly USD 2.5 billion on New Glenn without yet flying a revenue mission. Long certification cycles in propulsion and thermal management extend break-even horizons and discourage newcomers.
*Our forecasts treat driver/restraint impacts as directional, not additive. The impact forecasts reflect baseline growth, mix effects, and variable interactions.
Segment Analysis
By Subsystem: Payload Upgrades Accelerate Commercial Flexibility
Payload equipment is on track to outgrow every other subsystem at a 6.17% CAGR. Operators favour reconfigurable transponders that can shift spectrum or beam patterns in orbit, mitigating market-demand uncertainty and supporting incremental revenue streams. Launch vehicle hardware, despite holding 31.28% of 2025 revenue, faces margin pressure as reusable rockets standardize low pricing. Orbit segment ground networks are pivoting to cloud-hosted antenna-as-a-service, while new spaceports in Scotland and Oman aim to capture regional demand. Software-defined satellites integrate optical links and on-board processing, making them the focal point of capital spending.
The transition boosts the space technology market size for payloads relative to boosters while lifting the space technology market share of firms that supply software-defined electronics. Optical inter-satellite link providers, 3D-printed RF-component manufacturers, and on-board AI-chip designers are scaling to meet order books that stretch into the latter half of the decade.


By End-Use: Commercial Buyers Drive Volume and Innovation
Commercial customers already account for nearly half of market revenue and are growing faster than civil agencies and militaries. Direct-to-device broadband, subscription earth-imaging, and cloud relay services give enterprises predictable recurring income streams, supporting private financing in lieu of single government anchor contracts. Defense agencies remain critical in absolute dollars yet increasingly outsource launches and hosted payloads to commercial providers for schedule certainty.
Consequently, the space technology market size tied to commercial activity is rising faster than government programs, and companies capturing that demand are widening their space technology market share through service bundling launch, satellite, ground segment, and analytics under one contract.
By Application: Communication Mature, Tourism and Servicing Ascend
Communication payloads dominate but face substitution threats from fiber and 5G terrestrial backhaul, pushing GEO operators to adopt in-orbit reconfiguration and high-throughput architectures. Space tourism, restarting suborbital flights in 2026, and in-orbit servicing, validated by mission extension vehicles, open fresh revenue lines. Earth observation continues to fragment into optical, SAR, and thermal niches, each tuned to sector-specific analytics.
These shifts redistribute the space technology market size across emerging verticals while prompting incumbents to defend space technology market share with hybrid business models that couple data delivery with analytic insight or life-extension services.
By Orbit Type: LEO Economics Prevail but MEO And GEO Adapt
LEO remains the growth engine, offering sub-30 ms latency and rapid replacement cycles. MEO systems such as O3b mPOWER serve mobility markets requiring higher throughput per spacecraft, whereas GEO incumbents extend life spans with electric propulsion and shift to software-defined payloads that mimic LEO agility. Very-low Earth orbit projects trade higher drag for even lower latency but require frequent station-keeping.
The outcome is a layered orbital ecosystem in which each altitude addresses distinct latency, coverage, and capacity trade-offs, ensuring the space technology market accommodates multiple architectures instead of a single dominant approach.
Geography Analysis
North America retains leadership on the strength of Pentagon launch contracts, NASA spending, and deep venture pools clustered in California, Colorado, and Florida. Regulatory agencies, notably the FCC and FAA, shape deployment cadences through orbital-debris and launch-safety rules. Canada partners on lunar Gateway modules and invests in SAR constellations, while Mexico advances its first domestically built satellite in collaboration with academic institutions.
Asia-Pacific delivers the highest regional CAGR as India liberalizes commercial launches and China executes the world’s busiest manifest. Japan’s H3 rocket returns to flight with UAE and domestic contracts, South Korea’s Nuri program builds sovereign lift capacity, and Southeast Asian nations fund pad facilities and ground segments. Middle Eastern governments, led by the UAE and Saudi Arabia, inject multi-billion-dollar budgets to diversify economies and cultivate indigenous satellite manufacturing.
Europe’s Ariane 6 restores autonomous heavy-lift capacity, and the forthcoming IRIS² constellation underscores the continent’s push for strategic independence. United Kingdom certification of SaxaVord Spaceport opens polar-orbit opportunities, while ESA’s zero-debris initiatives influence design rules across member states. Africa and South America remain smaller but invest in ground infrastructure and rideshare missions to support agriculture and forestry monitoring.

Competitive Landscape
Launch services display moderate concentration because SpaceX commands around 60% of global missions, but satellite manufacturing, ground networks, and value-added analytics are fragmented across hundreds of suppliers. Reusability, vertical integration, and software-defined payloads form the dominant competitive levers.
United Launch Alliance swaps expendable Delta IV Heavy for partially reusable Vulcan Centaur, Blue Origin invests in 25-flight New Glenn hardware, and Amazon builds a vertically integrated Kuiper ecosystem. Small-launch disruptors chase dedicated sub-ton cargo, though profitability hinges on higher flight cadence.
Consolidation accelerates as cash-strapped firms merge to pair manufacturing, launch, and analytics. Early adopters of debris-mitigation hardware secure regulatory goodwill and orbital slots, creating a compliance moat. Intellectual-property filings concentrate in propulsion, autonomy, and optical comms, signalling where future value will accrue.
Space Technology Industry Leaders
Space Exploration Technologies Corp. (SpaceX)
Airbus SE
Boeing Company
Lockheed Martin Corporation
Northrop Grumman Corporation
- *Disclaimer: Major Players sorted in no particular order

Recent Industry Developments
- June 2025: SES obtained unconditional EU approval for its USD 3.1 billion acquisition of Intelsat, reinforcing Europe’s competitive position against LEO broadband entrants.
- April 2025: Amazon’s Project Kuiper lofted its first operational satellites, initiating deployment of a 3,232-spacecraft constellation for global broadband reach.
- March 2025: Rocket Lab announced its intent to acquire Mynaric, integrating laser-communications payloads into its Photon platform to provide turnkey constellations.
- March 2025: NASA selected SpaceX Starship under its Launch Services II contract, validating the super-heavy vehicle for government science missions.


Research Methodology Framework and Report Scope
Market Definitions and Key Coverage
Our study defines the space technology market as the aggregated value generated by designing, manufacturing, launching, and operating spacecraft, launch vehicles, and their on-board payloads that function beyond Earth's atmosphere for communication, navigation, earth observation, exploration, and nascent tourism services. According to Mordor Intelligence, the market stood at USD 290.45 billion in 2025 and should reach USD 392.73 billion by 2030.
(Scope exclusion) Revenues from consumer satellite dishes, television subscriptions, and purely terrestrial defense systems are excluded.
Segmentation Overview
- By Subsystem
- Orbit Segment
- Launch Platform
- Launch Vehicle
- Payload
- By End-Use
- Civil (Government Space Agencies)
- Commercial
- Military and Intelligence
- By Application
- Communication
- Earth Observation
- Navigation and Positioning
- Space Exploration / Science Missions
- Space Tourism and In-Orbit Services
- By Orbit Type
- Low Earth Orbit (LEO)
- Medium Earth Orbit (MEO)
- Geostationary Orbit (GEO)
- Highly Elliptical and Beyond GEO
- By Geography
- North America
- United States
- Canada
- Mexico
- South America
- Brazil
- Argentina
- Rest of South America
- Europe
- United Kingdom
- Germany
- France
- Italy
- Spain
- Nordics
- Rest of Europe
- Middle East
- Saudi Arabia
- United Arab Emirates
- Turkey
- Rest of Middle East
- Africa
- South Africa
- Egypt
- Nigeria
- Rest of Africa
- Asia-Pacific
- China
- India
- Japan
- South Korea
- ASEAN
- Australia
- New Zealand
- Rest of Asia-Pacific
- North America
Detailed Research Methodology and Data Validation
Primary Research
Interviews and structured surveys with launch aggregators, satellite OEM engineers, propulsion start-ups, and procurement officers across North America, Europe, and Asia let us test price curves, payload mix shifts, and utilization rates, filling gaps left by public data before final triangulation.
Desk Research
We began with authoritative public datasets from NASA, ESA, JAXA, and the U.S. Space Force that enumerate annual launch counts, orbital asset inventories, and budget lines. Trade bodies such as the Satellite Industry Association and Euroconsult reviews supplied shipment tallies and typical satellite masses, while customs statistics validated cross-border flows of launch hardware. Company financials from D&B Hoovers and transaction news in Dow Jones Factiva confirmed disclosed launch contracts, and patent analytics from Questel traced propulsion technology adoption timelines. These sources, and many additional open references, anchored our secondary evidence base.
Our team distilled this material into core variables, global successful launches, cost per kilogram to low Earth orbit, and commercial share of manifested payloads, which were then used to challenge every model assumption.
Market-Sizing & Forecasting
A top-down reconstruction starts with recorded launch manifests and public budget appropriations, multiplied by verified average contract values; selective bottom-up checks, supplier roll-ups and sampled ASP x volume, refine totals. Key inputs include annual launch cadence, reusable rocket penetration, median satellite dry mass, propulsion efficiency gains, regulatory fast-track approvals, and announced constellation sizes. Multivariate regression blended with scenario analysis projects demand, linking launch cost decline elasticity to constellation rollouts.
Data Validation & Update Cycle
Outputs pass anomaly screens, senior peer review, and variance checks against indicators like insurance premiums and satellite backlog data. Mordor analysts refresh the model each year and reopen it whenever a material event, such as a prolonged launch failure streak, occurs before dispatch.
Why Mordor's Space Technology Baseline Commands Reliability
Published estimates often diverge because scope definitions, input granularity, currency years, and refresh cadences vary.
Our disciplined, launch-centric scope and dual-path modeling keep divergence modest while preserving transparency. Key gap drivers include whether ground equipment is bundled, how commercial service revenue is imputed, and the point in time when exchange rates are frozen.
Benchmark comparison
| Market Size | Anonymized source | Primary gap driver |
|---|---|---|
| USD 290.45 B (2025) | Mordor Intelligence | - |
| USD 494.3 B (2025) | Global Consultancy A | Bundles ground stations and downstream data services; assumes constant 9 % ASP inflation |
| USD 613 B (2024) | Industry Association B | Adds government R&D budgets plus in-house military salaries; older base year inflates comparison |
Consequently, Mordor's regularly refreshed, variable-driven baseline offers decision-makers a balanced figure that is traceable, reproducible, and free of hidden scope expansions.


Key Questions Answered in the Report
How large is the space technology market in 2026?
The market stands at USD 305.01 billion in 2026 and is projected to reach USD 396.48 billion by 2031.
Which subsystem is growing the fastest through 2031?
Payload equipment leads with a 6.17% CAGR thanks to demand for software-defined and reconfigurable satellites.
Why are commercial customers gaining share?
Direct-to-device broadband, earth-imaging subscriptions, and hosted payloads let enterprises bypass intermediaries, pushing commercial revenue to a 6.06% CAGR.
What is driving launch cost reductions?
Reusable boosters like Falcon 9 and planned New Glenn flights lower marginal prices, enabling constellations to deploy more satellites per dollar spent.
Which region shows the highest growth rate?
Asia-Pacific advances at a 6.29% CAGR as India liberalizes launch licenses and China maintains the worlds busiest launch schedule.
Page last updated on:


