United States Spatial Computing Market Size and Share
Market Overview
| Study Period | 2020 - 2030 |
|---|---|
| Forecast Data Period | 2025 - 2030 |
| Historical Data Period | 2020 - 2023 |
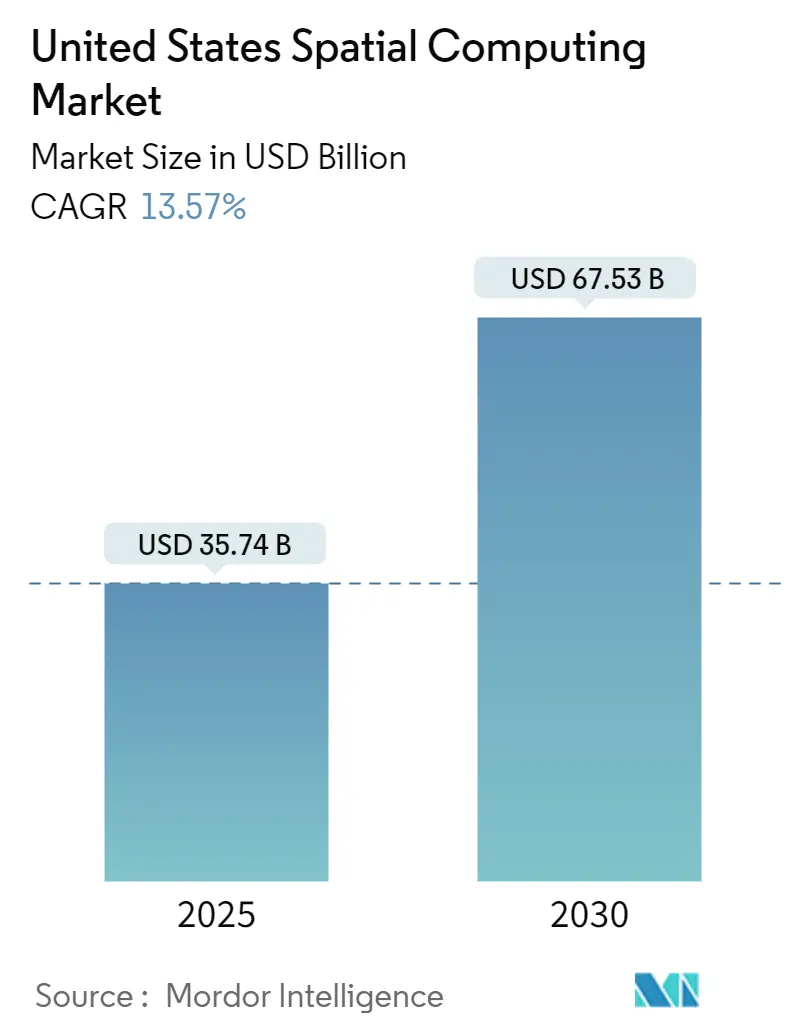
| Market Size (2025) | USD 35.74 Billion |
| Market Size (2030) | USD 67.53 Billion |
| Growth Rate (2025 - 2030) | 13.57% CAGR |
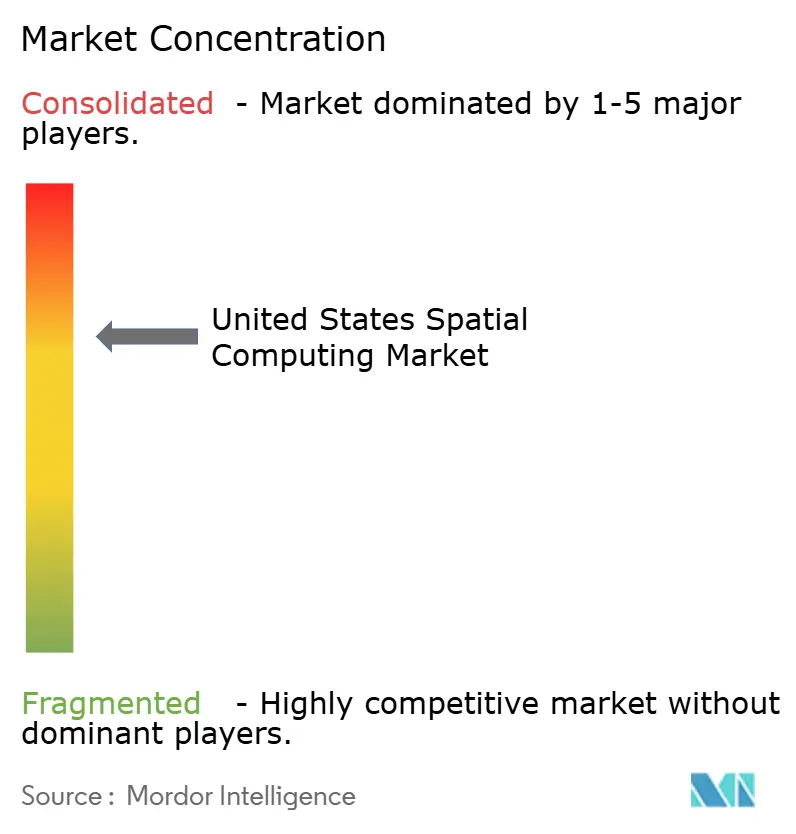
| Market Concentration | Medium |
Major Players *Disclaimer: Major Players sorted in no particular order Image © Mordor Intelligence. Reuse requires attribution under CC BY 4.0. | |
United States Spatial Computing Market Analysis by Mordor Intelligence
The United States spatial computing market size stood at USD 35.74 billion in 2025 and is on course to reach USD 67.53 billion by 2030, translating into a 13.57% CAGR. This growth reflects an enterprise shift toward mixed-reality deployments that tightly link digital twins to physical production lines. Hardware demand remains strong as ruggedized head-mounted displays, solid-state LiDAR, and precision depth cameras become staples on the factory floor. At the same time, service providers that customize applications and integrate edge-rendering pipelines are scaling quickly. Talent shortages in optics engineering and ongoing user-comfort issues tied to vergence-accommodation conflict represent the main brakes on expansion.
Key Report Takeaways
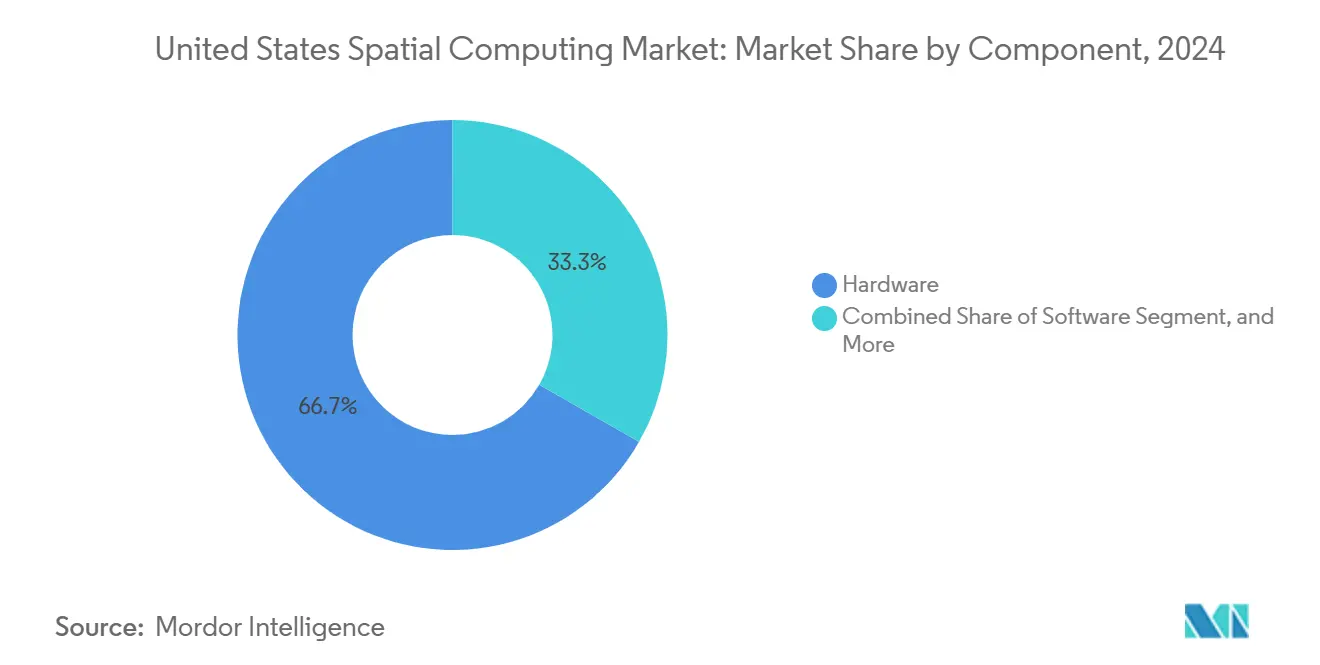
- By component, hardware captured 66.73% of the revenue in 2024, while services are projected to post the fastest growth of 14.11% through 2030.
- By device type, VR headsets led with a 42.37% share of the United States spatial computing market in 2024; AR glasses are forecast to expand at a 13.71% CAGR through 2030.
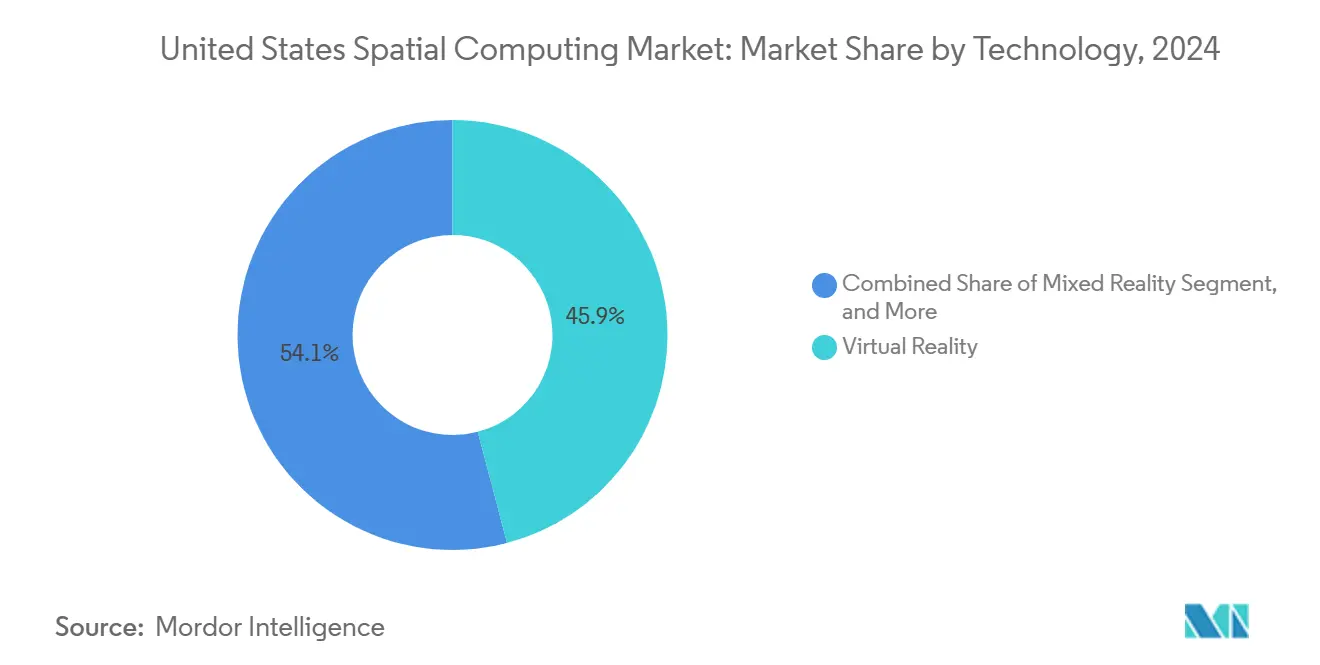
- By technology, virtual reality generated 45.92% of 2024 spending, whereas mixed reality is projected to advance at a 13.67% CAGR through 2030.
- By end-use industry, gaming and entertainment accounted for 38.71% of 2024 revenue; healthcare is expected to grow at a 13.63% CAGR over the same horizon.
- By geography, the West commanded 33.84% of the 2024 value, while the South is projected to clock the highest 13.86% CAGR.
Worldwide, activity is shaped by contributions from multiple countries and regions, with United states representing one among them. The global report on spatial computing market by Mordor Intelligence reflects how these countries and regional layers combine into a single system.
United States Spatial Computing Market Trends and Insights
Drivers Impact Analysis*
| Driver | (~) % Impact on CAGR Forecast | Geographic Relevance | Impact Timeline |
|---|---|---|---|
| Accelerating Adoption of Vision Pro and Next-Gen Head-Mounted Displays | +4.2% | West and Northeast, with enterprise spillover nationally | Medium term (2-4 years) |
| Enterprise Digital Twin Rollouts in Manufacturing Hubs | +3.8% | Midwest and South manufacturing corridors | Long term (≥ 4 years) |
| 5G-Enabled Edge Rendering for Untethered XR Experiences | +3.1% | National, early gains in metro areas | Medium term (2-4 years) |
| Rapid Cost Decline of Solid-State LiDAR and Depth Cameras | +2.9% | Global supply chain benefits, concentrated in West assembly | Short term (≤ 2 years) |
| Government Funding for Workforce Immersive Training Programs | +2.1% | National, defense-focused regions | Long term (≥ 4 years) |
| Growth of Spatial AI SDK Ecosystems Around Unity and Unreal | +1.8% | National developer hubs | Medium term (2-4 years) |
| Source: Mordor Intelligence | |||
Accelerating Adoption of Vision Pro and Next-Gen Head-Mounted Displays
Fortune 100 enterprises adopted Apple Vision Pro at scale in 2024 for surgical rehearsal, design visualization, and secure telepresence, signaling a shift in the United States spatial computing market from consumer novelty toward productivity tooling. Corporate buyers justify premium prices through measurable cycle-time reductions and error-rate declines. Microsoft’s plan to sunset HoloLens 2 by 2027 in favor of cloud-streamed Windows sessions underscores the emergence of distributed compute architectures that relieve headsets of heavy onboard processing. Meta Reality Labs’ double-digit revenue growth and Samsung’s collaboration with Google on Android XR spark competition that speeds component cost erosion and expands app ecosystems.[1]Microsoft Research Team, “HoloLens and Mixed Reality Developments,” MICROSOFT.COM
Enterprise Digital Twin Rollouts in Manufacturing Hubs
Automotive, aerospace, and semiconductor plants across the Midwest and South link persistent 3D twins to shop-floor sensors, cutting unplanned downtime and boosting overall equipment effectiveness. NIST’s digital manufacturing standards provide OEMs with a framework for integrating spatial data into ISO 9001 compliance records, while the Texoma Semiconductor Tech Hub establishes a regional supply web for optics modules.[2]National Institute of Standards and Technology Staff, “Digital Manufacturing Standards,” nist.gov Demand for hybrid skill sets blends classic lean manufacturing know-how with real-time 3D data fluency, widening the service opportunities within the United States spatial computing industry.
5G-Enabled Edge Rendering for Untethered XR Experiences
Nationwide 5G rollouts drop motion-to-photon latency below 20 ms, letting headsets offload 70% of rendering loads to edge servers and thus trim both battery mass and heat rejection. Enterprises pilot field-maintenance workflows where technicians stream dense CAD overlays while roaming without tethers. Location-aware content adjusts on the fly, feeding navigation cues and safety alerts derived from live network telemetry. Telecommunications carriers and platform vendors cooperate on quality-of-service APIs to prioritize mission-critical frames, a prerequisite for scaling the United States spatial computing market beyond high-budget pilots.
Rapid Cost Decline of Solid-State LiDAR and Depth Cameras
Automotive economies of scale are pushing silicon photonics-based LiDAR modules from USD 500-1,000 toward the USD 100 mark, opening mid-market industrial use cases. The solid-state shift enhances durability in vibration-intensive plants, while new depth cameras achieve sub-millimeter accuracy, crucial for robotic surgery and micron-level assembly. Yet the optics labor pipeline lags: only 20 associate programs feed a demand of 2,200 technicians per year, compelling manufacturers to fund apprenticeships that could reinforce long-term growth.
Restraints Impact Analysis*
| Restraint | (~) % Impact on CAGR Forecast | Geographic Relevance | Impact Timeline |
|---|---|---|---|
| Limited Field-of-View and Vergence-Accommodation Conflict | -2.8% | National, higher impact in professional near-work uses | Medium term (2-4 years) |
| Talent Shortage in Advanced Optics and Waveguide Engineering | -1.9% | National, concentrated in manufacturing regions | Long term (≥ 4 years) |
| Privacy Concerns Around Always-On Spatial Mapping | -1.5% | National, with heightened sensitivity in regulated sectors | Medium term (2-4 years) |
| Supply-Chain Bottlenecks in Optics and Photonics Components | -1.2% | West and South assembly hubs tied to global suppliers | Short term (≤ 2 years) |
| Source: Mordor Intelligence | |||
Limited Field-of-View and Vergence-Accommodation Conflict
Current lens stacks trigger a vergence-accommodation conflict that lengthens focus time by up to 499%, hindering tasks that demand fine depth discrimination.[3]Society for Information Display Authors, “Vergence-Accommodation Conflict Increases Time to Focus in Augmented Reality,” sid.org Multifocal prototypes show promise but sap brightness, while shader-based software fixes add GPU overhead. Professionals in CAD, radiology, and avionics cannot compromise on clarity, so adoption slows until suppliers deliver wider fields and dynamic focus mechanisms.
Talent Shortage in Advanced Optics and Waveguide Engineering
Employer requests for optics technicians ballooned from tens to more than 300 in 2025 as firms such as Corning and ASML expanded capacity. The DoD’s USD 34 million AmeriCOM program aims for a 16-fold increase in skilled personnel by 2025, yet academic throughput remains unchanged. The concentration of knowledge inside a handful of coastal labs drives up wages and lengthens hiring cycles, capping device output and delaying large-scale deployments.
*Our forecasts treat driver/restraint impacts as directional, not additive. The impact forecasts reflect baseline growth, mix effects, and variable interactions.
Segment Analysis
By Component: Hardware Dominance Faces Services Disruption
Hardware generated two-thirds of 2024 revenue as enterprises outfitted lines with depth cameras, LiDAR, and thermal-management subsystems engineered for 24-hour duty cycles. The United States spatial computing market size for hardware reached USD 31.4 billion in 2024, and its backlog is expected to extend through 2027 as major OEMs scale up their production. Services, however, are climbing at a 14.11% CAGR as integrators configure edge-render pipelines and train operators. Software sits between the two, supplying cross-platform engines such as Unity PolySpatial that flatten onboarding curves.
Spending dynamics mirror historic IT shifts: once foundational gear is installed, buyers pivot toward maximizing utilization. Vendors now bundle predictive-maintenance subscriptions with head-match calibrations, nudging budgets from capital outlays into operating contracts. Hardware makers respond by embedding self-diagnostics that feed service dashboards, blurring traditional category lines within the United States spatial computing market.


By Device Type: VR Leadership Challenged by AR Emergence
VR headsets held a 42.37% share in 2024, translating into a United States spatial computing market size of roughly USD 20 billion that year. Their dominance owes to compliance-ready training libraries and high-immersion design reviews. Yet AR glasses, clocking 13.71% CAGR, are closing the gap as lighter frames and waveguide optics permit all-day wear in sterile suites and logistics aisles.
Mixed-reality rigs that blend the two paradigms remain costlier but gain favor in complex assembly where workers need full-field context plus digital overlays. Spatial sensors and haptic devices round out the stack, enabling gesture-driven commands and tactile validation. The race to sub-300-gram AR glasses exemplifies the direction of innovation within the United States spatial computing market, as enterprises prioritize comfort during eight-hour shifts.
By Technology: Mixed Reality Gains Ground on VR Dominance
Virtual reality accounted for 45.92% of 2024 spending, but mixed reality is growing fastest at a 13.67% CAGR, as it preserves situational awareness on noisy factory floors. Spatial mapping, computer vision, and AI frameworks enrich overlays with semantics, allowing technicians to query parts or fetch torque specifications by gaze.
The Google-Samsung-Qualcomm alliance added momentum by promising an open Android-XR stack that sidesteps single-vendor lock-in. Concurrently, Niantic’s centimeter-level VPS grants persistent anchoring for multi-user workflows, broadening field-service and logistics scenarios. Each advance compounds the addressable use cases and reinforces the United States spatial computing market as a strategic pillar for digital transformation.
By End-Use Industry: Healthcare Disrupts Gaming Leadership
Entertainment led 2024 revenues at 38.71%, but hospitals, clinics, and med-tech OEMs now pilot 69 FDA-cleared AR and VR tools ranging from phobia therapy to orthopedic templating. The healthcare slice is projected to expand at 13.63% CAGR, underpinned by proven time savings in operating-room rehearsal and lower radiation exposure during guided interventions.
Education, industrial training, defense readiness, retail visualization, and automotive design each carve multimillion-dollar lanes, ensuring the United States spatial computing industry enjoys a diversified demand pool. Hospitals in the Northeast have already logged double-digit reductions in surgical-site errors after adopting AR navigation, a metric likely to accelerate physician advocacy and capital budget allocation.
Geography Analysis
The West region accounted for 33.84% of 2024 revenue, largely due to Silicon Valley’s tight feedback loops among chip design, camera module fabrication, and content studios. Venture funding keeps prototype cycles brisk, while proximity to Pacific factories smooths sourcing. The high cost of living, however, nudges some Series B startups toward Reno and Phoenix, diffusing the United States' spatial computing market’s talent nucleus while sustaining West-led IP origination.
The South is the breakout story, set to log a 13.86% CAGR through 2030. Texas anchors fabs that spit out planar waveguides and ASICs, leveraging tax incentives and shovel-ready land parcels. The Texoma Semiconductor Tech Hub connects photonics majors with community colleges that offer optics curricula, gradually easing the talent bottleneck. Federal broadband grants are funneling fiber to secondary cities, allowing logistics and energy firms to pilot low-latency XR field support without relocating.
Northeast campuses in Boston and New York propel algorithmic breakthroughs and attract defense grants, while Midwest auto giants retrofit stamping lines with XR torque guidance. Despite aging rail spurs and higher energy prices, both regions benefit from mature supply chains. Collectively, they cement the United States spatial computing market as a coast-to-coast endeavor rather than a single-state cluster.
Competitive Landscape
Competition is moderate, with platform giants, optics specialists, and SaaS integrators all vying for share. Apple, Meta, and Microsoft dominate OS layers, while Qualcomm and NVIDIA supply silicon accelerators tuned for spatial workloads. Waveguide optics remain the chokepoint; a handful of patent holders dictate licensing terms, raising barriers for new entrants.
To hedge, hardware OEMs sign multiyear gallium-nitride laser deals and co-locate with glass-etching fabs. Software studios chase vertical niches, for example, FDA-certified surgical planning or OSHA-compliant confined-space simulators. Partnerships trump solo plays: headset makers embed Unity and Unreal runtimes out of the box, and telcos bundle edge instances with low-jitter service-level agreements to secure annuity revenue within the United States spatial computing market.
White-space innovation centers on comfort and optics. Startups address the vergence-accommodation conflict with liquid-lens stacks or multi-plane OLEDs, while AI firms develop real-time foveated rendering that reduces bandwidth needs. The result is a cadence of quarterly spec jumps that test supplier agility and keep price-performance curves steep.
United States Spatial Computing Industry Leaders
Apple Inc.
Microsoft Corporation
Meta Platforms Inc.
Google LLC
Magic Leap Inc.
- *Disclaimer: Major Players sorted in no particular order

Recent Industry Developments
- October 2025: Niantic Spatial and Snap announced a multiyear pact and fresh capital to build a shared AI-powered geospatial map for AR glasses.
- July 2025: The Department of Defense confirmed funding milestones under AmeriCOM aimed at quintupling optics-technician output by year-end 2025.
- January 2025: Argonne National Laboratory released findings showing 23% of local emergency-management agencies now access AI tools, highlighting a budding public-sector route for spatial computing.
- December 2024: Google unveiled the Android XR program with Samsung and Qualcomm to foster cross-platform mixed-reality apps.


United States Spatial Computing Market Report Scope
| Hardware |
| Software |
| Services |
| AR Glasses and Smart Glasses |
| VR Headsets |
| Mixed Reality Headsets |
| Spatial Sensors and Cameras |
| Haptic Devices |
| Augmented Reality |
| Virtual Reality |
| Mixed Reality |
| Spatial Mapping and Navigation |
| Computer Vision and AI |
| Gaming and Entertainment |
| Healthcare |
| Education and Training |
| Industrial and Manufacturing |
| Retail and E-Commerce |
| Defense and Aerospace |
| Architecture and Construction |
| Automotive and Other End-Use Industries |
| By Component | Hardware |
| Software | |
| Services | |
| By Device Type | AR Glasses and Smart Glasses |
| VR Headsets | |
| Mixed Reality Headsets | |
| Spatial Sensors and Cameras | |
| Haptic Devices | |
| By Technology | Augmented Reality |
| Virtual Reality | |
| Mixed Reality | |
| Spatial Mapping and Navigation | |
| Computer Vision and AI | |
| By End-Use Industry | Gaming and Entertainment |
| Healthcare | |
| Education and Training | |
| Industrial and Manufacturing | |
| Retail and E-Commerce | |
| Defense and Aerospace | |
| Architecture and Construction | |
| Automotive and Other End-Use Industries |


Key Questions Answered in the Report
How fast is enterprise adoption of spatial computing growing in the United States?
The United States spatial computing market is expanding at a 13.57% CAGR between 2025 and 2030, driven mainly by manufacturing digital twins and mixed-reality headsets.
Which component of the ecosystem attracts the largest spending today?
Hardware accounts for 66.73% of 2024 revenue, reflecting heavy investment in sensors, displays, and processing units rugged enough for industrial duty.
Will VR remain dominant over AR devices?
VR headsets led with 42.37% share in 2024, but AR glasses are forecast to grow 20.78% annually as lighter frames enable all-day workflows.
Why is healthcare considered the fastest-growing end-user segment?
FDA clearance of 69 AR and VR medical devices has validated efficacy, pushing healthcare spending to a projected 20.59% CAGR through 2030.
Which U.S. regions present the highest growth prospects?
The South is on track for a 13.86% CAGR through 2030, thanks to semiconductor hubs and expanded 5G infrastructure, while the West maintains the largest absolute revenue base.
What are the main technical barriers to wider adoption?
Limited field-of-view and vergence-accommodation conflict hinder user comfort, and a nationwide shortage of optics engineers restrains hardware scaling.
Page last updated on:


