Head-Mounted Display Market Size and Share
Market Overview
| Study Period | 2020 - 2031 |
|---|---|
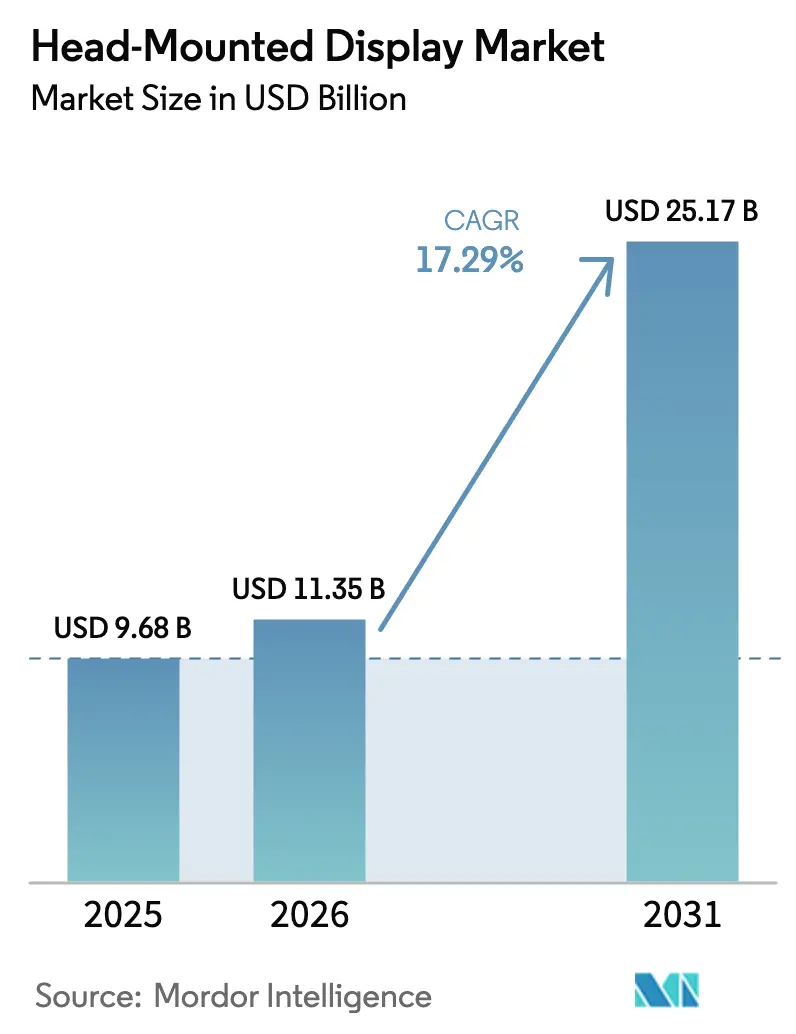
| Market Size (2026) | USD 11.35 Billion |
| Market Size (2031) | USD 25.17 Billion |
| Growth Rate (2026 - 2031) | 17.29% CAGR |
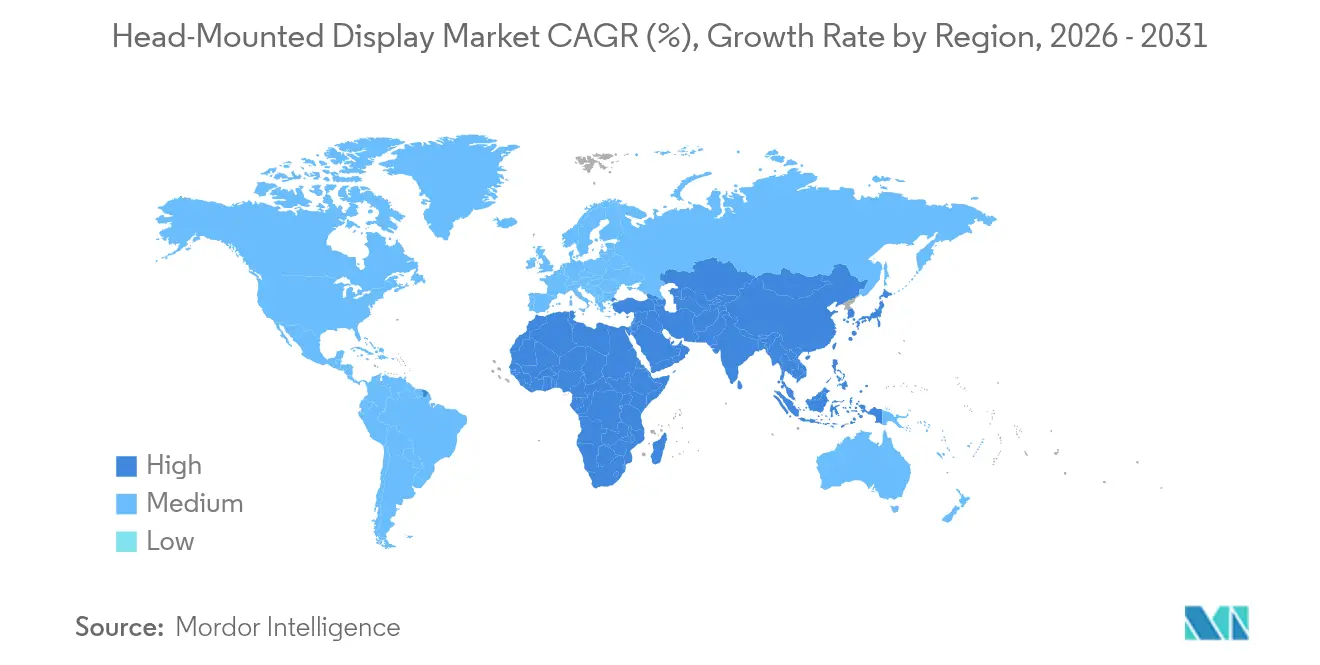
| Fastest Growing Market | North America |
| Largest Market | Asia Pacific |
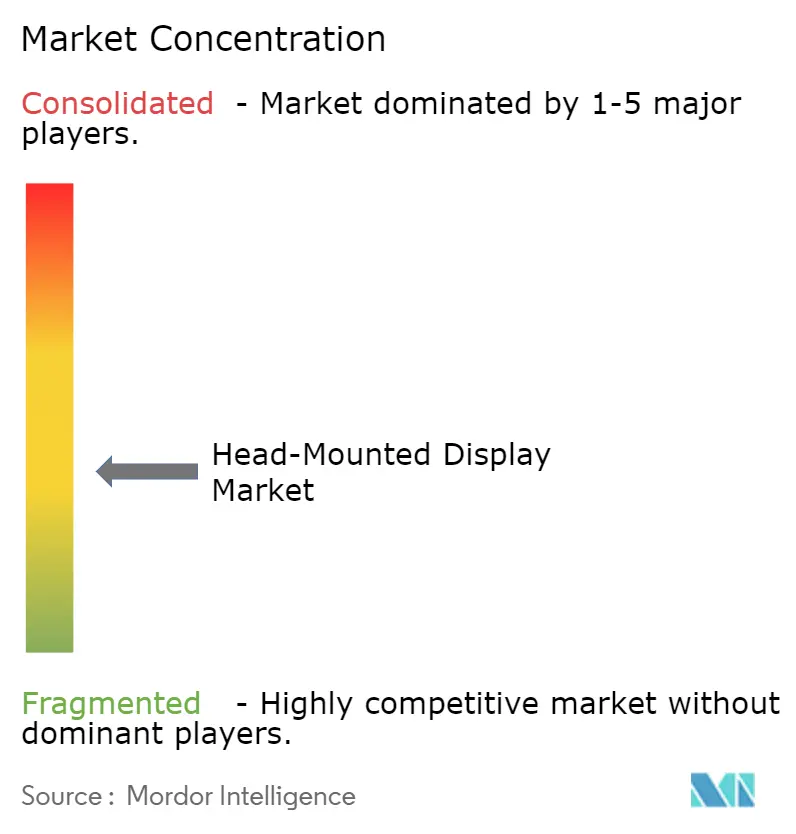
| Market Concentration | Medium |
Major Players *Disclaimer: Major Players sorted in no particular order Image © Mordor Intelligence. Reuse requires attribution under CC BY 4.0. | |
Head-Mounted Display Market Analysis by Mordor Intelligence
Head-Mounted Display market size in 2026 is estimated at USD 11.35 billion, growing from 2025 value of USD 9.68 billion with 2031 projections showing USD 25.17 billion, growing at 17.29% CAGR over 2026-2031. Demand growth aligns with defense modernization budgets, medical tourism initiatives, and industrial metaverse programs that create diversified revenue streams. Volume deployment in NATO and Indo-Pacific militaries nudges procurement toward mixed-reality helmets while 5G-native eyewear from Chinese OEMs accelerates untethered use cases. Content ecosystems around esports subscriptions, immersive live sports, and professional training sustain premium price points despite cyclical consumer hesitancy. Component advances in micro-OLED, eye tracking, and foveated rendering lower power draw and expand form-factor options, helping the Head-Mounted Display market penetrate healthcare, manufacturing, and field service workflows. Supply-chain exposure in Taiwan and new EU compliance rules temper the outlook but do not derail long-term adoption trajectories.
Key Report Takeaways
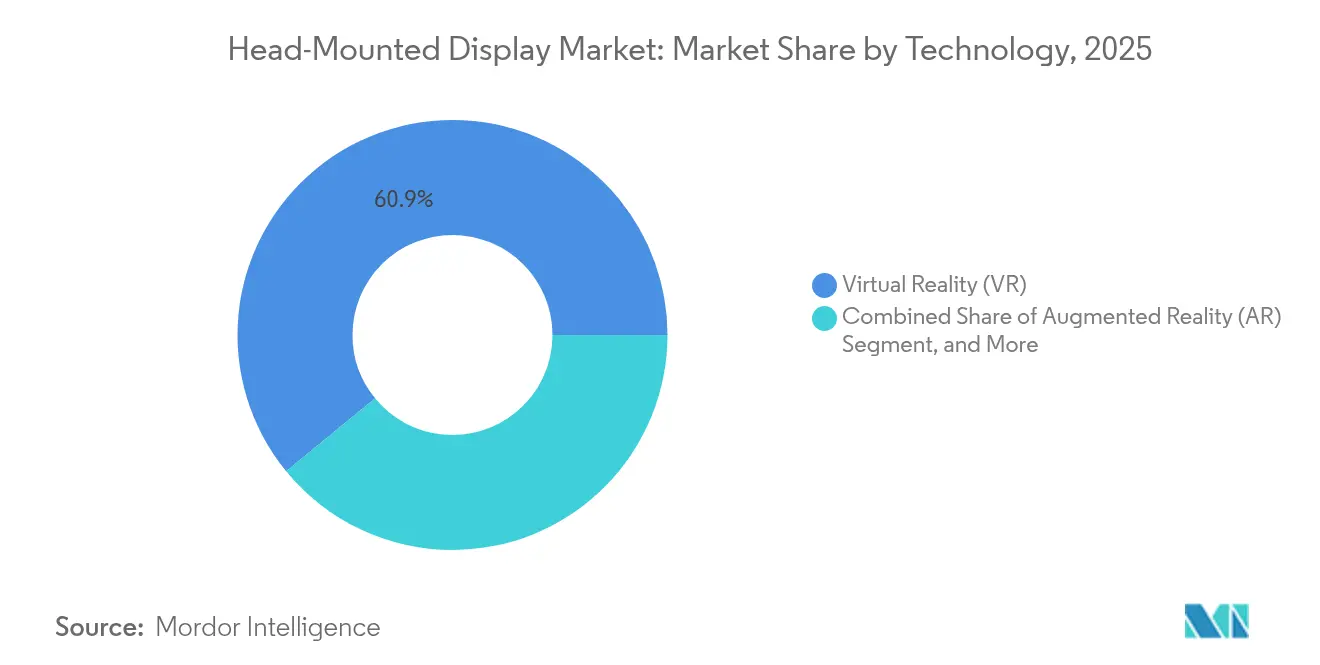
- By technology, Virtual Reality led with 60.92% of Head-Mounted Display market share in 2025; Augmented Reality is forecast to expand at a 18.98% CAGR to 2031.
- By connectivity, wired systems held 54.12% revenue in 2025 while wireless units are projected to grow at a 21.25% CAGR through 2031.
- By product type, helmet-mounted displays commanded 76.88% share of the Head-Mounted Display market size in 2025 and wearable glasses are advancing at a 21.78% CAGR.
- By end-user, consumer applications accounted for 68.95% of demand in 2025, whereas enterprise and industrial use is expanding at a 16.74% CAGR.
- By application, gaming, media and entertainment held 34.42% share of the Head-Mounted Display market size in 2025, and healthcare is progressing at a 20.44% CAGR.
- By geography, North America captured 33.12% of revenue in 2025; Asia-Pacific shows the strongest growth with an 17.64% CAGR to 2031.
Note: Market size and forecast figures in this report are generated using Mordor Intelligence’s proprietary estimation framework, updated with the latest available data and insights as of 2026.
Global Head-Mounted Display Market Trends and Insights
Drivers Impact Analysis*
| Driver | (~) % Impact on CAGR Forecast | Geographic Relevance | Impact Timeline |
|---|---|---|---|
| Defense modernization programs accelerating mixed-reality HMD procurement | +3.2% | NATO, Indo-Pacific | Medium term (2-4 years) |
| Medical tourism hubs integrating surgical-navigation HMDs | +2.8% | Asia-Pacific, MEA spill-over | Short term (≤2 years) |
| 5G-native XR headsets from Chinese OEMs enabling industrial metaverse | +2.1% | Global, early China and SEA | Medium term (2-4 years) |
| North American esports subscriptions favouring premium VR headsets | +1.9% | North America, EU | Short term (≤2 years) |
| EU Digital Product Passport driving AR HMDs for hands-free maintenance | +1.4% | EU, regulated markets | Long term (≥4 years) |
| Saudi giga-projects supporting immersive visitor rollouts | +0.8% | Middle East, global showcase | Medium term (2-4 years) |
| Source: Mordor Intelligence | |||
Defense modernization programs accelerating mixed-reality HMD procurement
Military acquisition cycles are reshaping budget priorities as armies embed visual augmentation into protective helmets. The U.S. Army fielded 2,000 NG-IHPS units in 2024 and targets 190,618 units by 2027, creating a USD 190 million opportunity for integrated optics.[1]Allyson Park, “Army Fields Next-Gen Combat Helmet,” nationaldefensemagazine.org Gentex meanwhile received a U.S. Navy contract for next-generation fixed-wing helmets whose operational fielding starts in late 2025.[2]Gentex Corporation, “Navy OTA for Fixed Wing Helmet,” asdnews.com Indo-Pacific allies mirror these procurements, magnifying demand and standardizing mixed-reality specifications across joint forces.
Medical tourism hubs integrating surgical-navigation HMDs
Hospitals in Thailand, Singapore, and India adopt AR displays to market precision surgery packages, boosting inbound medical travel. Systematic reviews show spine surgery accuracy gains using head-mounted navigation with error tolerance under ±1 mm. The VOSTARS platform achieved 100% trajectory accuracy in maxillofacial trials, reinforcing the value proposition for premium facilities. Rapid 3D model turnaround within 72 hours enables same-week surgery scheduling, further differentiating these destinations.
5G-native XR headsets from Chinese OEMs enabling industrial metaverse
Xreal has shipped nearly 400,000 AR glasses since 2017 and now pairs cloud rendering with 5G to overcome local thermal limits. The USD 199 Beam Pro controller streams Google Play apps in 3D and maintains a 72 g glasses form factor. Manufacturers use these devices for on-floor quality control where millisecond latency improvements make remote expert guidance feasible.
North American esports subscriptions favouring premium VR headsets
Meta’s exclusive live sports and esports bundles encourage competitive gamers to upgrade hardware, reinforcing a premium segment even as mainstream uptake plateaus. Quest 3S price repositioning in October 2024 failed to lift Christmas downloads, which fell 27% against 2023 levels. Dedicated esports viewers, however, accept higher headset costs when bundled with recurring content, sustaining unit revenues.
Restraints Impact Analysis*
| Restraint | (~) % Impact on CAGR Forecast | Geographic Relevance | Impact Timeline |
|---|---|---|---|
| EU blue-light emission limits tightening wearable compliance | -2.3% | EU, regulated markets | Short term (≤2 years) |
| High consumer return rates from cybersickness in U.S. retail | -1.8% | North America, global | Short term (≤2 years) |
| Geopolitical risk to micro-OLED supply in Taiwan | -1.5% | Global | Medium term (2-4 years) |
| Battery-density limits hampering all-day industrial AR headsets | -1.1% | Global | Long term (≥4 years) |
| Source: Mordor Intelligence | |||
EU blue-light emission limits tightening wearable compliance
The 2024/2847 regulation adds cybersecurity and blue-light controls that require redesign of optical engines and firmware over-the-air update pipelines.[3]European Parliament and Council, “Regulation 2024/2847,” eur-lex.europa.eu Companies standardize on EU-compliant specs to avoid regional variants, raising near-term engineering spend and certification lead times.
High consumer return rates from cybersickness in U.S. retail
Meta, HTC, and Sony face elevated return logistics because 60-95% of users report cybersickness after short VR sessions. Laboratory studies recorded 65.2% incidence within 10 minutes and dropout rates near 50% after one hour. Retailers constrain demo lengths and adopt lenient refund policies, which erode margins and dampen repeat purchases.
*Our forecasts treat driver/restraint impacts as directional, not additive. The impact forecasts reflect baseline growth, mix effects, and variable interactions.
Segment Analysis
By Technology: AR Gains Traction amid VR Leadership
Virtual Reality dominated revenue with a 60.92% slice of Head-Mounted Display market share in 2025. Immersive gaming ecosystems and cinematic studios favour VR for fully enclosed worlds that amplify user engagement. Augmented Reality, though smaller, is on a 18.98% CAGR path and adds context-aware overlays for industrial inspection, surgery, and logistics. The blend of both is fuelling Extended Reality toolkits that allow seamless switching between modes.
AR growth rests on enterprise proof points. HoloLens 2 projects delivered 177% ROI and USD 7.6 million net present value across three years in manufacturing and healthcare. Foveated rendering and eye-tracking reduce compute load, letting lightweight eyewear match VR visual fidelity. The Head-Mounted Display market therefore balances VR’s entertainment base with AR’s productivity upside, keeping technology mix diversified.


By Connectivity: Wireless Momentum Redefines Mobility
Wired headsets retained 54.12% revenue in 2025 on the strength of PC-tethered VR rigs that support 4K-per-eye panels and advanced haptics. Wireless variants, however, show a 21.25% CAGR as 5G, Wi-Fi 7, and edge compute allow cloud rendering. Standalone devices untie users from workstations, enabling field maintenance, warehouse picking, and outdoor training.
The wireless surge is visible in Xreal’s 72 g glasses that offload processing to Beam Pro and mobile edge nodes. Battery density and thermal ceilings remain friction points yet year-on-year advances extend runtime toward an eight-hour work shift. Tethered systems maintain niches in flight simulators, esports arenas, and architectural visualization where high frame rates and lossless textures are non-negotiable. The two connectivity modes coexist, expanding the overall Head-Mounted Display market footprint.
By Product Type: Eyewear Challenges Helmet Primacy
Helmet-mounted units held 76.88% revenue in 2025 because defense, aerospace, and heavy industry demand ruggedized protection. Wearable glasses are advancing at 21.78% CAGR as thinner optics, waveguides, and micro-LED panels reduce bulk to daily-wear levels. The shift responds to consumer aesthetics and enterprise comfort mandates.
Smart glasses thermal modeling demonstrates that heat dissipation rather than optical brightness limits miniaturization. Vendors integrate graphite heat spreaders and low-power displays to keep skin contact under 37 °C. Helmet sets preserve relevance by merging ballistic shielding with mixed-reality overlays for infantry and pilot operations. This dual product architecture sustains a broad application spectrum inside the Head-Mounted Display market.
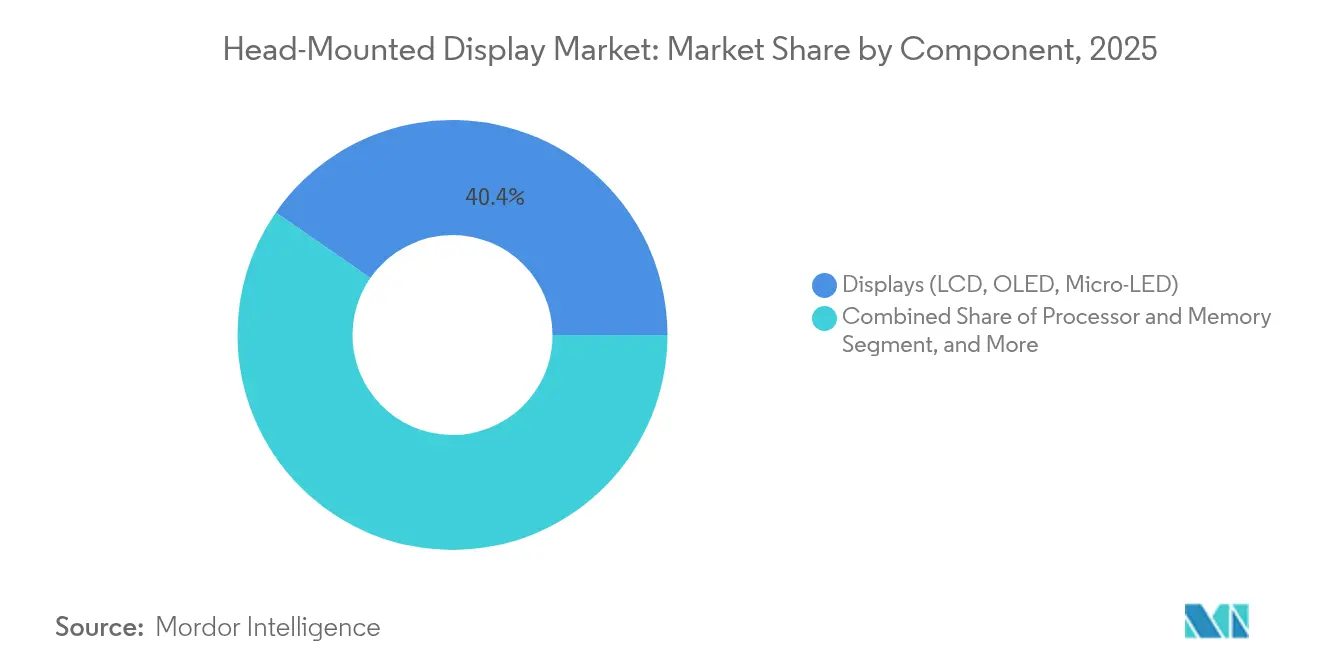
By Component: Sensors Emerge as Strategic Differentiator
Display modules generated 40.35% revenue in 2025, yet sensors and eye-tracking are rising 18.24% CAGR as they unlock foveated rendering, biometric monitoring, and hands-free interaction. Processor advances pair with these sensors, but optical engines still drive user-perceived quality.
IEEE Spectrum reports near-retina 60 ppd panel prototypes that approach the eye’s resolution limit. Eye-tracking then allows selective high-resolution regions, cutting GPU cycles by half. Mojo Vision and CY Vision pursue micro-LED head-up displays for automotive OEMs, proving that component breakthroughs spill into adjacent industries. The Head-Mounted Display market thus rewards suppliers who tighten the sensor–display–compute loop.
By End-User: Enterprises Catch Up with Consumer Volume
Consumers generated 68.95% revenue in 2025 through gaming, social VR, and streaming. Enterprise and industrial segments expand at 16.74% CAGR as digital twin initiatives and remote collaboration justify investment. Corporations look for quantifiable productivity, and case studies cite 90% manufacturing efficiency gains and 30% healthcare ward-round time cuts when mixed-reality workflows replace legacy screens.
Defense buyers remain pivotal, committing multi-year volumes that anchor helmet production lines. Healthcare providers adopt surgical-navigation AR solutions to attract medical tourists and improve outcomes. Theme parks and exhibitions roll out large headset fleets that amortize cost per visitor. These varied demand centers underpin long-term stability inside the Head-Mounted Display market.
By Application: Healthcare Leads Next Growth Wave
Gaming, media and entertainment formed 34.42% of 2025 revenue and continue to finance content libraries that keep users engaged. Healthcare and therapy applications, rising at 20.44% CAGR, leverage precision overlays for surgery, rehabilitation, and mental-health exposure therapy. Clinical trials confirm error reduction and recovery improvements, strengthening reimbursement arguments.
Industrial training, aerospace simulation, and education also mature as language, math, and trade curricula move into immersive classrooms. Field service overlays allow real-time part identification that shortens machine downtime. This diversification shields the Head-Mounted Display market from cyclical swings in consumer electronics.
Geography Analysis
North America held 33.12% revenue in 2025 on the back of robust defense procurement and an entrenched gaming culture. The U.S. Army NG-IHPS rollout and Navy fixed-wing helmet orders guarantee baseline demand while enterprises expand pilot projects into fleet deployments. Retail channels nonetheless face return-rate pressure because cybersickness remains unresolved.
Asia-Pacific records the fastest 17.64% CAGR to 2031. China’s subsidy programs and 5G infrastructure underpin local headset manufacturing, and Xreal’s affordable glasses catalyze adoption in manufacturing and education. Medical tourism capitals in Thailand, Singapore, and India standardize AR surgery gear to boost international patient flow. Taiwan’s 63.8% semiconductor share positions the island as a critical supplier, but geopolitical tension introduces contingency planning costs.
Europe presents a regulation-heavy but opportunity-rich landscape. The Digital Product Passport and cybersecurity acts push manufacturers to deploy AR maintenance tools while incurring certification costs. Germany, France, and the United Kingdom adopt mixed-reality for auto assembly and NHS training. The Middle East gains visibility through NEOM and Qiddiya, which trial immersive visitor experiences on unprecedented scales. South America lags but Brazil leverages esports popularity to grow VR cafés and arcades, bringing incremental volumes into the Head-Mounted Display market.

Competitive Landscape
Competition is moderate with Meta, Microsoft, Sony, Apple, and Samsung contending against Varjo, HTC, and Xreal. Meta invested USD 65 billion in extended-reality R&D to sustain content flywheels, whereas Apple’s USD 33 billion Vision Pro program targets premium spatial computing. Microsoft maintains enterprise loyalty through HoloLens service bundles that document double-digit ROI.
Vertical integration intensifies. Meta designs custom silicon, optics, and operating systems to reduce bill-of-materials and lock users into its platform. Apple controls supply chain from micro-OLED sourcing to in-house R1 chipset. Sony leverages PlayStation network synergies while Varjo focuses on sub-arc-minute resolution for aerospace simulators. Emerging entrants exploit niche strategies: Xreal pairs low-cost hardware with cloud computing; Mojo Vision supplies micro-LED modules for automotive HUDs.
Strategic moves since 2024 show portfolio expansion. Gentex’s helmet contract anchors defense engagement. HTC’s Vive Focus Vision adds color passthrough and eye tracking for mid-tier gaming. Paradromics teams with NEOM for brain-computer research, foreshadowing neuro-adaptive interfaces. Mergers and component partnerships are expected as firms secure optics IP and sensor fabs to protect long-term cost structures within the Head-Mounted Display market.
Head-Mounted Display Industry Leaders
Sony Corporation
Zebra Technologies Corporation
Oculus VR LLC (Meta Platform Technologies)
Magic Leap, Inc.
Varjo Technologies
- *Disclaimer: Major Players sorted in no particular order

Recent Industry Developments
- February 2025: Saudi Arabia’s NEOM partnered with Paradromics to create a Brain-Computer Interface Center of Excellence.
- January 2025: Meta Quest 3S failed to lift holiday demand, with app downloads down 27% year on year.
- November 2024: Gentex won a U.S. Navy contract for next-generation fixed-wing helmets, with fielding slated for late 2025.
- September 2024: Meta unveiled USD 299 Quest 3S and Orion AR glasses prototype.


Global Head-Mounted Display Market Report Scope
Head Mounted Displays (HMDs) are devices positioned directly in front of one or both of the user's eyes via a head mount. This setup allows digital content to be superimposed onto the user's field of vision. The study tracks the revenue accrued through the sale of head-mounted display types by various players globally. The study also tracks the key market parameters, underlying growth influencers, and major vendors operating in the industry, which supports the market estimations and growth rates over the forecast period. The study further analyses the overall impact of COVID-19 aftereffects and other macroeconomic factors on the market.
The head-mounted display market is segmented by technology (AR, VR, and XR), connectivity (wired (tethered HMD), and wireless (standalone HMD)), application (aerospace and defense, gaming, media and entertainment, healthcare and medical devices, education, and others), and geography (North America, Europe, Asia-Pacific, Latin America, and Middle East and Africa). The market sizes and forecasts are provided in terms of value (USD) for all the above segments.
| Augmented Reality (AR) |
| Virtual Reality (VR) |
| Extended/Mixed Reality (XR) |
| Wired (Tethered) |
| Wireless (Standalone) |
| Helmet-Mounted Displays |
| Wearable Glasses/Eyewear |
| Processor and Memory |
| Sensors (IMU, Eye-Tracking) |
| Displays (LCD, OLED, Micro-LED) |
| Controllers and Cameras |
| Consumer |
| Enterprise and Industrial |
| Commercial (Theme Parks, Cinemas) |
| Military and Defense |
| Healthcare |
| Gaming, Media and Entertainment |
| Aerospace and Defense Training |
| Surgical Navigation and Therapy |
| Education and Workforce Upskilling |
| Field Service and Maintenance |
| North America | United States | |
| Canada | ||
| Mexico | ||
| Europe | Germany | |
| United Kingdom | ||
| France | ||
| Nordics | ||
| Rest of Europe | ||
| South America | Brazil | |
| Rest of South America | ||
| Asia-Pacific | China | |
| Japan | ||
| India | ||
| South-East Asia | ||
| Rest of Asia-Pacific | ||
| Middle East and Africa | Middle East | Gulf Cooperation Council Countries |
| Turkey | ||
| Rest of Middle East | ||
| Africa | South Africa | |
| Rest of Africa | ||
| By Technology | Augmented Reality (AR) | ||
| Virtual Reality (VR) | |||
| Extended/Mixed Reality (XR) | |||
| By Connectivity | Wired (Tethered) | ||
| Wireless (Standalone) | |||
| By Product Type | Helmet-Mounted Displays | ||
| Wearable Glasses/Eyewear | |||
| By Component | Processor and Memory | ||
| Sensors (IMU, Eye-Tracking) | |||
| Displays (LCD, OLED, Micro-LED) | |||
| Controllers and Cameras | |||
| By End-User | Consumer | ||
| Enterprise and Industrial | |||
| Commercial (Theme Parks, Cinemas) | |||
| Military and Defense | |||
| Healthcare | |||
| By Application | Gaming, Media and Entertainment | ||
| Aerospace and Defense Training | |||
| Surgical Navigation and Therapy | |||
| Education and Workforce Upskilling | |||
| Field Service and Maintenance | |||
| By Geography | North America | United States | |
| Canada | |||
| Mexico | |||
| Europe | Germany | ||
| United Kingdom | |||
| France | |||
| Nordics | |||
| Rest of Europe | |||
| South America | Brazil | ||
| Rest of South America | |||
| Asia-Pacific | China | ||
| Japan | |||
| India | |||
| South-East Asia | |||
| Rest of Asia-Pacific | |||
| Middle East and Africa | Middle East | Gulf Cooperation Council Countries | |
| Turkey | |||
| Rest of Middle East | |||
| Africa | South Africa | ||
| Rest of Africa | |||


Key Questions Answered in the Report
What is the current size of the Head-Mounted Display market?
The market stands at USD 11.35 billion in 2026 and is forecast to reach USD 25.17 billion by 2031.
Which technology segment is growing fastest?
Augmented Reality is the fastest-growing segment with a 18.98% CAGR through 2031.
Why are wireless headsets gaining traction?
5G and edge computing remove tethering constraints, enabling mobile training, field service, and cloud-rendered applications that drive a 21.25% CAGR for wireless units.
How are regulatory changes in Europe affecting vendors?
New EU cybersecurity and blue-light rules increase engineering costs and time-to-market but also stimulate demand for AR maintenance tools to meet Digital Product Passport requirements.
Which region offers the highest growth potential?
Asia-Pacific shows the strongest trajectory with an 17.64% CAGR due to 5G investments, manufacturing adoption, and medical tourism integrations.
What factors limit broader consumer adoption?
Cybersickness leads to high return rates, and premium pricing remains a barrier for mainstream buyers despite content expansion.
Page last updated on:


