Space Logistics Market Size and Share
Market Overview
| Study Period | 2020 - 2031 |
|---|---|
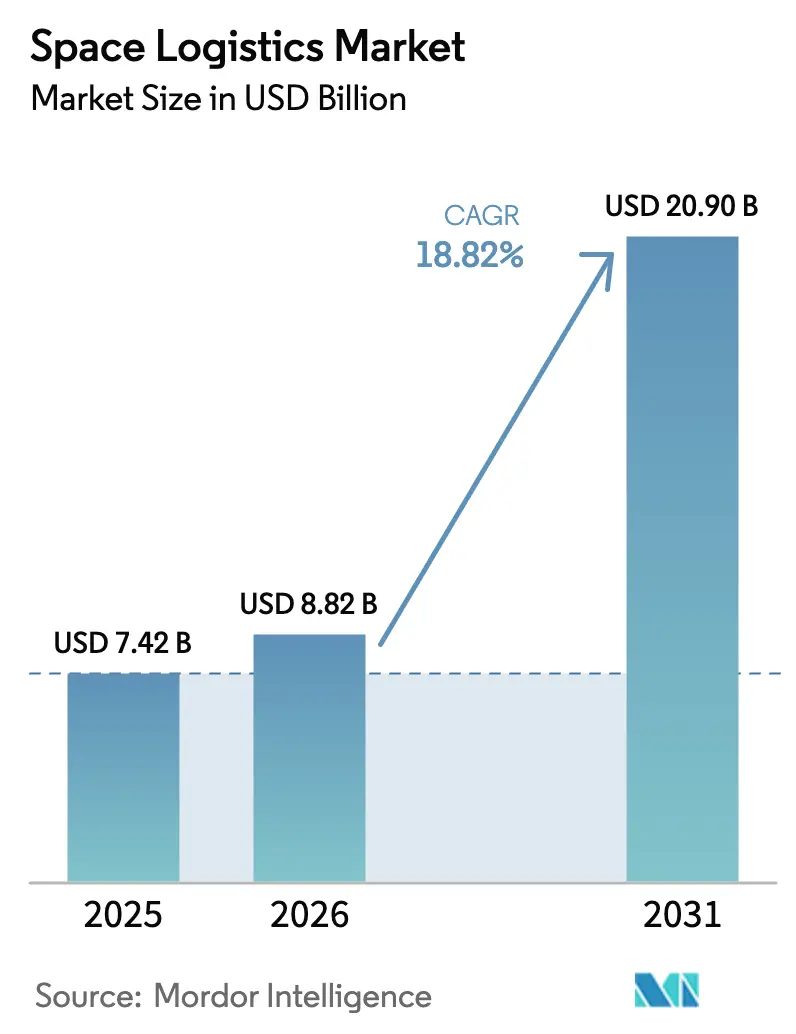
| Market Size (2026) | USD 8.82 Billion |
| Market Size (2031) | USD 20.9 Billion |
| Growth Rate (2026 - 2031) | 18.82% CAGR |
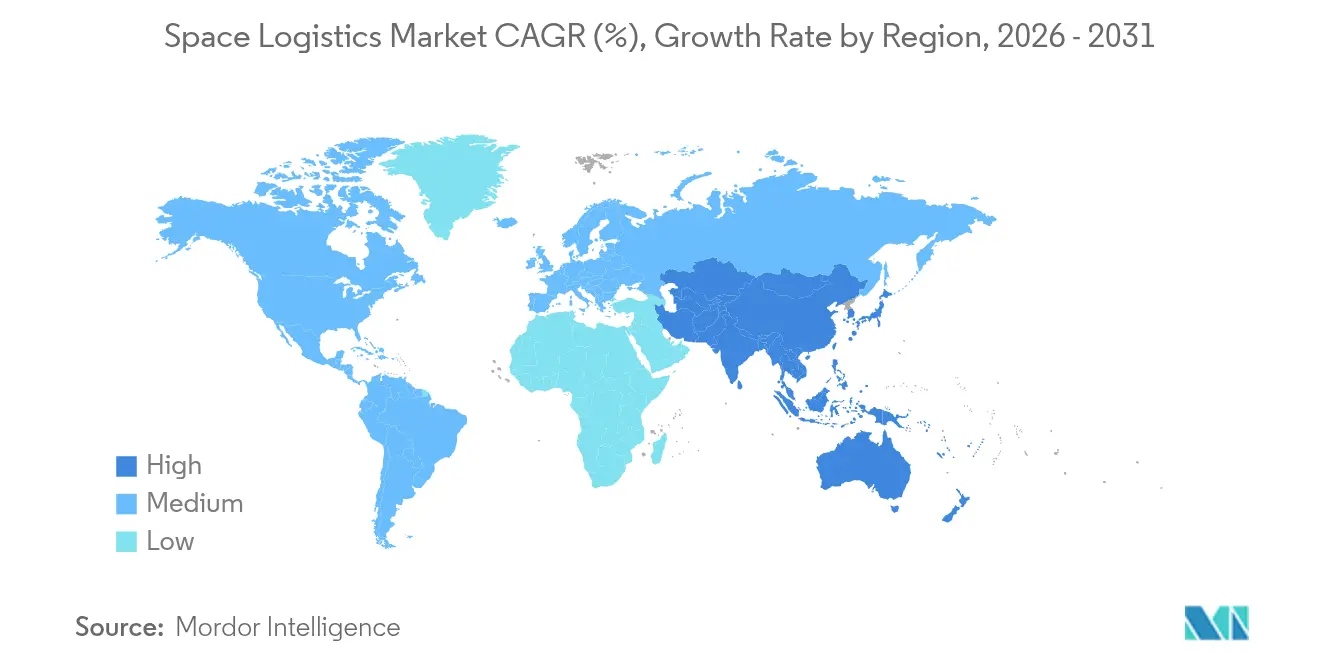
| Fastest Growing Market | Asia Pacific |
| Largest Market | North America |
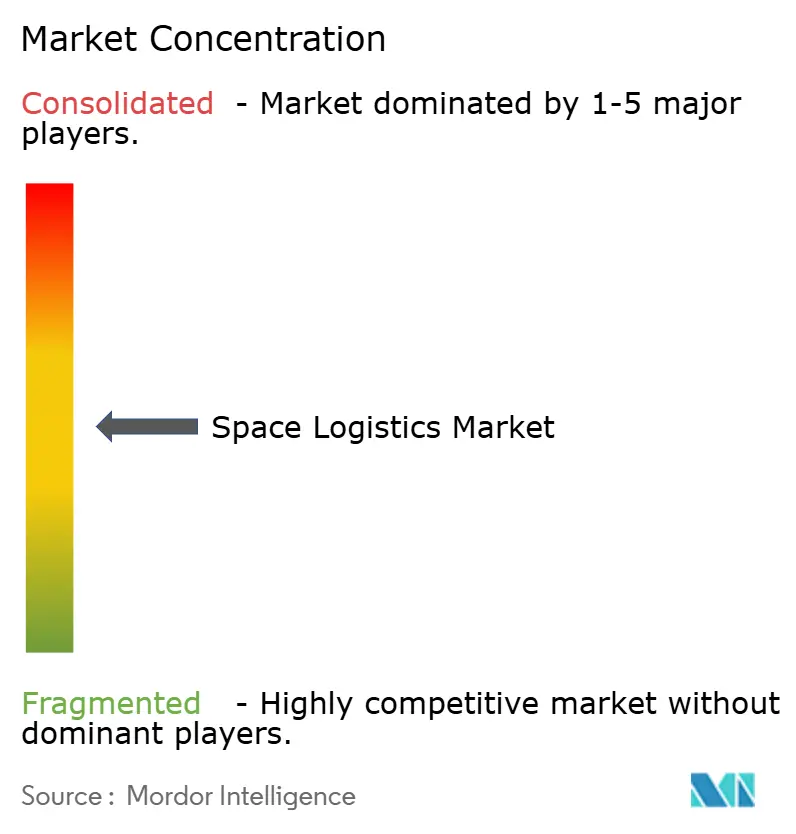
| Market Concentration | Medium |
Major Players *Disclaimer: Major Players sorted in no particular order Image © Mordor Intelligence. Reuse requires attribution under CC BY 4.0. | |
Space Logistics Market Analysis by Mordor Intelligence
The space logistics market size was valued at USD 7.42 billion in 2025 and estimated to grow from USD 8.82 billion in 2026 to reach USD 20.9 billion by 2031, at a CAGR of 18.82% during the forecast period (2026-2031). Rapid launch-cost declines, large-scale satellite-constellation rollouts, and rising on-orbit services that stretch satellite lifetimes are accelerating demand. Government security programs and lunar exploration initiatives secure baseline volumes, while commercial megaconstellations, orbital refueling, and additive manufacturing unlock new revenue pools. Moderate fragmentation, intensifying price competition, and region-specific regulatory hurdles shape the strategic agenda for incumbents and entrants alike. Finally, the market’s resilience will hinge on propellant-supply innovation, harmonized traffic rules, and scalable in-space infrastructure that lowers total mission cost.
Key Report Takeaways
- By operation, on-orbit servicing, assembly, and manufacturing (OSAM) led with 38.35% of space logistics market share in 2025; orbital debris removal is projected to grow at 22.02% CAGR through 2031.
- By payload, spacecraft and satellite systems accounted for 44.10% of the space logistics market size in 2025, whereas propellant and fuels are expected to expand at 23.45% CAGR to 2031.
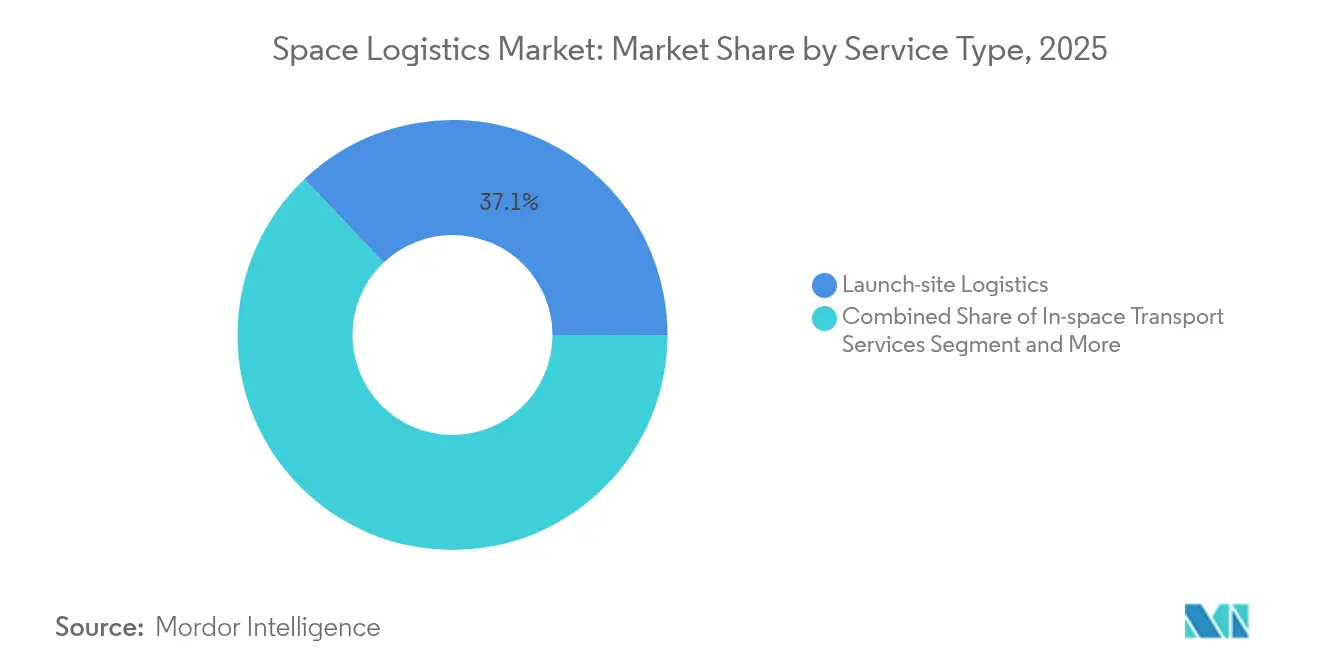
- By service type, launch-site logistics held 37.10% revenue share in 2025; pre-launch logistics shows the strongest outlook at a 20.05% CAGR during the forecast window.
- By end user, government and military customers represented 48.20% of the space logistics market in 2025, while commercial operators are forecast to climb at 23.10% CAGR through 2031.
- By geography, North America commanded 44.90% share of the space logistics market in 2025; Asia-Pacific is anticipated to post the fastest 22.10% CAGR to 2031.
Note: Market size and forecast figures in this report are generated using Mordor Intelligence’s proprietary estimation framework, updated with the latest available data and insights as of 2026.
Global Space Logistics Market Trends and Insights
Drivers Impact Analysis*
| Driver | (∼) % Impact on CAGR Forecast | Geographic Relevance | Impact Timeline |
|---|---|---|---|
| Surge in small-satellite constellation deployments | +3.2% | Global, North America and Asia-Pacific concentrations | Medium term (2-4 years) |
| Falling launch costs from reusable rockets | +4.1% | Global, led by North America extending to Europe, Asia-Pacific | Short term (≤ 2 years) |
| Expansion of government-funded exploration programs | +2.8% | North America, Europe, Asia-Pacific core markets | Long term (≥ 4 years) |
| Rising investment in commercial on-orbit services | +3.5% | Global, early adoption in North America and Europe | Medium term (2-4 years) |
| Emergence of orbital propellant depots | +1.9% | Initial deployment in North America and Europe | Long term (≥ 4 years) |
| On-orbit additive manufacturing enabling last-mile | +1.4% | North America, Europe, with Asia-Pacific following | Long term (≥ 4 years) |
| Source: Mordor Intelligence | |||
Falling Launch Costs from Reusable Rockets
SpaceX has trimmed per-mission launch pricing from about USD 62 million to roughly USD 15 million, making frequent cargo runs and in-orbit repairs financially viable. Competitive pressure intensified when Blue Origin secured USD 2.3 billion in Pentagon launch contracts that incentivize additional reusability RandD. Lower tariffs ripple across the space logistics market, catalyzing satellite rideshare programs, responsive launch services, and on-demand in-orbit payload deployment.
Surge in Small-Satellite Constellation Deployments
Amazon’s Project Kuiper alone targets more than 3,000 spacecraft, demanding precise insertion, formation management, and maintenance flights.[1]Nathan Strout, “Project Kuiper Deployment Strategy,” Kratos Defense, kratosdefense.com NanoAvionics won a USD 131 million order to manufacture 280 satellites, underscoring how constellation economics reshape planning cycles and elevate throughput requirements.
Rising Investment in Commercial On-Orbit Services
Orbit Fab’s refueling-station architecture, backed by major satellite operators, extends spacecraft duty cycles and shifts replacement economics. [2]Andrew Parsonson, “Orbit Fab Secures Refueling Customers,” Copernical, copernical.com Gravitics signed a USD 125 million infrastructure pact with Axiom Space, reflecting investor confidence in orbital supply-chain assets that monetize life-extension and modular assembly.
Expansion of Government-Funded Exploration Programs
Global public space budgets rose to USD 135 billion in 2024, led by NASA’s USD 25.4 billion allocation and the U.S. Space Force’s USD 13.7 billion launch-services awards. Long-horizon lunar and Mars logistics requirements give suppliers predictable order visibility through the decade.
Restraints Impact Analysis*
| Restraint | (∼) % Impact on CAGR Forecast | Geographic Relevance | Impact Timeline |
|---|---|---|---|
| High capital-expenditure requirements | -2.1% | Global, heavier burden in emerging markets | Medium term (2-4 years) |
| Complex and fragmented regulatory frameworks | -1.8% | Global, variance by jurisdiction | Long term (≥ 4 years) |
| Orbital traffic-management bottlenecks | -1.3% | Global, concentrated in popular orbital zones | Short term (≤ 2 years) |
| Supply-chain scarcity of xenon/krypton propellants | -0.9% | Global, acute for electric-propulsion satellite fleets | Medium term (2-4 years) |
| Source: Mordor Intelligence | |||
High Capital-Expenditure Requirements
Building an orbital-servicing craft costs USD 50-200 million and requires bespoke mission-control centers and insurance lines, limiting participation to cash-rich primes or well-funded startups. New finance vehicles such as satellite-as-a-service contracts and thematic venture funds mitigate but do not eliminate entry barriers.
Complex and Fragmented Regulatory Frameworks
The U.S. FCC’s five-year deorbit mandate and forthcoming EU Space Act introduce non-aligned compliance paths that multiply legal reviews, operational audits, and administrative overhead.[3]William Pease, “FCC Finalizes Five-Year Deorbit Rule,” Lexology, lexology.com Delays in global traffic-coordination systems add uncertainty, discouraging multi-orbital investments despite rising demand.
*Our forecasts treat driver/restraint impacts as directional, not additive. The impact forecasts reflect baseline growth, mix effects, and variable interactions.
Segment Analysis
By Operation: OSAM Dominates While Debris Removal Accelerates
OSAM captured 38.35% of space logistics market share in 2025, reflecting satellite owners’ urgency to stretch asset value amid congested orbits. Service revenue is buoyed by robotic inspection, life-extension docks, and structure assembly that defer costly replacement cycles. The space logistics market size for OSAM is expected to expand steadily as insurers embrace proven servicing track records and operators budget in-situ upgrades.
Orbital debris removal, though presently small, is on track for a 22.02% CAGR to 2031, spurred by stricter regulatory mandates and multimillion-dollar liability exposure for collision events. Commercial frameworks such as “pay-per-capture” and government incentive pools shorten payback periods. The integration of autonomous rendezvous and capture drives operational efficiency, positioning debris removal as the next breakout service line.


By Payload: Spacecraft Systems Lead Infrastructure Build-Out
Spacecraft and satellite systems held 44.10% revenue in 2025 as constellation owners prioritized throughput and resilience. Replacement cycles of five-to-seven years create a dependable baseline for launch and in-space transport. Propellant and fuels, the fastest-growing payload at 23.45% CAGR, will benefit from orbital depots that cut ground-launched xenon demand priced at USD 1,500/kg. The space logistics market size tied to propellant deliveries rises as electric-propulsion spacecraft opt for in-orbit top-ups, reducing mass and cost constraints.
Specialized cargo, consumables, and infrastructure modules show sequential growth as crewed missions, free-flyer stations, and orbital fabs mature. These categories require temperature-controlled stowage, contamination-free handling, and flexible manifest planning, incentivizing providers to diversify beyond standard satellite buses.
By Service Type: Launch-Site Operations Anchor Market Foundation
Launch-site logistics controlled 37.10% revenue in 2025, underpinned by complex fueling, payload integration, and range-safety tasks at high-throughput complexes such as Cape Canaveral. As launch cadence increases, payload-clean-room capacity and multimodal freight corridors are scaling in step, ensuring seamless flows from factory to pad.
Pre-launch logistics leads growth at a 20.05% CAGR, reflecting higher rideshare volumes and compressed campaign timelines. The space logistics market size associated with pre-launch integration benefits from digital twin-based process automation that cuts cycle time and labor cost. In-space transfer and post-mission disposal services gain relevance as operators seek agile orbital mobility and regulatory compliance with FCC deorbit rules.
By End User: Government Demand Underwrites Commercial Upswing
Government and military agencies supplied 48.20% of 2025 spend, anchoring multiyear contracts that stabilize provider cash flows. National security launches, Earth-observation upgrades, and cislunar cargo runs dominate current procurement cycles. Parallelly, commercial operators are adding satellites at unprecedented rates; their segment is forecast to clock a 23.10% CAGR through 2031, lifting overall utilization of logistics assets.
The space logistics market size tied to commercial accounts expands as broadband, Earth-imaging, and cloud-edge processing providers outsource life-extension and debris-mitigation tasks. Research institutions contribute niche volumes through CubeSat programs, reinforcing the democratization of access and the need for inexpensive secondary slots.
Geography Analysis
North America held 44.90% of the space logistics market in 2025, propelled by the United States’ deep industrial base, SpaceX’s estimated USD 15.5 billion 2025 revenue flywheel, and sustained Pentagon funding. Canada and Mexico augment regional strength with component manufacturing and cross-border supply-chain synergies.
Asia-Pacific is projected to post a 22.10% CAGR to 2031, driven by China’s AI-satellite deployments, India’s human-spaceflight roadmap, and Japan’s precision lunar landing initiatives. Regional governments bundle launch vouchers, export credits, and technology grants that accelerate commercial uptake of logistics services.
Europe sustains meaningful share through ESA-backed exploration missions and a cohesive sustainability agenda that incentivizes debris-removal pilots. Thales Alenia Space’s EUR 367 million EnVision contract showcases robust public-private collaboration. Latin America’s near-equatorial Alcântara site and the Middle East’s sovereign-wealth-funded programs illustrate diversified geographic opportunity pipelines.

Competitive Landscape
The competitive field is moderately fragmented. Tier-one integrators such as SpaceX, Northrop Grumman, and ArianeGroup leverage vertically integrated supply chains, captive launch capacity, and multiorbit portfolios to secure anchor customers. Specialized challengers—Astroscale in debris removal, D-Orbit in last-mile transport, and Orbit Fab in refueling—pursue niche dominance through patented technologies and flexible contracting models.
Industry consolidation is accelerating. Lockheed Martin’s acquisition of Terran Orbital expands small-satellite production capacity, while DSV’s USD 15.3 billion buyout of DB Schenker strengthens multimodal logistics links between terrestrial and space supply chains. Strategic alliances also proliferate; operators partner with manufacturers and tug providers to bundle launch, transfer, and long-term servicing into single invoices.
Competitive advantage increasingly derives from holistic capability stacks that combine launch cadence, in-space mobility, and compliance automation. Firms that master rapid manufacture, autonomous guidance, and debris-avoidance protocols will capture premium margins as customers prioritize reliability and risk-mitigation over unit cost.
Space Logistics Industry Leaders
ArianeGroup
ATOMOS SPACE
D-Orbit S.p.A.
EXOLAUNCH GmbH
Relativity Space
- *Disclaimer: Major Players sorted in no particular order

Recent Industry Developments
- June 2025: China orbited 12 AI-enabled satellites to anchor a planned 2,800-satellite compute constellation, creating fresh demand for high-frequency logistics cycles.
- May 2025: The African Space Agency commenced operations in Cairo to coordinate 55-nation space activities, signaling emergent regional logistics needs.
- March 2025: The U.S. Space Force awarded USD 13.7 billion in launch contracts to SpaceX, ULA, and Blue Origin covering 54 missions through 2029.
- February 2025: ESA and Arianespace agreed to launch the Plato exoplanet mission on Ariane 6 in 2026, underscoring Europe’s independent logistics posture.


Global Space Logistics Market Report Scope
Space logistics is the theory and practice of driving space system design for operability and supportability, and of managing the flow of material, services, and information needed throughout a space system lifecycle.
The space logistics market is segmented by operation (space exploration, on-orbit servicing assembly and manufacturing, space situational awareness, other operations), by payloads (spacecraft and satellites systems, cargo and material, other payloads), by geography (North America, Europe, Asia-Pacific, Latin America, Middle East and Africa). The market sizes and forecasts are provided in terms of value (USD) for all the above segments.
| On-orbit Servicing, Assembly and Manufacturing (OSAM) |
| Space Exploration Logistics (Crew and Cargo) |
| Space Situational Awareness |
| Orbital Debris Removal |
| Last-mile Delivery / Orbital Transfer Vehicles |
| Other Operations |
| Spacecraft and Satellite Systems |
| Cargo and Consumables |
| Propellant and Fuels |
| Space-Infrastructure Modules |
| Other Payloads |
| Pre-launch Logistics |
| Launch-site Logistics |
| In-space Transport Services |
| Post-mission Disposal Services |
| Government and Military |
| Commercial Operators |
| Research and Academic Institutions |
| North America | United States | |
| Canada | ||
| Mexico | ||
| South America | Brazil | |
| Argentina | ||
| Rest of South America | ||
| Europe | United Kingdom | |
| Germany | ||
| France | ||
| Italy | ||
| Spain | ||
| Russia | ||
| Rest of Europe | ||
| Asia-Pacific | China | |
| Japan | ||
| India | ||
| South Korea | ||
| Australia and New Zealand | ||
| Rest of Asia-Pacific | ||
| Middle East and Africa | Middle East | Saudi Arabia |
| UAE | ||
| Turkey | ||
| Rest of Middle East | ||
| Africa | South Africa | |
| Nigeria | ||
| Kenya | ||
| Rest of Africa | ||
| By Operation | On-orbit Servicing, Assembly and Manufacturing (OSAM) | ||
| Space Exploration Logistics (Crew and Cargo) | |||
| Space Situational Awareness | |||
| Orbital Debris Removal | |||
| Last-mile Delivery / Orbital Transfer Vehicles | |||
| Other Operations | |||
| By Payload | Spacecraft and Satellite Systems | ||
| Cargo and Consumables | |||
| Propellant and Fuels | |||
| Space-Infrastructure Modules | |||
| Other Payloads | |||
| By Service Type | Pre-launch Logistics | ||
| Launch-site Logistics | |||
| In-space Transport Services | |||
| Post-mission Disposal Services | |||
| By End User | Government and Military | ||
| Commercial Operators | |||
| Research and Academic Institutions | |||
| By Geography | North America | United States | |
| Canada | |||
| Mexico | |||
| South America | Brazil | ||
| Argentina | |||
| Rest of South America | |||
| Europe | United Kingdom | ||
| Germany | |||
| France | |||
| Italy | |||
| Spain | |||
| Russia | |||
| Rest of Europe | |||
| Asia-Pacific | China | ||
| Japan | |||
| India | |||
| South Korea | |||
| Australia and New Zealand | |||
| Rest of Asia-Pacific | |||
| Middle East and Africa | Middle East | Saudi Arabia | |
| UAE | |||
| Turkey | |||
| Rest of Middle East | |||
| Africa | South Africa | ||
| Nigeria | |||
| Kenya | |||
| Rest of Africa | |||


Key Questions Answered in the Report
What is the current value of the space logistics market?
The space logistics market stands at USD 8.82 billion in 2026, with a forecast to reach USD 20.9 billion by 2031.
Which operation segment dominates this market?
On-orbit servicing, assembly, and manufacturing holds the top position, commanding 38.35% market share in 2025.
Why are reusable rockets so important for space logistics growth?
Reusable boosters have reduced launch costs to nearly USD 15 million per mission, enabling higher launch frequency and more affordable in-orbit services.
Which region is expected to grow the fastest?
Asia-Pacific is projected to expand at a 22.10% CAGR through 2031, driven by Chinese, Indian, and Japanese space programs.
Page last updated on:


