South Africa Semiconductor Market Size and Share
Market Overview
| Study Period | 2019 - 2030 |
|---|---|
| Forecast Data Period | 2025 - 2030 |
| Historical Data Period | 2019 - 2023 |
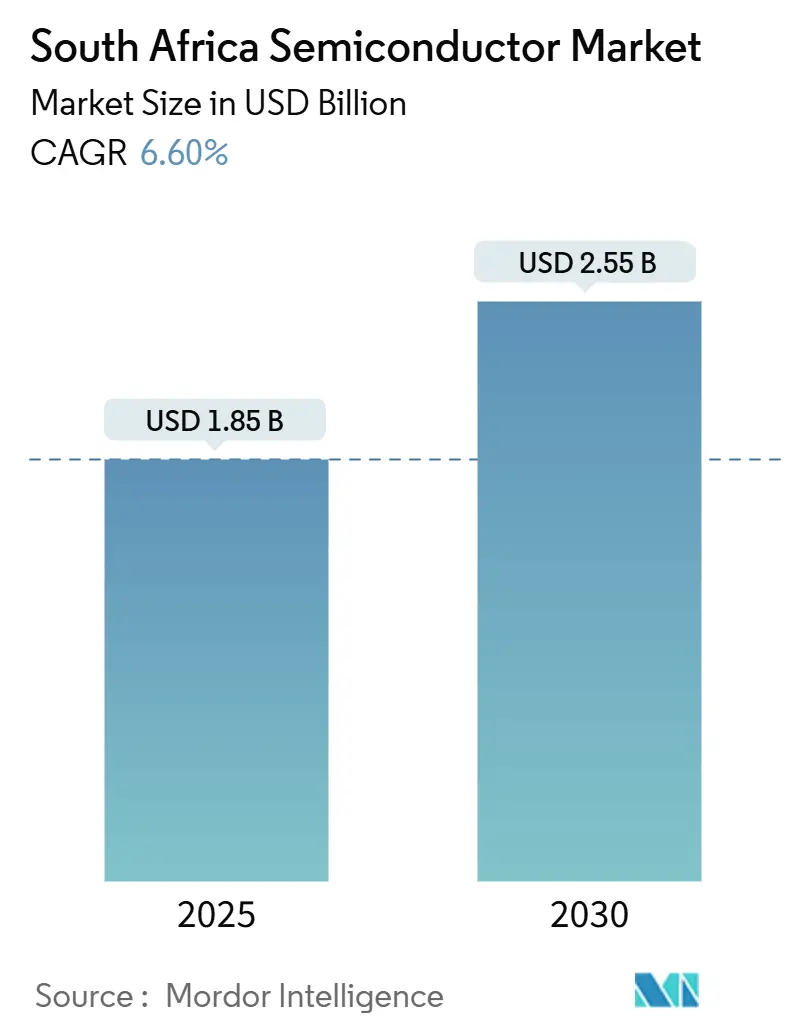
| Market Size (2025) | USD 1.85 Billion |
| Market Size (2030) | USD 2.55 Billion |
| Growth Rate (2025 - 2030) | 6.60% CAGR |
| Market Concentration | Medium |
Major Players *Disclaimer: Major Players sorted in no particular order Image © Mordor Intelligence. Reuse requires attribution under CC BY 4.0. | |
South Africa Semiconductor Market Analysis by Mordor Intelligence
The South Africa semiconductor market size is USD 1.85 billion in 2025 and is forecast to reach USD 2.55 billion by 2030, reflecting a 6.60% CAGR during the period. Robust policy support, including the Economic Reconstruction and Recovery Plan and the Draft National AI Plan, positions the country as a continental technology hub that demands advanced chips for 5G, automotive electrification, and renewable-energy microgrids. Ongoing load-shedding episodes and rand volatility temper near-term momentum, yet local content rules, Silicon-28 enrichment in Pretoria, and skills initiatives such as ARM’s (E³)NGAGE labs reinforce domestic value addition. Multinational IDMs expand regional footprints while emerging fabless players tap global foundries, ensuring that the South Africa semiconductor market remains both opportunity-rich and structurally exposed to supply-chain shocks. Currency weakness inflates import costs, pushing laptop prices 15% higher in 2024, but sustained consumer-electronics demand and AI venture funding offset affordability headwinds.
Key Report Takeaways
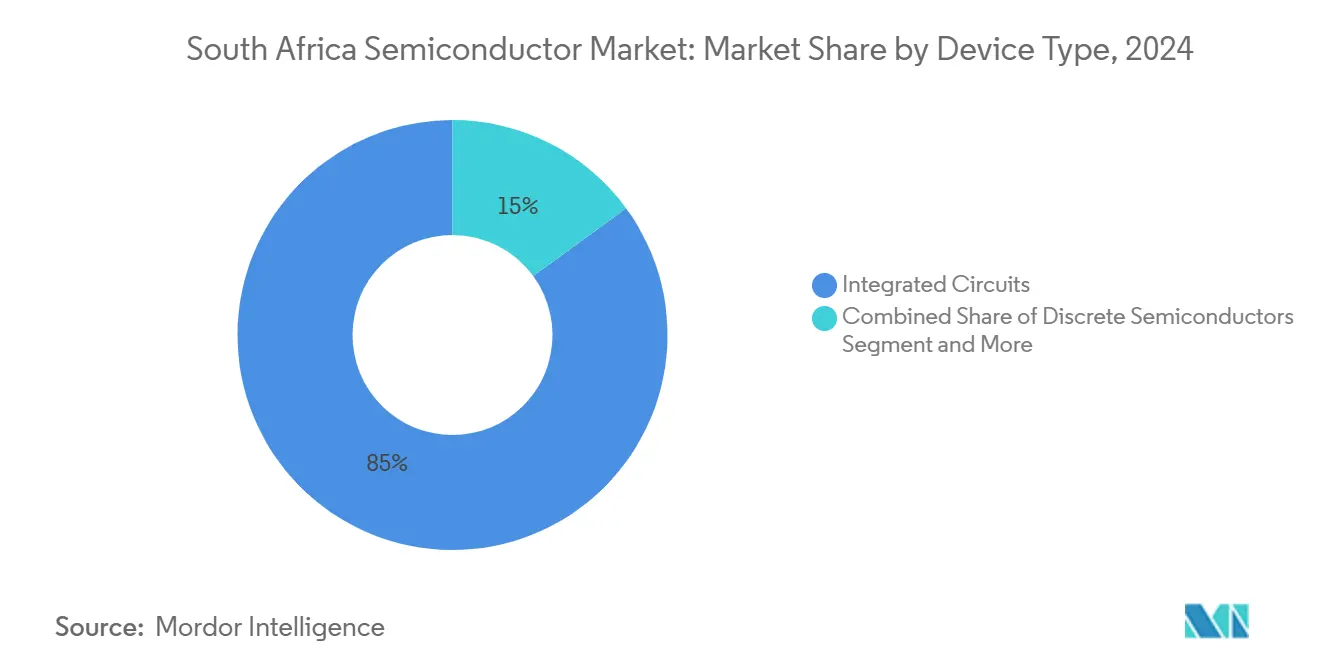
- By device type, Integrated Circuits led with an 85.04% share of the South Africa semiconductor market size in 2024, whereas Sensors and MEMS posted the fastest growth at an 8.1% CAGR through 2030.
- By business model, the IDM segment captured 75.3% of the South Africa semiconductor market share in 2024, but Design/Fabless Vendors are projected to expand at a 7.5% CAGR to 2030.
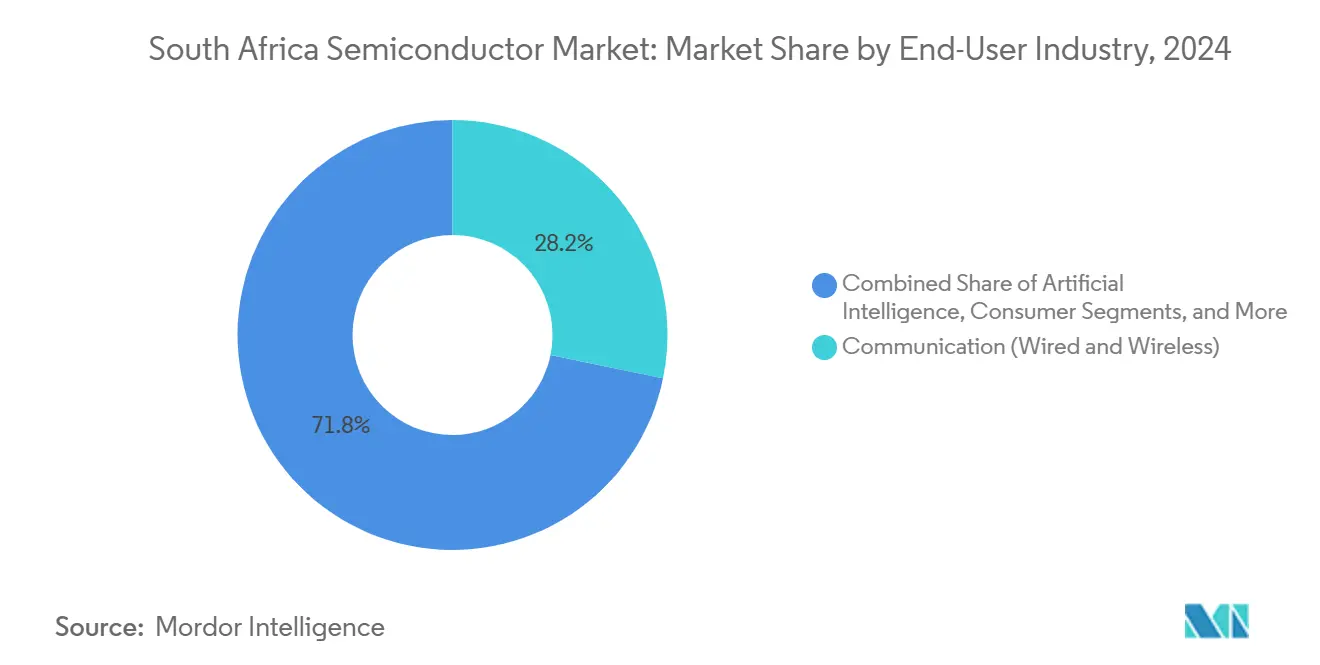
- By end-user industry, Communication accounted for 28.22% of the South Africa semiconductor market size in 2024, while Artificial Intelligence applications are advancing at an 8% CAGR through 2030.
South Africa Semiconductor Market Trends and Insights
Drivers Impact Analysis*
| Driver | (~) % Impact on CAGR Forecast | Geographic Relevance | Impact Timeline |
|---|---|---|---|
| Automotive electronics surge under SAAM 2035 | +1.8% | National, with concentration in Gauteng and Eastern Cape automotive hubs | Medium term (2-4 years) |
| 5G network densification and device upgrade cycle | +1.2% | National, prioritizing urban centers and mining regions | Short term (≤ 2 years) |
| Growing consumer electronics penetration | +0.9% | National, with higher adoption in metropolitan areas | Medium term (2-4 years) |
| National AI Strategy catalysing AI-centric chips | +1.1% | National, with research clusters in Cape Town and Johannesburg | Long term (≥ 4 years) |
| Local-content rules in public procurement | +0.7% | National, affecting government and SOE procurement | Short term (≤ 2 years) |
| Renewable-energy microgrids boosting power devices | +0.8% | National, with focus on rural electrification and mining operations | Medium term (2-4 years) |
| Source: Mordor Intelligence | |||
Automotive Electronics Surge Under SAAM 2035
The South African Automotive Masterplan targets annual vehicle output of 1.4 million units, spurring demand for power-management ICs, sensor arrays, and microcontrollers essential for electrification. New-vehicle sales climbed 15.6% YoY in July 2025, and Mahindra’s memorandum with the Industrial Development Corporation to build a new-energy vehicle plant reflects wider original-equipment-manufacturer (OEM) commitments. [1]naamsa, “July 2025 New-Vehicle Sales Media Release,” naamsa.net Interest-rate cuts lift auto affordability, amplifying electronics penetration per vehicle and sustaining growth for the South Africa semiconductor market.
5G Network Densification and Device Upgrade Cycle
The 2G/3G sunset by December 2027 releases spectrum and prompts device replacements across IoT and industrial automation. The National Data and Cloud Policy emphasizes cloud readiness, driving volume orders for NB-IoT chipsets and power-efficient baseband processors. Operators such as MTN accelerate migration schedules, funneling near-term revenue to semiconductor suppliers embedded in the South Africa semiconductor market.
Growing Consumer-Electronics Penetration
Middle-class expansion raises demand for smartphones, laptops, and smart TVs even as the weaker rand adds 15% to average PC prices. Samsung’s ZAR 280 million Equity Equivalent Investment Programme funds local assembly at Dube TradePort and SME training, creating downstream pull for memory, display driver ICs, and power devices used in final products sold into the South Africa semiconductor market.
National AI Strategy Catalyzing AI-Centric Chips
The Draft National AI Plan aims for 100–300 startups and 5,000 skilled professionals by 2030, channeling capital toward GPUs, AI accelerators, and specialized memory solutions. R54 million allocated to WITS University’s quantum-computing initiative further diversifies chip demand into cryogenic control ICs and isotopically enriched silicon from Pretoria’s Silicon-28 plant, underpinning long-term prospects for the South Africa semiconductor market.
Restraints Impact Analysis*
| Restraint | (~) % Impact on CAGR Forecast | Geographic Relevance | Impact Timeline |
|---|---|---|---|
| Limited local fabrication capacity | -1.4% | National, affecting all semiconductor categories | Long term (≥ 4 years) |
| Electricity supply instability (load-shedding) | -2.1% | National, with severe impact on manufacturing regions | Short term (≤ 2 years) |
| Microelectronics talent shortfall | -0.8% | National, concentrated in technical hubs | Medium term (2-4 years) |
| Rand volatility affecting capex and pricing | -1.2% | National, impacting import-dependent sectors | Short term (≤ 2 years) |
| Source: Mordor Intelligence | |||
Limited Local Fabrication Capacity
Domestic chip production remains negligible; imports outpaced exports by USD 189 million in March 2025 despite a 44.1% export surge to SADC neighbors. [2]Observatory of Economic Complexity, “Semiconductor Devices Trade,” oec.world CSIR research facilities lack commercial-scale tooling, and potential Taiwanese export controls heighten supply-chain risk. Capital-intensive fabs thus stay beyond the near-term horizon, constraining vertical integration in the South Africa semiconductor market.
Electricity Supply Instability (Load-Shedding)
Rolling blackouts cost the economy USD 13 billion in 2023 and trimmed GDP growth to 0.3%. Manufacturing downtime, diesel backup costs, and quality issues erode margins for electronics assemblers and data-center operators, suppressing short-term capacity expansion in the South Africa semiconductor market while prompting interest in power-efficient chips and on-site microgrids.
*Our forecasts treat driver/restraint impacts as directional, not additive. The impact forecasts reflect baseline growth, mix effects, and variable interactions.
Segment Analysis
By Device Type: Integrated Circuits Drive Market Leadership
Integrated Circuits claimed 85.04% of the 2024 value, cementing their weight in the South Africa semiconductor market. Analog and microcontroller families benefit from automotive electrification and industrial automation, while logic and memory address rising cloud workloads. Sensors and MEMS, though just 4.6% by revenue, post an 8.1% CAGR on ADAS adoption. Discrete power devices support renewable microgrids, highlighted by CSIR as Africa’s most economical energy path.
Mature nodes above 28 nm satisfy automotive reliability standards, whereas emerging AI workloads stimulate limited demand for sub-10 nm logic, sourced mainly from Asian foundries. Local Silicon-28 enrichment offers niche material input, exemplifying how upstream specialty materials can integrate into the South Africa semiconductor market size trajectory toward 2030.


By Business Model: IDM Dominance Faces Fabless Challenge
IDMs held 75.3% revenue in 2024, thanks to localized subsidiaries of global giants that ensure supply continuity, technical support, and post-sales service. Samsung’s expansion at Dube TradePort typifies this vertically integrated presence.
Fabless vendors grow at 7.5% CAGR, capitalizing on ARM’s (E³)NGAGE labs and local content procurement rules. South African Micro-Electronic Systems and Azoteq ship mixed-signal ASICs for smart-lighting and medical sensors, proving that agile design paired with overseas fabrication can unlock high-margin niches inside the South Africa semiconductor market.
By End-User Industry: Communication Leads While AI Accelerates
Communication applications represented 28.22% of spending in 2024 due to 5G rollouts and the mandated 2G/3G shutdown. Replacement of legacy devices drives high-volume modem and RF front-end sales.
Artificial Intelligence follows as the fastest-growing vertical with an 8% CAGR, fueled by the government’s ZAR 70 billion investment target and initiatives like the AI Institute of South Africa. Data-center modernization, automotive ADAS, and fintech analytics ensure diversified chip uptake, sustaining depth in the South Africa semiconductor market share landscape.
Geography Analysis
Gauteng anchors the South Africa semiconductor market as home to Pretoria’s CSIR Nanotechnology Centre and major corporate headquarters in Johannesburg. Proximity to universities and research clusters feeds engineering talent pipelines. Cape Town, Western Cape, hosts vibrant startups and design houses that leverage the port’s logistical connectivity for export packaging and testing.
KwaZulu-Natal’s Dube TradePort, adjacent to King Shaka airport, houses Samsung’s expanded assembly lines, illustrating how special economic zones accelerate electronics value-addition. Eastern Cape’s automotive corridor around Port Elizabeth benefits from SAAM 2035 goals, creating localized demand for power devices and infotainment ICs.
Cross-border trade under AfCFTA fuels export growth: semiconductor shipments to Zimbabwe, Zambia, and Mozambique rose 260%, 220%, and 244% respectively, in March 2025. [3]Observatory of Economic Complexity, “Semiconductor Devices Trade,” oec.world Despite macro risks—persistent load-shedding and currency volatility—the geographic spread of design, assembly, and specialized materials sites sustains resilience in the wider South Africa semiconductor market size outlook.
Competitive Landscape
The South Africa semiconductor market exhibits moderate concentration. Global IDMs such as Infineon, STMicroelectronics, NXP, ON Semiconductor, and Texas Instruments hold bulk revenue through automotive and industrial portfolios. Samsung’s USD 16.5 billion 2 nm foundry contract with Tesla exemplifies scale advantages that translate to local supply reliability. [4]Korea JoongAng Daily, “Samsung foundry bags USD 16.5 billion Tesla order,” koreajoongangdaily.joins.com
Fabless challengers South African Micro-Electronic Systems and Azoteq target capacitive sensing, energy-harvesting ASICs, and Bluetooth accessories. Etion Create’s high-performance computing boards earned international renewable-energy contracts, proving global competitiveness.
Strategic moves include STMicro’s USD 950 million sensor-business acquisition from NXP to deepen automotive coverage, and Infineon’s Malaysian SiC megafab that eases global supply tightness for power devices shipped to South Africa. Local content procurement rules (80/20 and 90/10 preference systems) provide entry points for transformed suppliers, fostering a balanced competitive field.
South Africa Semiconductor Industry Leaders
South African Micro-Electronic Systems (Pty) Ltd. (Labat Africa Ltd.)
Azoteq (Pty) Ltd.
Etion Create (Pty) Ltd.
Infineon Technologies Africa (Pty) Ltd.
STMicroelectronics (Pty) Ltd.
- *Disclaimer: Major Players sorted in no particular order

Recent Industry Developments
- July 2025: Samsung Electronics secured a USD 16.5 billion foundry contract with Tesla to supply 2 nm chips through 2033.
- July 2025: STMicroelectronics agreed to buy part of NXP’s sensor unit for up to USD 950 million.
- June 2025: Cabinet earmarked ZAR 1 trillion for infrastructure, including electronics assembly facilities.
- March 2025: Broadcom posted record USD 14.9 billion Q1 FY 2025 revenue as AI chips surged 77%.
- February 2025: Mahindra signed an MoU to explore a South African NEV assembly plant.
- November 2024: ASP Isotopes completed Silicon-28 enrichment facility commissioning in Pretoria.


South Africa Semiconductor Market Report Scope
| Discrete Semiconductors | Diodes | ||
| Transistors | |||
| Power Transistors | |||
| Rectifier and Thyristor | |||
| Other Discrete Devices | |||
| Optoelectronics | Light-Emitting Diodes (LEDs) | ||
| Laser Diodes | |||
| Image Sensors | |||
| Optocouplers | |||
| Other Device Types | |||
| Sensors and MEMS | Pressure | ||
| Magnetic Field | |||
| Actuators | |||
| Acceleration and Yaw Rate | |||
| Temperature and Others | |||
| Integrated Circuits | By IC Type | Analog | |
| Micro | Microprocessors (MPU) | ||
| Microcontrollers (MCU) | |||
| Digital Signal Processors | |||
| Logic | |||
| Memory | |||
| By Technology Node (Shipment Volume Not Applicable) | < 3 nm | ||
| 3 nm | |||
| 5 nm | |||
| 7 nm | |||
| 16 nm | |||
| 28 nm | |||
| > 28 nm | |||
| IDM |
| Design/Fabless Vendor |
| Automotive |
| Communication (Wired and Wireless) |
| Consumer |
| Industrial |
| Computing/Data Storage |
| Data Centre |
| Artificial Intelligence |
| Government (Aerospace and Defence) |
| Other End-user Industries |
| By Device Type (Shipment Volume for Device Type is Complementary) | Discrete Semiconductors | Diodes | ||
| Transistors | ||||
| Power Transistors | ||||
| Rectifier and Thyristor | ||||
| Other Discrete Devices | ||||
| Optoelectronics | Light-Emitting Diodes (LEDs) | |||
| Laser Diodes | ||||
| Image Sensors | ||||
| Optocouplers | ||||
| Other Device Types | ||||
| Sensors and MEMS | Pressure | |||
| Magnetic Field | ||||
| Actuators | ||||
| Acceleration and Yaw Rate | ||||
| Temperature and Others | ||||
| Integrated Circuits | By IC Type | Analog | ||
| Micro | Microprocessors (MPU) | |||
| Microcontrollers (MCU) | ||||
| Digital Signal Processors | ||||
| Logic | ||||
| Memory | ||||
| By Technology Node (Shipment Volume Not Applicable) | < 3 nm | |||
| 3 nm | ||||
| 5 nm | ||||
| 7 nm | ||||
| 16 nm | ||||
| 28 nm | ||||
| > 28 nm | ||||
| By Business Model | IDM | |||
| Design/Fabless Vendor | ||||
| By End-user Industry | Automotive | |||
| Communication (Wired and Wireless) | ||||
| Consumer | ||||
| Industrial | ||||
| Computing/Data Storage | ||||
| Data Centre | ||||
| Artificial Intelligence | ||||
| Government (Aerospace and Defence) | ||||
| Other End-user Industries | ||||


Key Questions Answered in the Report
What is the current size and growth rate of the South Africa semiconductor market?
The market stands at USD 1.85 billion in 2025 and is projected to grow at 6.60% CAGR to reach USD 2.55 billion by 2030.
Which device category dominates chip demand in South Africa?
Integrated Circuits account for 85.04% of 2024 revenue, driven by automotive electrification and cloud-infrastructure investments.
How will SAAM 2035 affect semiconductor demand?
The plan’s 1.4 million-vehicle production goal boosts power-management ICs, sensors, and microcontrollers needed for electric and connected vehicles.
What role does load-shedding play in shaping semiconductor strategies?
Frequent blackouts raise interest in power-efficient chips and microgrid controllers but also discourage capital-intensive local fabrication.
Which business model is growing fastest among local suppliers?
Design/Fabless Vendors are expanding at 7.5% CAGR as South African firms leverage global foundries and local content procurement rules.
Page last updated on:


