Industrial Semiconductor Market Size and Share
Market Overview
| Study Period | 2019 - 2030 |
|---|---|
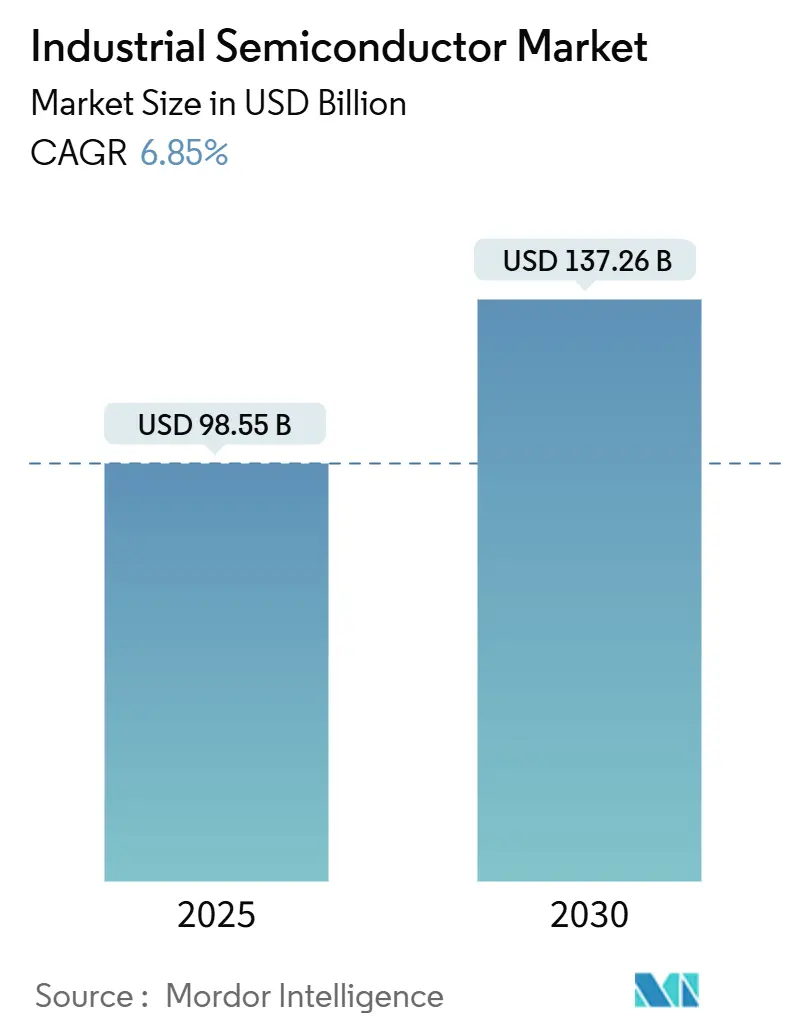
| Market Size (2025) | USD 98.55 Billion |
| Market Size (2030) | USD 137.26 Billion |
| Growth Rate (2025 - 2030) | 6.85% CAGR |
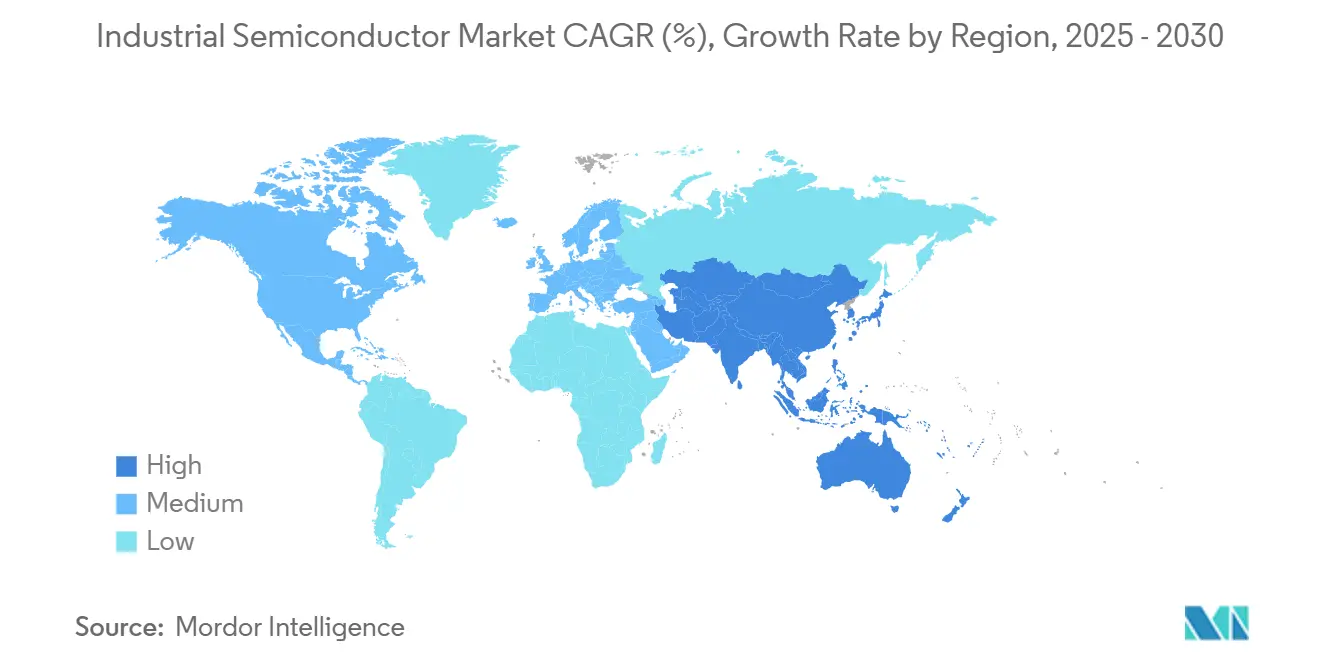
| Fastest Growing Market | Asia Pacific |
| Largest Market | Asia Pacific |
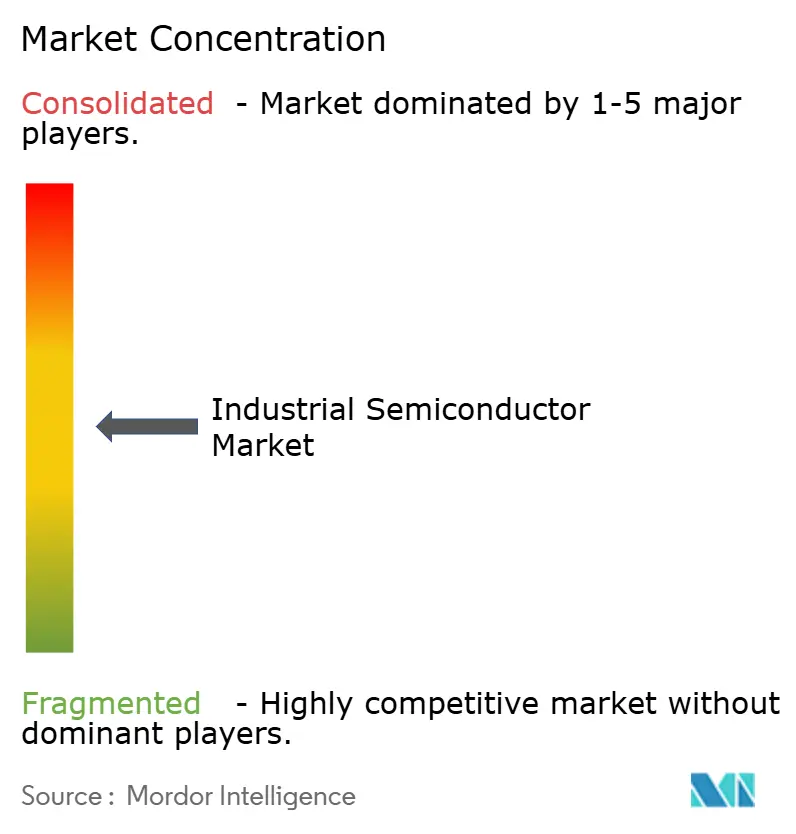
| Market Concentration | Medium |
Major Players
*Disclaimer: Major Players sorted in no particular order Image © Mordor Intelligence. Reuse requires attribution under CC BY 4.0. |
|
Industrial Semiconductor Market Analysis by Mordor Intelligence
The industrial semiconductor market size stands at USD 98.55 billion in 2025 and is projected to reach USD 137.26 billion by 2030, registering a 6.85% CAGR over the forecast period. Expanding investments in factory automation, rapid uptake of on-device AI inference, and sovereign incentives that localize production capacity continue to lift demand for high-performance logic, power, and sensing devices across all regions. Semiconductor content per automated production line rose 40% since 2020, reflecting the shift toward predictive maintenance, real-time optimization, and distributed intelligence architectures that call for latency below 10 milliseconds at the factory edge. The industrial semiconductor market now finds growth opportunities in wide-bandgap materials such as SiC and GaN that improve energy efficiency, as well as in newer chiplet architectures that streamline heterogeneous integration. Rising geopolitical scrutiny, evidenced by the CHIPS and Science Act’s USD 52.7 billion program and Asia-Pacific’s multi-billion-dollar capacity expansions, underpins a bipolar supply chain that reduces single-point-of-failure risk while increasing redundancy costs.[1]U.S. Department of Commerce, “CHIPS for America Proposed Funding Sites,” nist.gov
Key Report Takeaways
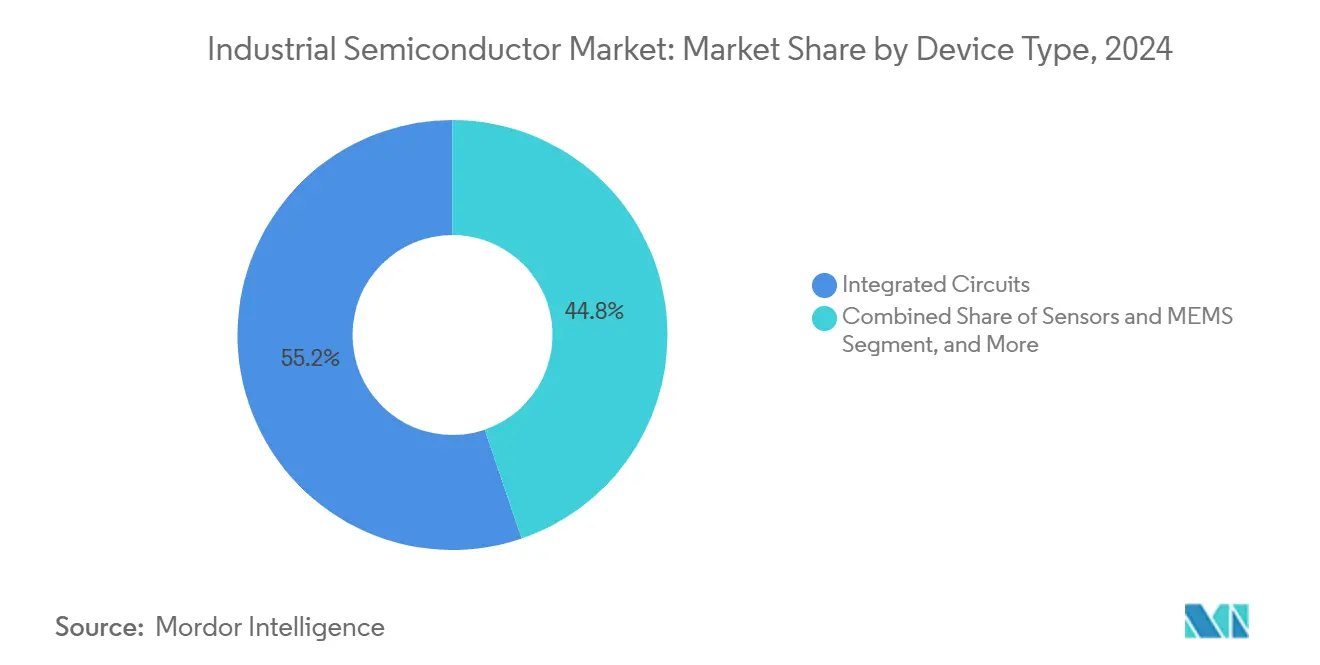
- By device type, integrated circuits led with 55.21% of the industrial semiconductor market share in 2024. By device type, sensors and MEMS are set to advance at a 9.67% CAGR through 2030.
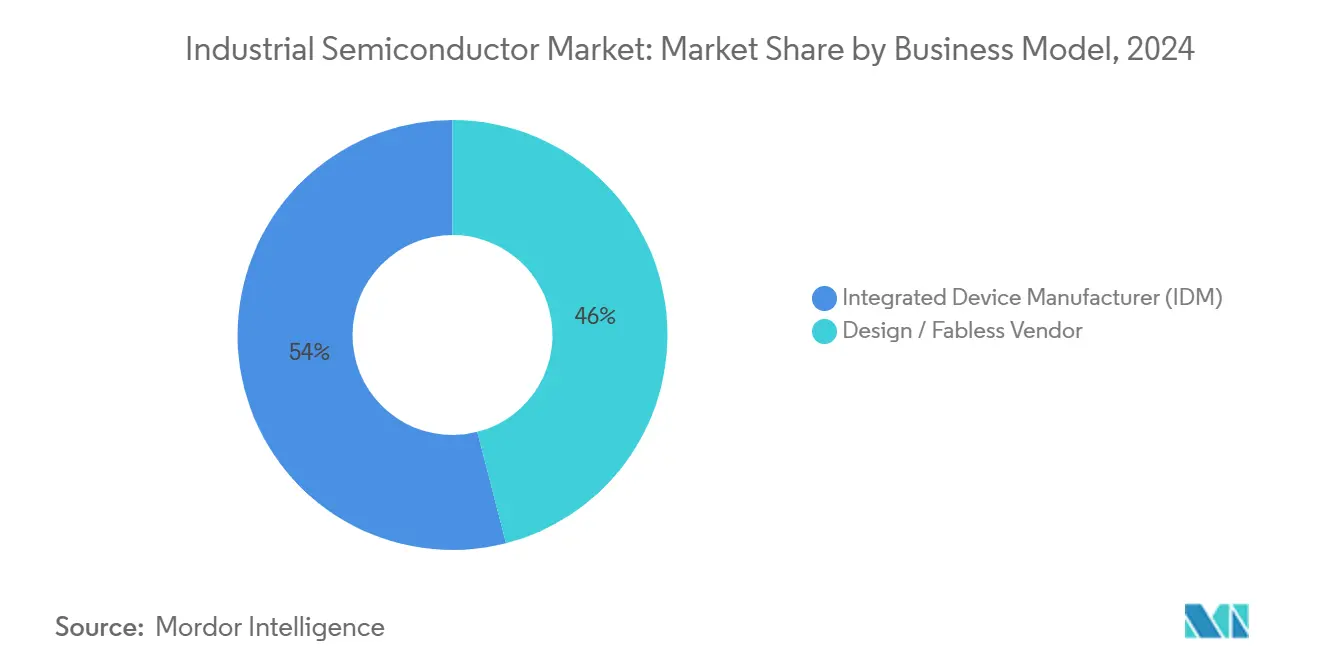
- By business model, the IDM segment retained 54.00% share of the industrial semiconductor market size in 2024, while design-house and fabless vendors are forecast to grow at 10.21% CAGR to 2030.
- By end-user industry, factory automation and robotics accounted for a 32.00% slice of the industrial semiconductor market size in 2024; industrial IoT devices represent the fastest-rising end-use group at an 8.94% CAGR toward 2030.
Global Industrial Semiconductor Market Trends and Insights
Drivers Impact Analysis*
| Driver | (~) % Impact on CAGR Forecast | Geographic Relevance | Impact Timeline |
|---|---|---|---|
| Rising demand for industrial automation and robotics | +1.20% | Global, with APAC leading adoption | Medium term (2-4 years) |
| Electrification of heavy-duty equipment and vehicles | +0.80% | North America and Europe core, APAC manufacturing | Long term (≥ 4 years) |
| Growth in Industry 4.0-driven sensor deployments | +1.10% | Global, with EU regulatory leadership | Short term (≤ 2 years) |
| Government incentives for energy-efficient power devices | +0.90% | North America and EU, spillover to APAC | Medium term (2-4 years) |
| Surging adoption of SiC/GaN power ICs in harsh environments | +1.30% | Global, with industrial applications focus | Long term (≥ 4 years) |
| Emergence of on-device AI inference in factory edge nodes | +0.60% | APAC core, expanding to North America and EU | Short term (≤ 2 years) |
| Source: Mordor Intelligence | |||
Rising demand for industrial automation and robotics
Collaborative robots now ship with three to five times more sensors and compute elements than traditional articulated units, boosting semiconductor bill-of-materials values across motion control, safety, and vision subsystems. Samsung’s AI-enabled production lines achieved 30% higher wafer yields after deploying defect-detection systems that process more than 10 terabytes of visual data each day, an example of how semiconductor-intensive automation directly raises factory productivity. KUKA’s current robot models integrate 47 discrete semiconductor components versus 23 in 2020, indicating expanded functional requirements in human-machine collaboration. Autonomous mobile robots popular in warehouses now specify LiDAR processors alongside MEMS gyroscopes that must remain calibrated for at least five years. Lam Research’s Dextro system cut wafer processing time by 12% using edge-based AI chips that handle real-time optimization.
Growth in Industry 4.0-driven sensor deployments
EU regulations require predictive maintenance on industrial assets above 500 kW, accelerating demand for low-power sensor ICs that enable continuous health monitoring. Battery-powered wireless nodes using LoRaWAN and 5G achieve 10-year service life owing to ultra-low-leakage microcontrollers, lowering commissioning costs. TDK’s edgeRX Vision platform merges 12 sensor types with on-chip AI, reducing plant bandwidth needs by 85% while keeping response latency below 1 millisecond. Microsoft researchers verified that cellular AI edge processing can deliver sub-millisecond reaction times, removing the need for cloud backhauls in mission-critical loops. The convergence of Time-Sensitive Networking with industrial Ethernet lifts demand for sensor-fusion semiconductors that synchronize data at nanosecond precision.
Government incentives for energy-efficient power devices
The U.S. Department of Commerce awarded TSMC Arizona up to USD 6.6 billion to expand production aimed at AI and automotive logic chips. Analog Devices captured USD 1.2 billion to boost mature-node analog power management output. European Green Deal policies that mandate a 55% carbon reduction by 2030 press industrial OEMs to adopt SiC and GaN devices with 98% efficiency, compared with 92-95% for silicon. Coherent gained USD 49.3 million to scale SiC wafer output, easing raw material constraints. Japan’s USD 13 billion economic security program underwrites domestic production of power semiconductors employed in renewable energy and factory automation.
Surging adoption of SiC and GaN power ICs in harsh environments
SiC modules maintain performance across –40 °C to +200 °C, delivering 15-20% energy savings and halving cooling overhead in industrial motor drives. Infineon earmarked USD 5 billion for SiC capacity through 2030 to satisfy demand from heavy-duty electrification. The aerospace sector’s GaN qualifications fast-track industrial uptake because military-grade parts already meet stringent durability requirements. Wolfspeed’s USD 6.5 billion North Carolina facility targets applications where 3-5 times higher power density lowers form factors and installation costs. ON Semiconductor’s USD 115 million buyout of Qorvo’s SiC JFET line supports data-center power supplies that trim energy bills by millions per site.
Restraints Impact Analysis*
| Restraint | (~) % Impact on CAGR Forecast | Geographic Relevance | Impact Timeline |
|---|---|---|---|
| Supply-chain fragility and chip shortages | -0.70% | Global, with acute impacts in APAC manufacturing | Short term (≤ 2 years) |
| High capital expenditure for advanced nodes (<7 nm) | -0.40% | Global, concentrated in leading-edge fabs | Long term (≥ 4 years) |
| Industrial OEM reluctance to re-qualify legacy nodes | -0.50% | North America and Europe, with automotive focus | Medium term (2-4 years) |
| Cyber-security liability for connected industrial devices | -0.30% | Global, with regulatory emphasis in EU and North America | Short term (≤ 2 years) |
| Source: Mordor Intelligence | |||
Supply-chain fragility and chip shortages
Hurricane Helene interrupted Spruce Pine quartz output, jeopardizing 80% of semiconductor-grade silicon feedstock and triggering global fab slowdowns.[2]SEMI, “Semiconductor Equipment and Materials International Market Reports,” semi.org Concentration risks remain high as TSMC produced 92% of sub-10 nm logic in 2024, making the industrial semiconductor market vulnerable to regional disruptions. Component lifecycles shrank to three-five years, forcing OEMs into frequent redesigns that strain validation budgets. Labor shortages intensified at TSMC Arizona, where staffing costs run 30% above Taiwan levels. The Russia-Ukraine conflict quadrupled neon gas prices used in lithography, prompting a two-year qualification push for alternate suppliers.
High capital expenditure for advanced nodes (<7 nm)
TSMC’s prospective 2 nm Arizona fab requires nearly USD 40 billion, reflecting costs that only a handful of companies can shoulder. EUV tools now cost USD 300 million, while ASML’s High-NA systems approach USD 400 million with stringent vibration limits. Return on investment demands monthly volumes over 100,000 wafers, narrowing participation. Advanced packaging plants for chiplets add USD 2-5 billion, squeezing margins for new entrants. Intel’s IDM 2.0 model now outsources leading-edge nodes to TSMC and reserves internal capacity for mature processes to conserve capital.
*Our forecasts treat driver/restraint impacts as directional, not additive. The impact forecasts reflect baseline growth, mix effects, and variable interactions.
Segment Analysis
By Device Type: Integrated circuits sustain leadership while sensors surge
Integrated circuits held 55.21% of the industrial semiconductor market share in 2024, supported by single-chip PLCs, AI accelerators, and motor-control MCUs that centralize functions once spread across discrete logic. Within this group, the industrial semiconductor market size for power management ICs exceeded USD 30 billion as of 2025. Chiplet packaging lets designers pair leading-edge compute tiles with mature-node analog dies in one module, balancing performance and cost. Adoption of neuromorphic processors such as Syntiant’s NDP120 signals demand for ultra-low-power analytics at the edge, where milliwatt envelopes are essential for battery-operated sensors.
Sensors and MEMS stand out with a 9.67% CAGR to 2030, fuelled by Industry 4.0 compliance and regulatory pushes for predictive maintenance. Pressure, vibration, and time-of-flight sensors mount directly on machines and stream real-time condition data to edge gateways. LoRa and 5G connectivity combined with on-sensor AI cuts cloud bandwidth by up to 85%, saving recurring costs. Optoelectronics benefit from machine-vision proliferation in quality inspection, while discrete such as SiC MOSFETs gain share inside high-frequency drives that target 98% efficiency. Overall, device diversification supports steady expansion of the industrial semiconductor market.


By Business Model: Design houses capture growth momentum
IDM companies held 54.00% of the industrial semiconductor market in 2024, underpinned by complete control of wafer, packaging, and software stacks that appeal to safety-critical sectors. However, fabless and design-only firms grow faster at 10.21% CAGR because they sidestep USD 20-30 billion fab investments and instead focus on differentiated IP. Partnerships such as Femtosense and ABOV demonstrate co-development workflows where chiplets from multiple vendors integrate seamlessly, shortening product cycles from years to months. Emerging chiplet marketplaces foster interoperability, reinforcing the asset-light model’s appeal.
At the same time, geopolitical stress drives some fabless firms to sign multi-sourced foundry agreements that include domestic fabs despite higher cost. IDMs respond by spinning off foundry units to monetize excess capacity and by acquiring niche players, exemplified by Infineon’s GaN Systems deal, to expand into fast-growing wide-bandgap sectors. This hybridization blurs traditional boundaries yet preserves a balanced competitive field within the industrial semiconductor market.
By End-user Industry: Industrial IoT devices accelerate adoption
Factory automation and robotics represented 32.00% of the industrial semiconductor market size in 2024, powered by cobots, servo drives, and human-machine interface panels that embed high-accuracy motor-control and AI vision. Energy and power infrastructure increasingly incorporates smart-grid controllers built on SiC power modules that manage bi-directional flows from renewable sources. Automotive and transportation segments deploy industrial-grade MCUs in electric buses and heavy-duty trucks, where semiconductor content per vehicle tripled since 2020.
Industrial IoT devices exhibit the highest growth at 8.94% CAGR, reflecting the migration of analytics to edge nodes for latency and bandwidth efficiency. Healthcare equipment adds demand for high-reliability ASICs that meet IEC 60601 standards, whereas aerospace and defense command premium prices for radiation-hardened parts. Showcase implementations such as Bosch Dresden’s 10,000-sensor smart fab prove that semiconductor manufacturing itself is a prime use case for edge intelligence. Collectively, these applications reinforce the robust outlook for the industrial semiconductor market.
Geography Analysis
Asia-Pacific retained 34.26% of the industrial semiconductor market share in 2024 and grows fastest at 8.45% CAGR to 2030. China’s USD 143 billion capacity push emphasizes mature nodes and power discretes, while South Korea’s USD 471 billion Gyeonggi cluster integrates fab, packaging, and research. Taiwan’s TSMC maintains technology leadership and is also investing USD 65 billion in three Arizona fabs, underscoring a dual-continent strategy that hedges geopolitical exposure. Japan’s Rapidus aims for 2 nm production by 2027 with USD 13 billion backing, reinforcing the region’s vertical ecosystem.
North America’s renaissance gains momentum from the CHIPS and Science Act’s USD 52.7 billion incentives that prioritize industrial and automotive nodes. Intel’s USD 20 billion Ohio fabs and GlobalFoundries’ New York expansion focus on 300 mm lines tuned for wide-bandgap devices. Samsung’s USD 37 billion Texas portfolio and Texas Instruments’ USD 30 billion Sherman site establish an integrated corridor from wafer to assembly. While labour costs remain higher than Asia, productivity improvements through automation offset part of the gap.
Europe channels USD 47 billion under the European Chips Act to double its global production share to 20% by 2030. Germany anchors SiC investments, with Infineon spending USD 5 billion to expand in Dresden. Bosch leverages CHIPS Act funds for silicon carbide manufacturing, supporting the continent’s automotive and industrial heritage. Although Europe still depends on Asian foundries for leading-edge logic, it excels in power electronics and energy-efficient solutions, aligning with the EU’s net-zero agenda.[3]European Commission, “European Chips Act Implementation,” europa.eu

Competitive Landscape
Competition in the industrial semiconductor market intensifies as 47 venture-backed entrants secured more than USD 100 million each during 2024. Traditional leaders diversify into SiC and GaN to protect share, evidenced by Infineon’s USD 830 million GaN acquisition. Newcomers exploit advanced packaging to assemble heterogeneous systems without owning leading-edge fabs. Patent filings for power semiconductors surged 340% in 2024, showing an arms race in materials and thermal management.
Vertical integration rises as automotive and industrial OEMs buy semiconductor assets to secure supply. SkyWater’s acquisition of Infineon’s 200 mm Austin fab illustrates the move to control foundational nodes. Established IDMs respond by forming ecosystem partnerships around chiplet standards, while EDA houses such as Synopsys broaden portfolios through high-value acquisitions like Ansys to deliver silicon-to-system platforms. Capital intensity remains a barrier, but design innovation at mature nodes keeps the field moderately fragmented.
Long-term leadership will depend on system-level optimization rather than raw process node supremacy. Vendors capable of integrating sensors, AI accelerators, power stages, and secure connectivity in one package stand to gain. As edge-centric architectures proliferate, the industrial semiconductor market rewards firms that offer turnkey modules over component-only catalogs.[4]IEEE, “Surge in Wide-Bandgap Semiconductor Patents,” ieee.org
Industrial Semiconductor Industry Leaders
-
Texas Instruments Incorporated
-
Infineon Technologies AG
-
Analog Devices, Inc.
-
STMicroelectronics N.V.
-
NXP Semiconductors N.V.
- *Disclaimer: Major Players sorted in no particular order

Recent Industry Developments
- April 2025: Infineon Technologies acquired Marvell’s Automotive Ethernet unit for USD 2.5 billion.
- February 2025: SkyWater Technology bought Infineon’s 200 mm Austin fab, preserving nearly 1,000 jobs.
- February 2025: 3M joined the US-JOINT Consortium to accelerate advanced packaging.
- January 2025: ON Semiconductor closed its USD 115 million purchase of Qorvo’s SiC JFET business.


Global Industrial Semiconductor Market Report Scope
| Discrete Semiconductors | Diodes | ||
| Transistors | |||
| Power Transistors | |||
| Rectifier and Thyristor | |||
| Other Discrete Devices | |||
| Optoelectronics | Light-Emitting Diodes (LEDs) | ||
| Laser Diodes | |||
| Image Sensors | |||
| Optocouplers | |||
| Other Device Types | |||
| Sensors and MEMS | Pressure | ||
| Magnetic Field | |||
| Actuators | |||
| Acceleration and Yaw Rate | |||
| Temperature and Others | |||
| Integrated Circuits | By Integrated Circuit Type | Analog | |
| Micro | Microprocessors (MPU) | ||
| Microcontrollers (MCU) | |||
| Digital Signal Processors | |||
| Logic | |||
| Memory | |||
| By Technology Node (Shipment Volume Not Applicable) | Less than 3nm | ||
| 3nm | |||
| 5nm | |||
| 7nm | |||
| 16nm | |||
| 28nm | |||
| 28nm | |||
| Integrated Device Manufacturer (IDM) |
| Design / Fabless Vendor |
| Factory Automation and Robotics |
| Energy and Power |
| Automotive and Transportation |
| Aerospace and Defense |
| Healthcare Equipment |
| Industrial IoT Devices |
| Others |
| North America | United States | |
| Canada | ||
| Mexico | ||
| South America | Brazil | |
| Argentina | ||
| Rest of South America | ||
| Europe | Germany | |
| France | ||
| United Kingdom | ||
| Italy | ||
| Spain | ||
| Russia | ||
| Rest of Europe | ||
| Asia Pacific | China | |
| Japan | ||
| South Korea | ||
| India | ||
| ASEAN-5 | ||
| Australia and New Zealand | ||
| Rest of Asia Pacific | ||
| Middle East and Africa | Middle East | Saudi Arabia |
| United Arab Emirates | ||
| Turkey | ||
| Rest of Middle East | ||
| Africa | South Africa | |
| Nigeria | ||
| Rest of Africa | ||
| By Device Type (Shipment Volume for Device Type is Complementary) | Discrete Semiconductors | Diodes | ||
| Transistors | ||||
| Power Transistors | ||||
| Rectifier and Thyristor | ||||
| Other Discrete Devices | ||||
| Optoelectronics | Light-Emitting Diodes (LEDs) | |||
| Laser Diodes | ||||
| Image Sensors | ||||
| Optocouplers | ||||
| Other Device Types | ||||
| Sensors and MEMS | Pressure | |||
| Magnetic Field | ||||
| Actuators | ||||
| Acceleration and Yaw Rate | ||||
| Temperature and Others | ||||
| Integrated Circuits | By Integrated Circuit Type | Analog | ||
| Micro | Microprocessors (MPU) | |||
| Microcontrollers (MCU) | ||||
| Digital Signal Processors | ||||
| Logic | ||||
| Memory | ||||
| By Technology Node (Shipment Volume Not Applicable) | Less than 3nm | |||
| 3nm | ||||
| 5nm | ||||
| 7nm | ||||
| 16nm | ||||
| 28nm | ||||
| 28nm | ||||
| By Business Model | Integrated Device Manufacturer (IDM) | |||
| Design / Fabless Vendor | ||||
| By End-user Industry | Factory Automation and Robotics | |||
| Energy and Power | ||||
| Automotive and Transportation | ||||
| Aerospace and Defense | ||||
| Healthcare Equipment | ||||
| Industrial IoT Devices | ||||
| Others | ||||
| By Region | North America | United States | ||
| Canada | ||||
| Mexico | ||||
| South America | Brazil | |||
| Argentina | ||||
| Rest of South America | ||||
| Europe | Germany | |||
| France | ||||
| United Kingdom | ||||
| Italy | ||||
| Spain | ||||
| Russia | ||||
| Rest of Europe | ||||
| Asia Pacific | China | |||
| Japan | ||||
| South Korea | ||||
| India | ||||
| ASEAN-5 | ||||
| Australia and New Zealand | ||||
| Rest of Asia Pacific | ||||
| Middle East and Africa | Middle East | Saudi Arabia | ||
| United Arab Emirates | ||||
| Turkey | ||||
| Rest of Middle East | ||||
| Africa | South Africa | |||
| Nigeria | ||||
| Rest of Africa | ||||


Key Questions Answered in the Report
What is the industrial semiconductor market growth outlook to 2030?
The market is forecast to expand from USD 98.55 billion in 2025 to USD 137.26 billion by 2030, translating to a 6.85% CAGR.
Which region leads in revenue today?
Asia-Pacific holds 34.26% of global revenue thanks to large-scale investments in China, South Korea, Taiwan, and Japan.
Which device category grows fastest?
Sensors and MEMS post the highest growth at 9.67% CAGR, fueled by Industry 4.0 predictive maintenance mandates.
Why are SiC and GaN devices gaining traction?
Wide-bandgap materials deliver 15-20% energy savings and endure temperatures up to +200 °C, making them ideal for harsh industrial environments.
How does government policy affect supply?
Incentives like the U.S. CHIPS and Science Act and the European Chips Act channel more than USD 100 billion into new fabs, reshaping regional supply resilience.
What is the main supply-chain risk?
Dependence on single-source materials such as Spruce Pine quartz and concentrated sub-10 nm production in Taiwan pose continued vulnerability.
Page last updated on:


