Semiconductor Fabless Market Size and Share
Market Overview
| Study Period | 2019 - 2030 |
|---|---|
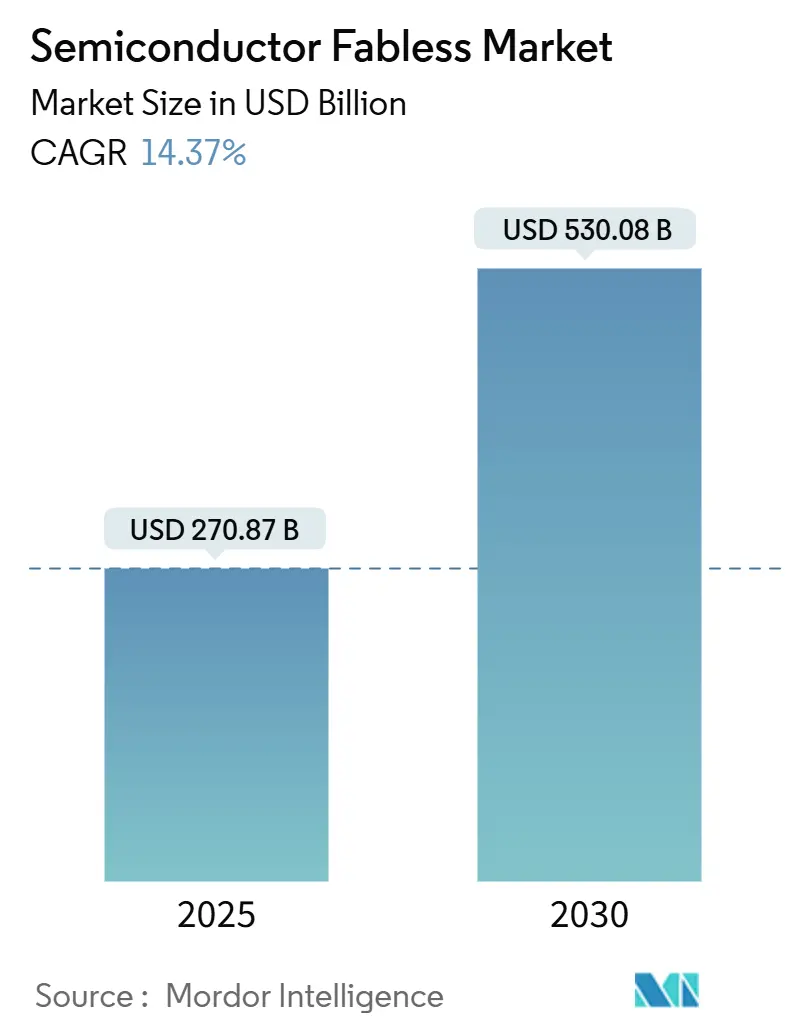
| Market Size (2025) | USD 270.87 Billion |
| Market Size (2030) | USD 530.08 Billion |
| Growth Rate (2025 - 2030) | 14.37% CAGR |
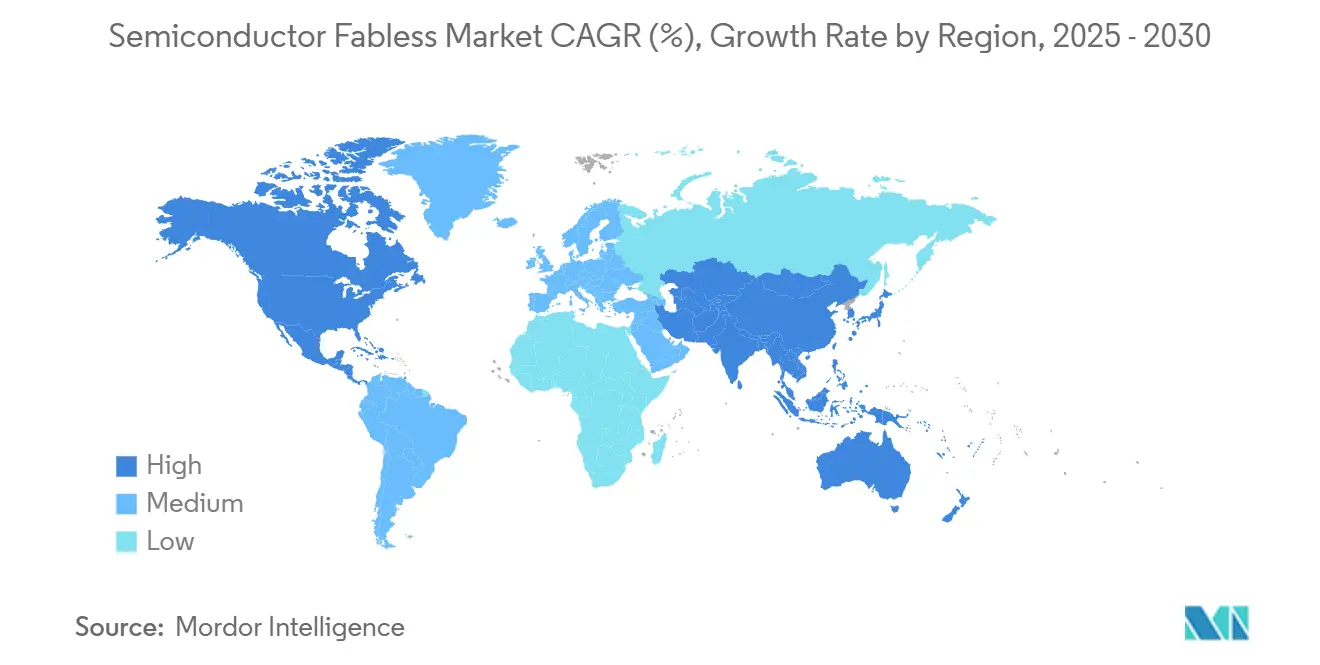
| Fastest Growing Market | North America |
| Largest Market | Asia Pacific |
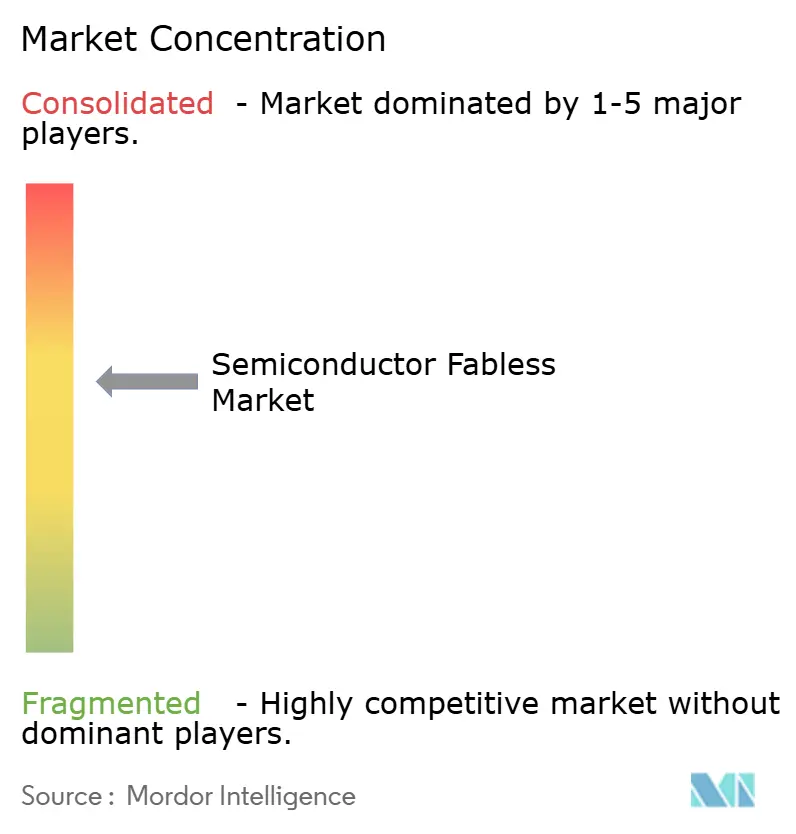
| Market Concentration | Medium |
Major Players
*Disclaimer: Major Players sorted in no particular order Image © Mordor Intelligence. Reuse requires attribution under CC BY 4.0. |
|
Semiconductor Fabless Market Analysis by Mordor Intelligence
The semiconductor fabless market size reached USD 270.87 billion in 2025 and is projected to increase to USD 530.08 billion by 2030, growing at a 14.37% CAGR. Rising demand for generative-AI compute, electric-vehicle power electronics, and next-generation connectivity chips keeps capital flowing toward specialized design houses that rely on external foundries for scale. The tight integration of intellectual-property blocks, chiplet packaging, and hardware-software co-optimization has transformed fabless companies into the principal innovation engine of the broader semiconductor value chain. Growing complexity in artificial-intelligence workloads is accelerating the migration to sub-7 nm nodes and advanced 2.5D packaging, while national subsidy programs are encouraging regional design hubs. At the same time, supply-chain geopolitics and emerging automotive safety mandates are reshaping customer qualification timelines and intensifying the race for long-term foundry capacity.
Key Report Takeaways
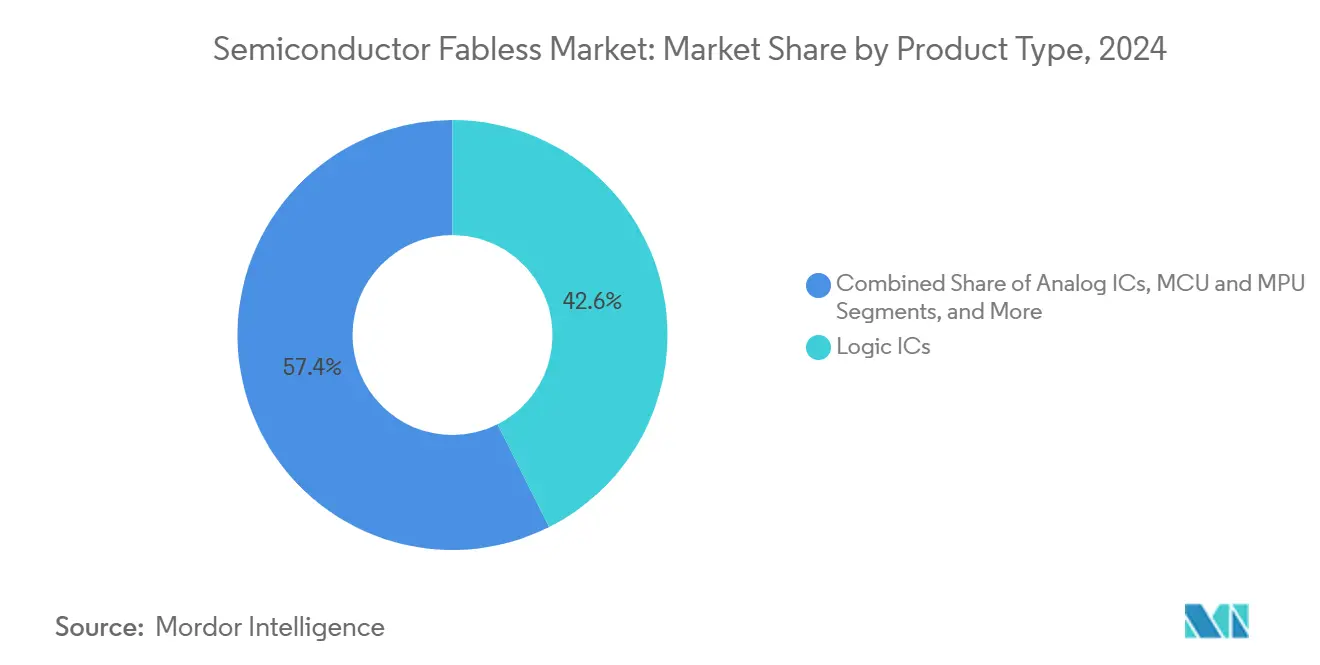
- By product type, logic ICs led the Semiconductor fabless market with a 42.58% share in 2024 and are projected to expand at a 15.28% CAGR through 2030.
- By end-use application, mobile and consumer electronics accounted for 38.63% of the Semiconductor fabless market size in 2024; however, data center and cloud workloads are growing faster at a 15.49% CAGR through 2030.
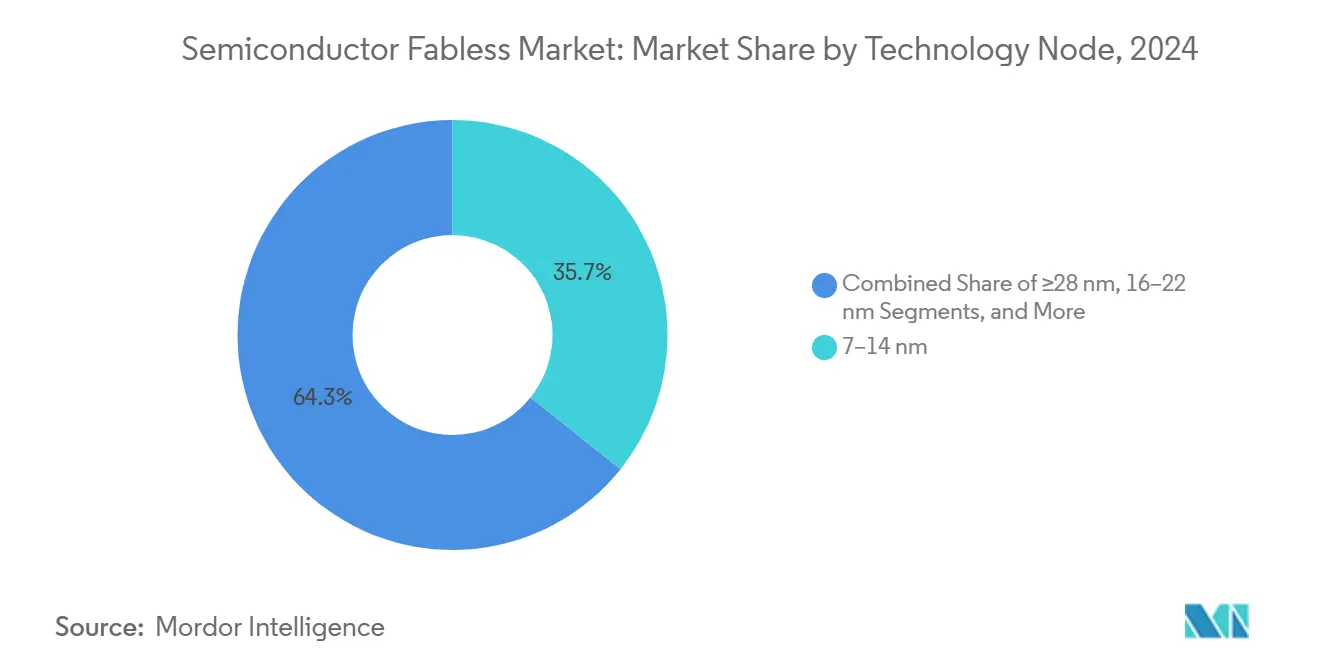
- By technology node, the 7-14 nm class held a 35.73% revenue share of the Semiconductor fabless market in 2024, whereas designs below 7 nm are expected to grow at a 16.28% CAGR as AI and high-performance computing demand rise.
- By customer type, tier-1 OEMs represented 46.29% of the demand of the Semiconductor fabless market in 2024; emerging system makers showed the strongest momentum, with a 14.72% CAGR to 2030.
- By geography, the Asia Pacific retained a 54.01% revenue share of the Semiconductor fabless market in 2024, while North America is poised for the fastest growth, with a 14.39% CAGR between 2025 and 2030.
Note: Market size and forecast figures in this report are generated using Mordor Intelligence’s proprietary estimation framework, updated with the latest available data and insights as of January 2026.
Global Semiconductor Fabless Market Trends and Insights
Drivers Impact Analysis*
| Driver | (~) % Impact on CAGR Forecast | Geographic Relevance | Impact Timeline |
|---|---|---|---|
| Generative AI Compute Super-Cycle Boosting High-End Logic IC Demand | 2.60% | Global, led by North America and East Asia | Short term (≤ 2 years) |
| Automotive Semiconductor Content Expansion in EV and ADAS Platforms | 2.20% | Global, strongest in China, Europe, Japan, and South Korea | Medium term (2-4 years) |
| 5G AND Wi-Fi 7 Transition Raising RF-Front-End IC Volumes | 1.90% | Global, particularly in advanced mobile and networking markets | Short term (≤ 2 years) |
| Government CHIPS-Like Subsidies Accelerating Regional Design Hubs | 1.50% | Global, led by the U.S., Europe, South Korea, Japan, and India | Medium term (2-4 years) |
| Open-Source RISC-V Ecosystem Lowering Entry Barriers for New Design Houses | 1.20% | Global, with rapid adoption across Asia-Pacific, Europe, and North America | Long term (≥ 4 years) |
| AI-Driven EDA Tool Adoption Slashing Tape-Out Time and Cost | 1.00% | Global, concentrated in advanced semiconductor design ecosystems | Medium term (2-4 years) |
| Source: Mordor Intelligence | |||
Generative AI Compute Super-Cycle Boosting High-End Logic IC Demand
Enterprise rollouts of large-language-model services are reshaping data-center architecture, channeling budget toward domain-specific processors, tensor accelerators, and high-bandwidth memory chiplets. SEMI projects that AI silicon will consume 35% of total leading-edge wafer capacity by 2026, prompting fabless leaders to secure multi-year foundry agreements to safeguard their sub-5 nm supply.[1]SEMI, “Leading-Edge Wafer Demand for AI,” semi.org Competitive pressure now hinges on IP portfolios covering transformer-optimized cores, low-precision arithmetic, and on-die interconnect fabrics. These requirements favor firms able to co-design hardware with software stacks, further entrenching the Semiconductor fabless market as the pace-setter for AI innovation.
Automotive Semiconductor Content Expansion in EV and ADAS Platforms
Battery-electric vehicles and Level 2+ driver-assistance systems continue to increase silicon value per car. The Semiconductor Industry Association estimates that automotive semiconductors will post double-digit annual growth through 2029, helped by wide-bandgap power devices and functional-safety-compliant system-on-chips. Fabless suppliers occupy key niches in battery management, domain controller, and sensor fusion designs, winning business from traditional tier-1s that lack agile IP reuse. Long qualification cycles and ISO 26262 documentation create switching costs, locking in design wins and reinforcing the upward trajectory of the Semiconductor fabless market.
5G and Wi-Fi 7 Transition Raising RF-Front-End IC Volumes
The move toward 6 GHz and millimeter-wave spectrum demands intricate filter banks, power-amplifier line-ups and envelope-tracking controllers. Fabless RF specialists are capitalizing on gallium-nitride and gallium-arsenide processes to deliver higher efficiency at elevated frequencies. The resulting bill-of-materials uplift in both smartphones and enterprise access points is adding a fresh revenue layer, particularly in Asia-Pacific manufacturing hubs where most final assembly occurs. These dynamics keep RF and mixed-signal houses integral to the Semiconductor fabless market growth narrative.
Government CHIPS-Like Subsidies Accelerating Regional Design Hubs
North America’s CHIPS and Science Act sets aside USD 52 billion for domestic fabrication and R&D grants, while the European Chips Act allocates EUR 43 billion (USD 48.6 billion) to fortify continental supply security. Subsidies lower entry barriers for start-ups and prompt multinationals to establish satellite design centers, spreading the Semiconductor fabless market network beyond its historical Asia-Pacific core. Over the long term, distributed R&D footprints are expected to lift regional talent pools and diversify risk exposure.
Restraints Impact Analysis*
| Restraint | (~) % Impact on CAGR Forecast | Geographic Relevance | Impact Timeline |
|---|---|---|---|
| Acute Advanced-Packaging Capacity Shortage | -1.7% | Global, with acute constraints in Asia Pacific | Medium term (2-4 years) |
| Geopolitical Export Controls Limiting Access to <7 nm Foundry Nodes | -2.3% | China primarily, with secondary effects on global supply chains | Long term (≥ 4 years) |
| Design-Talent Shortfall and Rising Labor Costs | -1.2% | North America and Europe primarily | Long term (≥ 4 years) |
| Increasing Design-for-Reliability Burden in Automotive and Medical SoCs | -0.9% | Global, with concentration in automotive-heavy regions | Medium term (2-4 years) |
| Source: Mordor Intelligence | |||
Acute Advanced-Packaging Capacity Shortage
ASE Group reports that utilization for 2.5D interposers and fan-out wafer-level packaging remains above 95%, with lead times extending beyond six months. AI accelerators and chiplet-based network processors require these formats, so shortages translate into allocation battles and premium pricing. Fabless firms lacking captively reserved lines must redesign around less advanced packages or delay ramps, trimming immediate revenue potential for the Semiconductor fabless market.
Geopolitical Export Controls Limiting Access to <7 nm Foundry Nodes
U.S. regulations enacted in 2024 restrict the sale of extreme-ultraviolet equipment and advanced design-software licenses to certain Chinese entities.[2] Center for Strategic and International Studies, “Implications of U.S. Export Controls on Advanced Nodes,” csis.orgConstrained access impedes competitive parity in high-performance computing and AI edge devices, segmenting the Semiconductor fabless market into two technology strata. Global players continue to push 3 nm and below, while affected Chinese companies scale volumes on mature nodes, intensifying price competition in legacy segments.
*Our forecasts treat driver/restraint impacts as directional, not additive. The impact forecasts reflect baseline growth, mix effects, and variable interactions.
Segment Analysis
By Product Type: Logic IC Dominance Sustained by AI Acceleration
Logic IC revenue represented the largest slice of the Semiconductor fabless market in 2024 at 42.58%. The segment’s 15.28% CAGR through 2030 outpaces every other product class as demand for domain-specific accelerators, embedded FPGAs, and heterogeneous chiplets surges. The orientation toward transformer inference, secure enclave coprocessors, and high-speed SerDes encourages long design engagements and differentiated IP libraries.
The Analog, MCU, and MPU categories remain vital for power management and edge control, but they grow at more moderate rates. RF and mixed-signal design houses profit from the rollouts of 5G and Wi-Fi 7, yet they cannot match the explosive trajectory of AI-centric logic. Overall, the product mix shift ensures the Semiconductor fabless market receives an increasing proportion of its revenue from logic innovations, reinforcing dependency on leading-edge nodes.


By End-Use Application: Data-Center Momentum Offsets Mobile Maturity
Mobile and consumer electronics remained the largest application group, accounting for 38.63% of 2024 revenue; however, rising handset replacement intervals are tempering unit growth. In contrast, hyperscale operators and enterprise IaaS providers are investing double-digit budgets in AI training clusters, driving data-center demand at a 15.49% CAGR.
The higher average selling price profile of server-class accelerators magnifies revenue leverage, helping the Semiconductor fabless market capture disproportionate value per unit shipped. Automotive design wins for electric-drive inverters and ADAS controllers broaden the customer base, while industrial and medical requirements add smaller but stable streams anchored by long product lifecycles and stringent certification needs.
By Technology Node: Sub-7 nm Nodes Command Premium Pricing
The mid-range 7-14 nm window held 35.73% revenue share in 2024, thanks to mature cost structures and adequate performance for many consumer devices. Even so, the Semiconductor fabless market size linked to processes below 7 nm is growing fastest, supported by a 16.28% CAGR as AI and graphics workloads migrate to extreme-ultraviolet lithography.
Chipmakers operating on 28 nm and above continue to serve power-analog, connect-IoT, and automotive microcontroller niches; however, pricing pressure and capacity competition reduce margin upside. Allocation strategy, therefore, pivots on securing sub-7 nm wafers for performance-critical logic while maintaining volume positions at mature nodes for cost-sensitive designs.
By Customer Type: Tier-1 OEM Dominance with Niche Challengers Rising
Tier-1 system OEMs procured 46.29% of fabless output in 2024 and are expected to expand at a 14.72% CAGR through the forecast period. Long-term sourcing agreements, co-development roadmaps, and joint validation labs anchor these relationships. Emerging OEMs and vertical start-ups, particularly in robotics and edge AI cameras, gain footholds by focusing on specialized workloads that incumbents often overlook.
Government and defense agencies grow their demand share for secure, domestically produced semiconductors. Overall, diversification of the customer mix supports resilience, yet also compels the Semiconductor fabless market to master a wider array of compliance frameworks and longevity commitments.
Geography Analysis
The Asia Pacific generated 54.01% of the Semiconductor fabless market revenue in 2024, leveraging its dense manufacturing clusters, mature EMS relationships, and proximity to consumer device assembly lines. Taiwan and South Korea supply most sub-5 nm wafers, while Japan expands specialty processes and 3D packaging capacity to rebalance strategic exposure. China accelerates domestic investment in 14nm and 28nm lines amid export-control headwinds, pushing local fabless firms to target mid-range AI and industrial IoT designs.
North America's semiconductor fabless market is projected to grow at a 14.39% CAGR, driven by CHIPS Act incentives, a robust software ecosystem, and hyperscale cloud investment. Foundry projects in Arizona, Texas, and New York promise closer prototype-to-production loops, improving supply-chain certainty for automotive, aerospace, and defense contracts. Additionally, active venture funding around RISC-V compute blocks and photonic IC start-ups expands the domestic design pool.
Europe commands a modest share but captures premium niches in automotive electronics, factory automation, and secure ID solutions. The European Chips Act’s EUR 43 billion (USD 50.09 billion) funding scheme backs new 2 nm pilot lines and applied-research centers, aiming to double the continent’s semiconductor footprint across the forecast horizon.[3]European Commission. "European Chips Act Implementation," digital-strategy.ec.europa.eu Energy-price volatility and talent shortages remain constraints; however, partnerships with U.S. and Asian foundries help mitigate immediate capacity gaps.

Competitive Landscape
The top five fabless suppliers control roughly 35% of global revenue, giving the Semiconductor fabless market a moderate concentration profile. Qualcomm and Broadcom sustain their scale through strategic acquisitions and end-to-end IP portfolios that span connectivity, AI, and security blocks. NVIDIA, AMD, and Marvell deepen their ties with Taiwan-based foundries for access to advanced nodes, while Samsung Foundry and GlobalFoundries add geographic diversity.
Mid-tier specialists carve out niches in RF front-end modules, automotive domain controllers, and industrial power devices, often relying on differentiated process platforms such as silicon carbide or gallium nitride. Open-source RISC-V cores lower the entry barriers for start-ups focused on custom, low-power computing. The rise of chiplet standards enables small design houses to participate in heterogeneous packages assembled by ecosystem leaders, thereby democratizing innovation while amplifying the complexity of supply-chain coordination.
Longer qualification cycles in automotive and medical segments reward firms with ISO 26262 or ISO 13485 track records, raising barriers for green-field entrants. Consequently, competitive advantage depends on a blend of IP breadth, packaging partnerships and compliance capacity, sustaining dynamic but orderly competition within the Semiconductor fabless market.
Semiconductor Fabless Industry Leaders
-
NVIDIA Corporation
-
Qualcomm Incorporated
-
Broadcom Inc.
-
Advanced Micro Devices Inc.
-
MediaTek Inc.
- *Disclaimer: Major Players sorted in no particular order

Recent Industry Developments
- October 2025: Qualcomm and Samsung Foundry have signed a USD 8.2 billion, five-year pact to secure 3 nm capacity for next-generation Snapdragon AI processors.
- September 2025: Broadcom closed its USD 12.8 billion acquisition of Symantec’s enterprise-security division, bundling hardware security modules with networking ASICs.
- August 2025: MediaTek introduced Dimensity 9500, an integrated AI flagship built on TSMC’s enhanced 3 nm node with 45% inference performance uplift.
- July 2025: AMD unveiled the MI350 data-center accelerators, fabricated at 3 nm and packaged with 2.5D chiplets, targeting deep-learning training workloads.


Global Semiconductor Fabless Market Report Scope
| Analog ICs |
| Logic ICs |
| MCU and MPU |
| RF AND Mixed-Signal ICs |
| Mobile and Consumer Electronics |
| Data Center and Cloud Computing |
| Automotive and Transportation |
| Industrial and Medical |
| ≥28 nm |
| 16–22 nm |
| 7–14 nm |
| <7 nm |
| Tier-1 System OEMs |
| Emerging Device OEMs |
| IP Licensing AND Design-Service Firms |
| Government AND Defense Agencies |
| Virtual Desktop Infrastructure (VDI) |
| Application Virtualization |
| Session Virtualization / Terminal Services |
| Access Management and Monitoring |
| North America | United States |
| Canada | |
| Mexico | |
| South America | Brazil |
| Argentina | |
| Rest of South America | |
| Europe | Germany |
| United Kingdom | |
| France | |
| Italy | |
| Spain | |
| Russia | |
| Rest of Europe | |
| Asia Pacific | China |
| Japan | |
| India | |
| South Korea | |
| Australia and New Zealand | |
| Rest of Asia Pacific | |
| Middle East | Saudi Arabia |
| United Arab Emirates | |
| Turkey | |
| Rest of Middle East | |
| Africa | South Africa |
| Nigeria | |
| Kenya | |
| Rest of Africa |
| By Product Type | Analog ICs | |
| Logic ICs | ||
| MCU and MPU | ||
| RF AND Mixed-Signal ICs | ||
| By End-Use Industry | Mobile and Consumer Electronics | |
| Data Center and Cloud Computing | ||
| Automotive and Transportation | ||
| Industrial and Medical | ||
| By Technology Node | ≥28 nm | |
| 16–22 nm | ||
| 7–14 nm | ||
| <7 nm | ||
| By Customer Type | Tier-1 System OEMs | |
| Emerging Device OEMs | ||
| IP Licensing AND Design-Service Firms | ||
| Government AND Defense Agencies | ||
| By Technology | Virtual Desktop Infrastructure (VDI) | |
| Application Virtualization | ||
| Session Virtualization / Terminal Services | ||
| Access Management and Monitoring | ||
| By Geography | North America | United States |
| Canada | ||
| Mexico | ||
| South America | Brazil | |
| Argentina | ||
| Rest of South America | ||
| Europe | Germany | |
| United Kingdom | ||
| France | ||
| Italy | ||
| Spain | ||
| Russia | ||
| Rest of Europe | ||
| Asia Pacific | China | |
| Japan | ||
| India | ||
| South Korea | ||
| Australia and New Zealand | ||
| Rest of Asia Pacific | ||
| Middle East | Saudi Arabia | |
| United Arab Emirates | ||
| Turkey | ||
| Rest of Middle East | ||
| Africa | South Africa | |
| Nigeria | ||
| Kenya | ||
| Rest of Africa | ||


Key Questions Answered in the Report
How large is the Semiconductor fabless market in 2025?
The Semiconductor fabless market size stands at USD 270.87 billion in 2025.
What is the expected CAGR for fabless chip design revenue to 2030?
Revenue is projected to expand at a 14.37% CAGR between 2025 and 2030.
Which product category contributes most to fabless revenue?
Logic ICs contribute the largest share, accounting for 42.58% of 2024 sales.
Which geographic region is growing fastest?
North America leads growth with a forecast 14.39% CAGR through 2030, aided by CHIPS Act incentives.
Why is advanced packaging capacity a concern for fabless companies?
Utilization for 2.5D and fan-out formats exceeds 95%, leading to six-month lead times and premium pricing.
What role do government subsidy programs play in the sector?
CHIPS-like incentives in the United States and Europe lower entry barriers and encourage regional design hubs, helping diversify the supply chain.
Page last updated on:


