Soda Ash Market Size and Share
Market Overview
| Study Period | 2021 - 2031 |
|---|---|
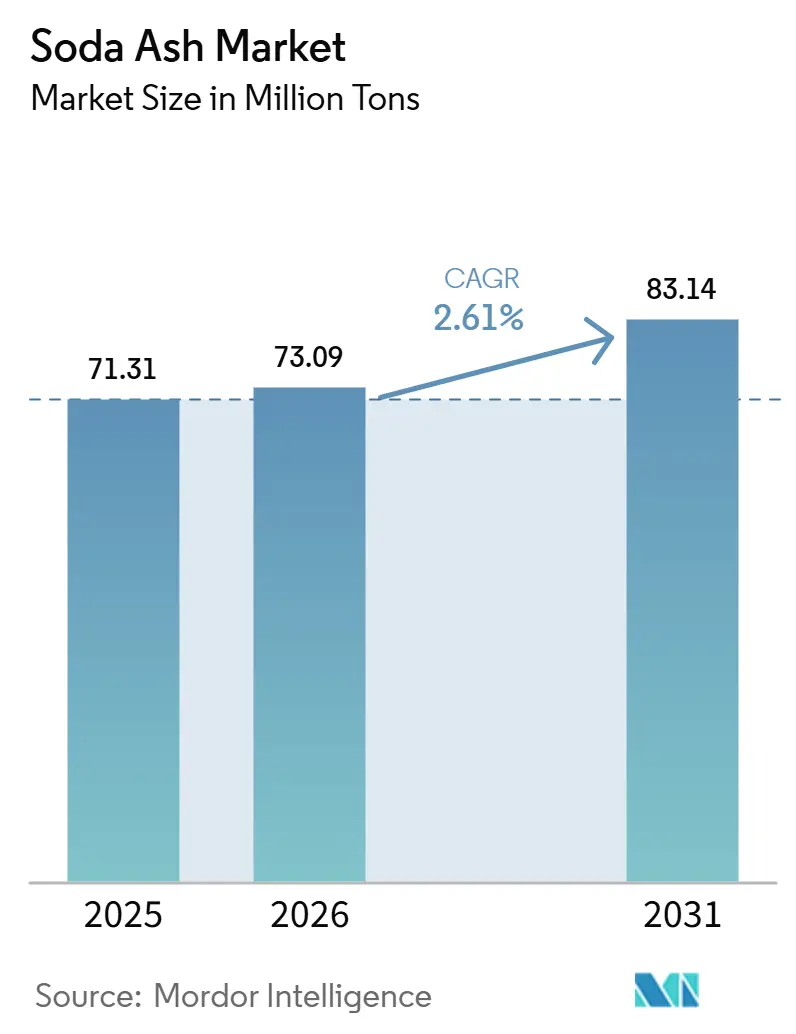
| Market Volume (2026) | 73.09 Million tons |
| Market Volume (2031) | 83.14 Million tons |
| Growth Rate (2026 - 2031) | 2.61% CAGR |
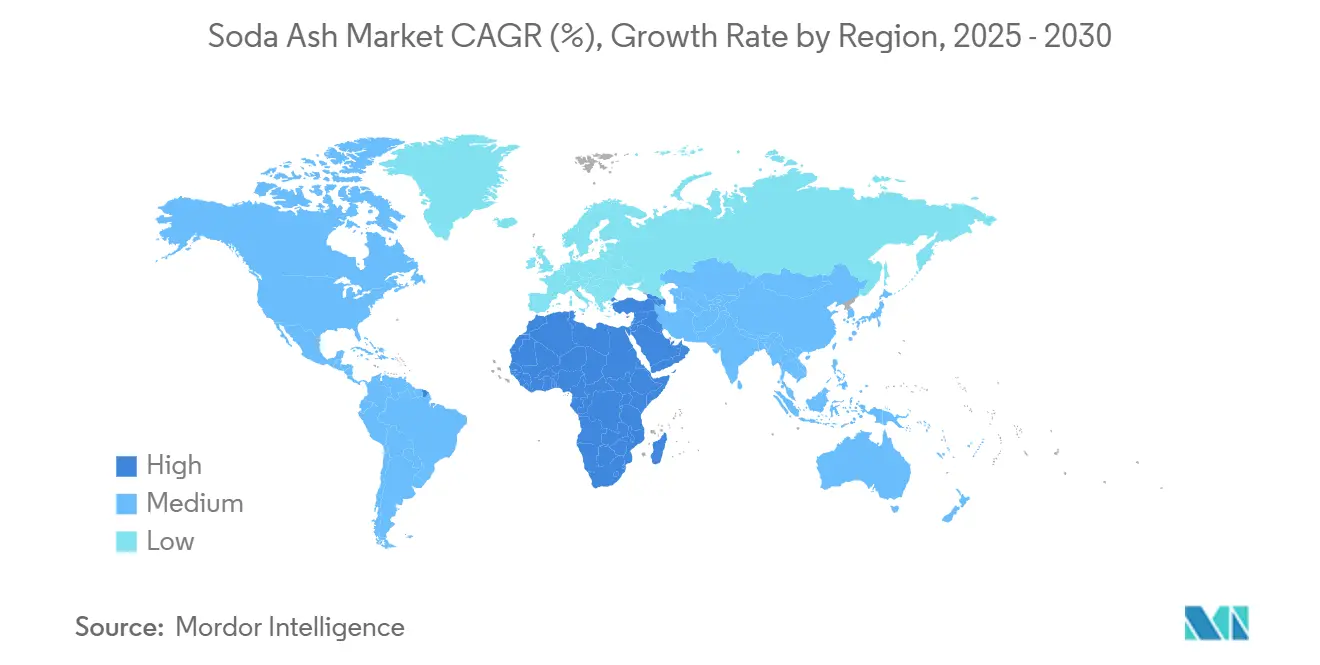
| Fastest Growing Market | Middle East and Africa |
| Largest Market | Asia Pacific |
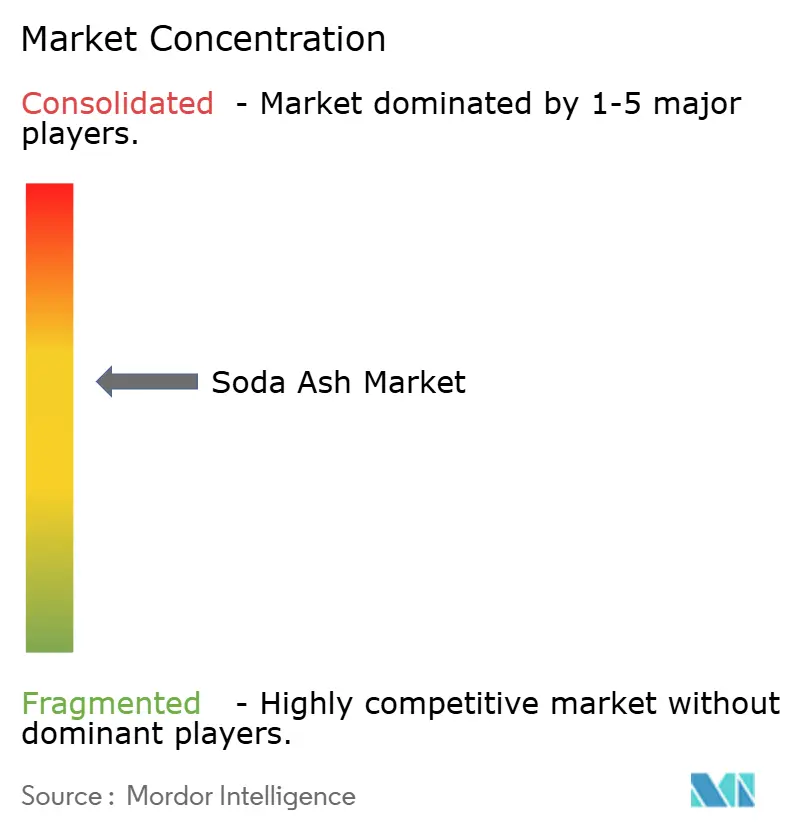
| Market Concentration | Medium |
Major Players *Disclaimer: Major Players sorted in no particular order Image © Mordor Intelligence. Reuse requires attribution under CC BY 4.0. | |
Soda Ash Market Analysis by Mordor Intelligence
The Soda Ash Market size is projected to be 71.31 Million tons in 2025, 73.09 Million tons in 2026, and reach 83.14 Million tons by 2031, growing at a CAGR of 2.61% from 2026 to 2031. Mature demand from flat and container glass and powdered detergents anchors volume stability, while new momentum arrives from solar glass, lithium carbonate precipitation and sodium-ion batteries that collectively widen the downstream opportunity set. Environmental regulations that penalize carbon-intensive Solvay and Hou plants continue to accelerate the structural shift toward lower-emission trona-based production, sharpening cost advantages for producers in Wyoming’s Green River Basin and Türkiye’s solution-mined deposits. Supply rationalization through mergers such as WE Soda’s purchase of Genesis Alkali is compressing the competitive field, reinforcing pricing discipline just as dense grade availability tightens amid rising photovoltaic glass pull. Infrastructure spending sprees across India, Southeast Asia and the Gulf further lift building-grade glass offtake, ensuring that the soda ash industry remains linked to global construction cycles.
Key Report Takeaways
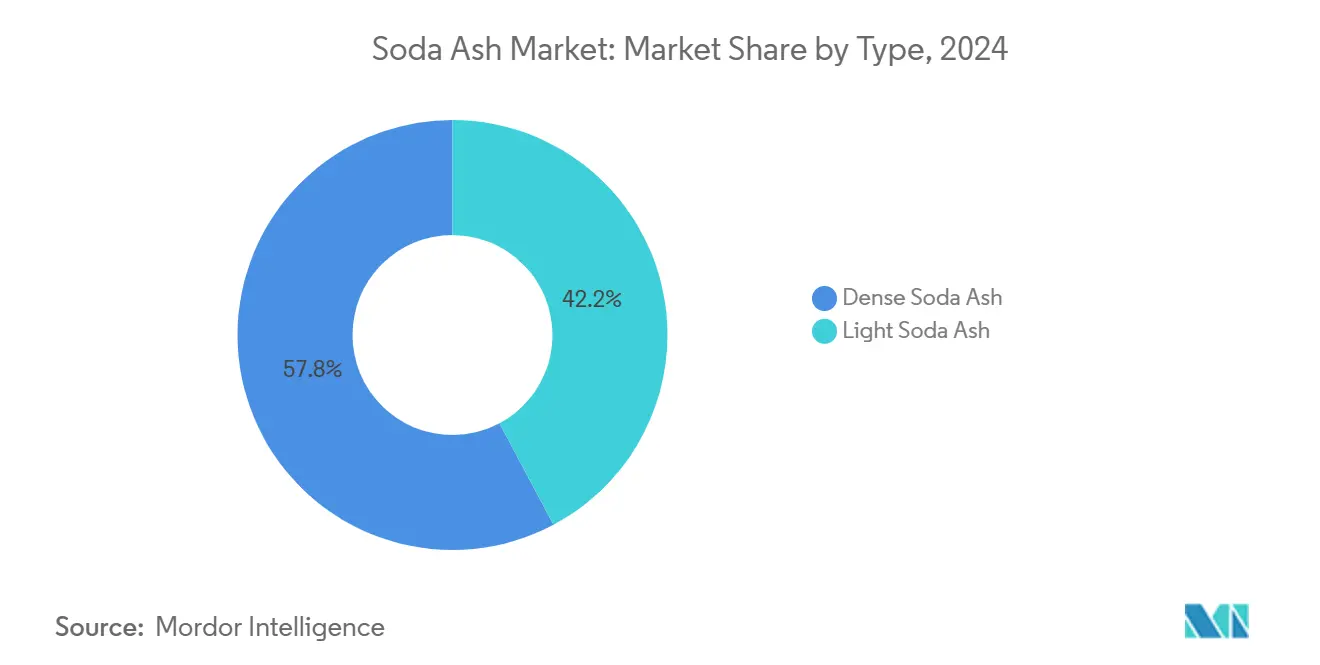
- By type, dense soda ash led with 57.78% of the soda ash market share in 2024, while light grade is forecast to advance at a 3.89% CAGR through 2030.
- By source, the market saw synthetic plants retained 61.12% revenue share in 2024; natural extraction is positioned to expand at a 4.12% CAGR between 2025-2030.
- By application, the industry was led glass manufacturing captured 51.65% revenue in 2024; water treatment shows the quickest trajectory at a 4.94% CAGR to 2030.
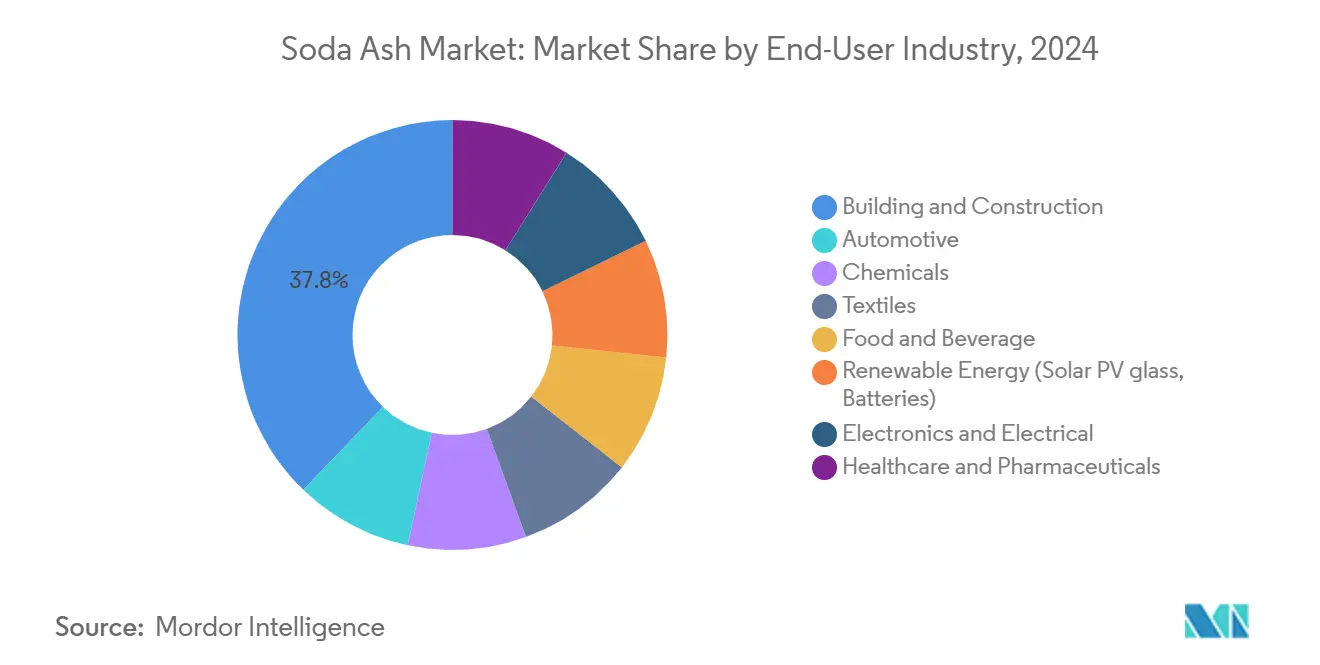
- By end-user, the global market was dominated by building and construction commanded 37.78% of 2024 revenues; renewable energy end-uses are projected to climb at a 5.10% CAGR through 2030.
- By geography, Asia-Pacific accounted for 43.12% of 2024 consumption; the Middle East and Africa promises the fastest expansion in soda ash market share, with a CAGR of 3.78% over the outlook period.
Note: Market size and forecast figures in this report are generated using Mordor Intelligence’s proprietary estimation framework, updated with the latest available data and insights as of January 2026.
Global Soda Ash Market Trends and Insights
Drivers Impact Analysis*
| Driver | (~) % Impact on CAGR Forecast | Geographic Relevance | Impact Timeline |
|---|---|---|---|
| Surging demand for flat, container and solar glass | +0.8% | Global, with concentration in APAC and North America | Medium term (2-4 years) |
| Rebound in powdered detergents in emerging economies | +0.4% | APAC core, spill-over to MEA and South America | Short term (≤ 2 years) |
| Capacity additions in lithium carbonate (EV batteries) | +0.6% | Global, with early gains in North America and China | Long term (≥ 4 years) |
| Transition from synthetic to natural soda ash (ESG, cost) | +0.3% | North America and Europe leading, APAC following | Long term (≥ 4 years) |
| Emerging sodium-ion and thermal energy-storage uses | +0.2% | Global, with pilot projects in developed markets | Long term (≥ 4 years) |
| Source: Mordor Intelligence | |||
Surging Demand for Flat, Container and Solar Glass
Global photovoltaic build-outs are rewiring raw-material flows as every GW of new solar capacity requires roughly 75 kt of ultra-clear glass, pushing soda ash purity specifications higher and widening price differentials for dense grade supply. Container glass growth in the soda ash industry rides buoyant beverage and pharmaceutical packaging trends that favor infinitely recyclable glass over single-use plastics. Chinese float-flat inventories of 68.66 million weight cases in 2024 underscore the scale of the regional base yet also hint at cyclical volatility as developers modulate real-estate exposure. Automotive glazing upgrades alongside low-emissivity architectural façades continue to integrate energy-saving coatings that raise soda ash volume per square meter relative to legacy formulations. Collectively, these outlets lock more than half of global soda ash volumes into glass value chains, amplifying the sensitivity of the soda ash market to glazing investment cycles.
Rebound in Powdered Detergents in Emerging Economies
Rising household penetration of automatic washing machines in India, Indonesia and Nigeria revives demand in the soda ash market for high-alkalinity powdered formats that outperform liquids in hard-water regions. Local formulators are pivoting toward denser powders that carry higher soda ash loadings per unit, strengthening backward-integration incentives for detergent majors. Urbanization supports brand premiumization, yet rural channels still prize cost efficiency, locking in soda ash as the preferred pH builder that offsets zeolite hardness. Multinationals with captive ash supply enjoy margin insulation as volatile freight rates inflate delivered costs for import-reliant blenders. Regulatory movements to phase out phosphates in South American detergents further raise soda ash substitution potential through eco-label compliant alkaline systems.
Capacity Additions in Lithium Carbonate (EV Batteries)
Battery-grade lithium projects from Nevada’s Thacker Pass to Chile’s Maricunga are designing flowsheets around soda-precipitation pathways that sidestep sulfuric acid roasting, cutting both capex and carbon intensity by up to 45%. SQM alone draws roughly 400,000 t of dense soda ash each year for its Salar de Atacama brines, with term contracts locking in supply continuity and supporting premium contract pricing. U.S. Inflation Reduction Act incentives steer cathode plants closer to end markets, boosting North American soda ash pull through shorter trucking lanes from Wyoming. Process engineers report improved lithium recovery yields when sodium carbonate dosing is optimized at lower temperatures, reducing energy burn and operating costs. These metallurgical tailwinds position the soda ash market for incremental high-purity volume gains that carry attractive unit margins.
Emerging Sodium-Ion and Thermal Energy-Storage Uses
Prototype sodium-ion batteries from CATL and Faradion require battery-grade sodium carbonate as a precursor, creating a nascent yet potentially material offtake wave post-2027. Concentrated solar power projects in Spain and the U.S. are piloting carbonate-salt thermal storage mixtures that rely on soda ash to elevate melting points and cycle stability[1]U.S. Geological Survey, “Mineral Commodity Summary: Soda Ash 2025,” usgs.gov. While volumes remain small, early performance results suggest multi-gigawatt development pipelines could open a fresh specialty demand limb that commands pricing above commodity grades. Utilities favor sodium solutions given lithium supply uncertainty and geopolitical risk, aligning with broader strategic moves to diversify energy-storage chemistries. Success in scaling these applications would further tighten long-term supply-demand balances within the soda ash market.
Restraints Impact Analysis*
| Restraint | (~) % Impact on CAGR Forecast | Geographic Relevance | Impact Timeline |
|---|---|---|---|
| High CO₂ footprint and tightening emission norms | -0.7% | Europe and North America primarily, expanding globally | Medium term (2-4 years) |
| Volatile trona / energy / freight prices | -0.3% | Global, with acute impact in Wyoming and Turkey | Short term (≤ 2 years) |
| Global over-capacity led by China and Türkiye price pressure | -0.5% | Global, with acute impact in export-dependent regions | Short term (≤ 2 years) |
| Source: Mordor Intelligence | |||
High CO₂ Footprint and Tightening Emission Norms
Under the EU Emissions Trading System, soda ash plants must purchase allowances for each ton of CO₂ released, sharply eroding Solvay-process margins and encouraging capacity curtailments[2]European Commission, “EU ETS Handbook 2024,” europa.eu . Glass producers simultaneously face scope-1 levies because sodium carbonate decarbonates inside furnaces, doubling the carbon-compliance burden along the value chain. Alternative alkali such as caustic soda presents disposal and chlorine co-product challenges that undercut replacement economics. Carbon capture pilots show promise, yet capital intensity near USD 120 million per 1 Mt of annual capacity strains balance sheets, particularly for mid-size Asian operators. Absent breakthrough abatement technologies, regulatory tightening could cap synthetic output growth and marginalize high-cost plants from the global soda ash market.
Global Over-Capacity Led by China and Türkiye Price Pressure
China’s aggressive capacity expansion outpaced domestic demand in 2024, pushing exports into Southeast Asia and South Asia at marginal pricing that undercuts regional players. Türkiye’s Kazan and Eti facilities add 2 Mt of solution-mined capacity in 2025, further saturating spot pools aimed at Europe and North Africa. The resulting discount environment squeezes mills that lack captive raw-material resources, forcing curtailments or defensive alliances. Ocean-freight volatility exacerbates landed-cost disparities, rendering distant synthetic suppliers structurally uncompetitive during freight spikes. Until rationalization offsets surplus volumes, this overhang will continue to dampen earnings power across the soda ash market.
*Our forecasts treat driver/restraint impacts as directional, not additive. The impact forecasts reflect baseline growth, mix effects, and variable interactions.
Segment Analysis
By Type: Dense Grade Anchors High-Volume Glass Demand
Dense grade accounted for 57.78% share of the soda ash market in 2024, reflecting its superior handling profile and reduced dust emissions that enable continuous float-glass furnace operation. Logistics efficiency rises because higher bulk density lowers freight cost per active ton, a decisive advantage as container shortages inflate shipping premiums. Light grade is projected to grow at a 3.89% CAGR to 2030, capturing municipal water-softening projects where rapid dissolution improves process economics. Glass furnaces require consistent granulometry to avoid throat build-up, cementing dense-grade incumbency despite its nominal price premium. Light soda ash continues to benefit from detergent production that favors faster solubility, yet its market ceiling remains capped by glass’s dominant pull on global volumes.
Competitive positioning in dense grade tilts toward trona miners able to offer large parcels of uniform chemistry, insulating them from regional price skirmishes. Producers are investing in enclosed pneumatic loading systems to preserve density integrity through the supply chain. Light-grade manufacturers, meanwhile, diversify into micronized specialty powders for electronics and pharmaceutical fillers, attempting to lift margins above commodity thresholds. Although both grades share common raw materials, divergent crystallization and drying regimes create unique cost curves that dictate pricing corridors within the soda ash market.


By Source: Natural Extraction Gains Carbon-Cost Advantage
Synthetic facilities retained 61.12% revenue share in 2024, yet natural suppliers are on track for the fastest 4.12% CAGR thanks to ESG procurement mandates and energy-price asymmetry. The soda ash market size for natural grades is projected to swell as utilities and glassmakers source low-carbon raw materials to meet Scope-3 targets. Trona resources in Wyoming’s Green River Basin can sustain global demand for centuries, underpinning supply-security narratives that resonate with import-dependent European buyers.
Synthetic incumbents confront rising carbon levies and feedstock volatility, spurring retrofit programs such as Solvay’s electrified kilns that aim for 50% emission cuts by 2030. Natural extraction’s warrant includes lower water usage and limited chemical reagents, two parameters scrutinized by green-finance frameworks. Investment surges into solution mining in Türkiye and Peninsular Malaysia illustrate capital rotation toward geological ore bodies. Over the forecast horizon, synthetic capacity rationalization is expected, with high-cost Asian units most exposed, sharpening the competitive edge enjoyed by natural-grade participants within the soda ash market.
By Application: Glass Manufacturing Dominates, Water Treatment Accelerates
Glass manufacturing captured 51.65% revenue in 2024, cementing its status as the cornerstone outlet that dictates demand cycles and sets reference prices for the broader soda ash market. Flat glass expansion for architectural façades converges with container-glass sustainability mandates, reinforcing structural volume pull. Specialty solar glass consumes higher soda ash purity, inviting premium surcharges and blending opportunities that raise average selling prices.
Water treatment, advancing at a 4.94% CAGR, benefits from municipal infrastructure backlogs and industrial zero-liquid-discharge directives that lift demand for lime-soda softening processes. Lime-soda trains precipitate calcium and magnesium hardness, enabling utilities to meet tightening potable standards without membrane retrofits. Detergent and soap volumes remain stable, but formulation shifts toward compact powders slightly raise soda ash inclusion rates. Downstream chemical conversion into sodium bicarbonate and silicate supplies baking products, flue-gas desulfurization media and foundry binders, spreading risk across end-markets. Collectively, these outlets illustrate the breadth of the soda ash market, yet underscore its overarching sensitivity to glass production investment.
By End-user Industry: Construction Commands, Renewable Energy Emerges
Building and construction end-users absorbed 37.78% of 2024 volumes in the soda ash industry, riding urbanization and infrastructure schemes across ASEAN, the Gulf and Africa that demand architectural glass, fiberglass insulation and chromated bricks. High-performance glazing that meets stricter thermal codes contains elevated soda ash loadings for energy-efficient melt behavior, tethering alkali consumption to green-building legislation.
Renewable-energy demand is projected to climb at a 5.10% CAGR as solar-specific low-iron glass output scales and sodium-ion battery supply chains crystallize. Automotive makers sustain windshield and mirror consumption yet pivot toward lighter, thinner glass to meet fuel-economy targets, marginally reducing soda ash intensity per vehicle. Electronics applications, including cover glass for displays and fused silica for semiconductors, prize ultrapure grades that command multiples of commodity prices, though absolute volumes remain modest. Food and beverage brands extend circular-economy pledges that favor glass bottles, adding incremental ballast to construction’s foundational pull in the soda ash market.

Geography Analysis
Asia-Pacific retained 43.12% share of global consumption in 2024, underpinned by China’s twin role as the largest producer and end-user at 36 Mt of annual output. The Asia-Pacific soda ash market also benefited from India’s apparent consumption in the industry which grew 4.1% year-on-year to 4.14 Mt in FY 2024, buoyed by real-estate starts and container-glass demand for food packaging. Japan and South Korea contribute steady high-margin offtake for specialty glass and electronics, stabilizing regional average selling prices.
North America benefits from natural-grade cost leadership anchored in Wyoming, where 12 Mt of trona-based soda ash valued at USD 2.5 billion moved in 2024. U.S. export corridors into Latin America and East Asia capture currency-hedging advantages, while Canada’s float-glass revival secures local off-take. Mexico leans on U.S. imports for container-glass furnaces that supply an expanding beverage sector.
The Middle East and Africa is forecast to grow at 3.78% CAGR through 2030 as Saudi Vision 2030 and UAE industrial strategies channel capex toward flat-glass and fiberglass facilities. Türkiye’s solution-mined capacity positions the country as both regional supplier and global swing exporter, diluting European reliance on domestic synthetic plants under emission pressure. South Africa’s automotive and construction recoveries lift soda ash call in sub-Saharan markets, while Nigeria signals nascent demand for water-treatment grades. Europe, squeezed by energy costs, pivots toward imported natural soda ash despite freight exposure, a rebalancing that re-shapes trans-Atlantic trade lanes in the global market.

Competitive Landscape
The soda ash market exhibits moderate consolidation. Consolidation advanced in December 2024 when WE Soda acquired Genesis Alkali for USD 1.425 billion, forging a 9.5 Mt natural-grade champion that commands unmatched scale. The enlarged entity leverages cross-basin shipping flexibility from Wyoming and Türkiye, offering blended specs that hedge regional purity swings. Solvay counters through its e.Solvay retrofit program, which targets 50% CO₂ cuts and 20% energy savings by electrifying calcination stages and adopting circular calcium routes. Implementation across its European assets begins in 2026, positioning the group to defend share in high-purity segments of the soda ash market.
Eti Soda and Şişecam accelerate Turkish expansion via dual solution-mined shafts, adding 2 Mt of capacity by late 2025 and tightening grip on Mediterranean imports. Tata Chemicals sustains Indian presence through brownfield debottlenecking in Gujarat, lifting domestic availability while pursuing lithium precipitate grades for upcoming cathode plants. American Natural Soda Ash Corporation (ANSAC) maintains global marketing rights for U.S. producers, though antitrust scrutiny encourages more direct offtake agreements between miners and multinational glass groups.
Innovation differentiates niche suppliers: CIECH investigates solar-grade ultralow-iron ash from Polish brines, while Nirma explores zero-liquid-discharge crystallizers to curb effluent at its Rajasthan synthetic unit. Pacific Soda’s USD 5 billion Green River mine, green-lighted in April 2025, promises long-term supply security for North American offtakers, underscoring investor confidence in natural reserves. As ESG filters intensify procurement, players with verifiable low-carbon credentials stand to gain preferential access to premium photovoltaic and battery markets, reinforcing the strategic weight of sustainable operations across the soda ash market.
Soda Ash Industry Leaders
QEMETICA
Şişecam
Solvay
Tata Chemicals Ltd.
We Soda Ltd.
- *Disclaimer: Major Players sorted in no particular order

Recent Industry Developments
- July 2025: The Directorate General of Foreign Trade (DGFT) of India, through two separate notifications issued on June 30, announced the extension of import restrictions on soda ash and low-ash metallurgical coke. The DGFT stated, "The minimum import price (MIP) for disodium carbonate, commonly referred to as soda ash, has been fixed at INR 20,108 per ton and will be applicable until December 31, 2025."
- April 2025: GHCL has commenced basic engineering work for a new soda ash plant in Gujarat. This greenfield project represents one of GHCL's most significant initiatives, aimed at increasing soda ash production capacity to address the growing market demand.


Global Soda Ash Market Report Scope
| Light Soda Ash |
| Dense Soda Ash |
| Natural (Trona-based) |
| Synthetic (Solvay, Hou, Dual-process) |
| Glass Manufacturing |
| Detergents and Soaps |
| Chemical Processing |
| Pulp and Paper |
| Metallurgy (Ore Smelting and Desulfurization) |
| Water Treatment |
| Food and Beverage Processing |
| Building and Construction |
| Automotive |
| Chemicals |
| Textiles |
| Food and Beverage |
| Renewable Energy (Solar PV glass, Batteries) |
| Electronics and Electrical |
| Healthcare and Pharmaceuticals |
| Asia-Pacific | China |
| India | |
| Japan | |
| South Korea | |
| ASEAN Countries | |
| Australia and New Zealand | |
| Rest of Asia-Pacific | |
| North America | United States |
| Canada | |
| Mexico | |
| Europe | Germany |
| United Kingdom | |
| France | |
| Italy | |
| Spain | |
| Russia | |
| Rest of Europe | |
| South America | Brazil |
| Argentina | |
| Chile | |
| Rest of South America | |
| Middle-East and Africa | Saudi Arabia |
| Turkey | |
| South Africa | |
| Nigeria | |
| Rest of Middle-East and Africa |
| By Type | Light Soda Ash | |
| Dense Soda Ash | ||
| By Source | Natural (Trona-based) | |
| Synthetic (Solvay, Hou, Dual-process) | ||
| By Application | Glass Manufacturing | |
| Detergents and Soaps | ||
| Chemical Processing | ||
| Pulp and Paper | ||
| Metallurgy (Ore Smelting and Desulfurization) | ||
| Water Treatment | ||
| Food and Beverage Processing | ||
| By End-user Industry | Building and Construction | |
| Automotive | ||
| Chemicals | ||
| Textiles | ||
| Food and Beverage | ||
| Renewable Energy (Solar PV glass, Batteries) | ||
| Electronics and Electrical | ||
| Healthcare and Pharmaceuticals | ||
| By Geography | Asia-Pacific | China |
| India | ||
| Japan | ||
| South Korea | ||
| ASEAN Countries | ||
| Australia and New Zealand | ||
| Rest of Asia-Pacific | ||
| North America | United States | |
| Canada | ||
| Mexico | ||
| Europe | Germany | |
| United Kingdom | ||
| France | ||
| Italy | ||
| Spain | ||
| Russia | ||
| Rest of Europe | ||
| South America | Brazil | |
| Argentina | ||
| Chile | ||
| Rest of South America | ||
| Middle-East and Africa | Saudi Arabia | |
| Turkey | ||
| South Africa | ||
| Nigeria | ||
| Rest of Middle-East and Africa | ||


Key Questions Answered in the Report
What is the current market size of soda ash market?
The soda ash market size is projected to be 71.31 Million tons in 2025, 73.09 Million tons in 2026, and reach 83.14 Million tons by 2031, growing at a CAGR of 2.61% from 2026 to 2031.
Which grade dominates commercial demand for soda ash?
Dense grade leads thanks to its 57.78% share of 2024 sales, driven by flat and container glass manufacturing.
Why is natural soda ash gaining momentum?
Trona-based production cuts greenhouse gas emissions by about 37% versus synthetic routes and enjoys lower energy costs, aligning with stricter ESG purchasing criteria.
Which application offers the fastest growth outlook
Water treatment is projected to expand at a 4.94% CAGR as municipalities upgrade softening systems and industrial users pursue zero-liquid-discharge targets.
Page last updated on:


