Wax Market Size and Share
Market Overview
| Study Period | 2021 - 2031 |
|---|---|
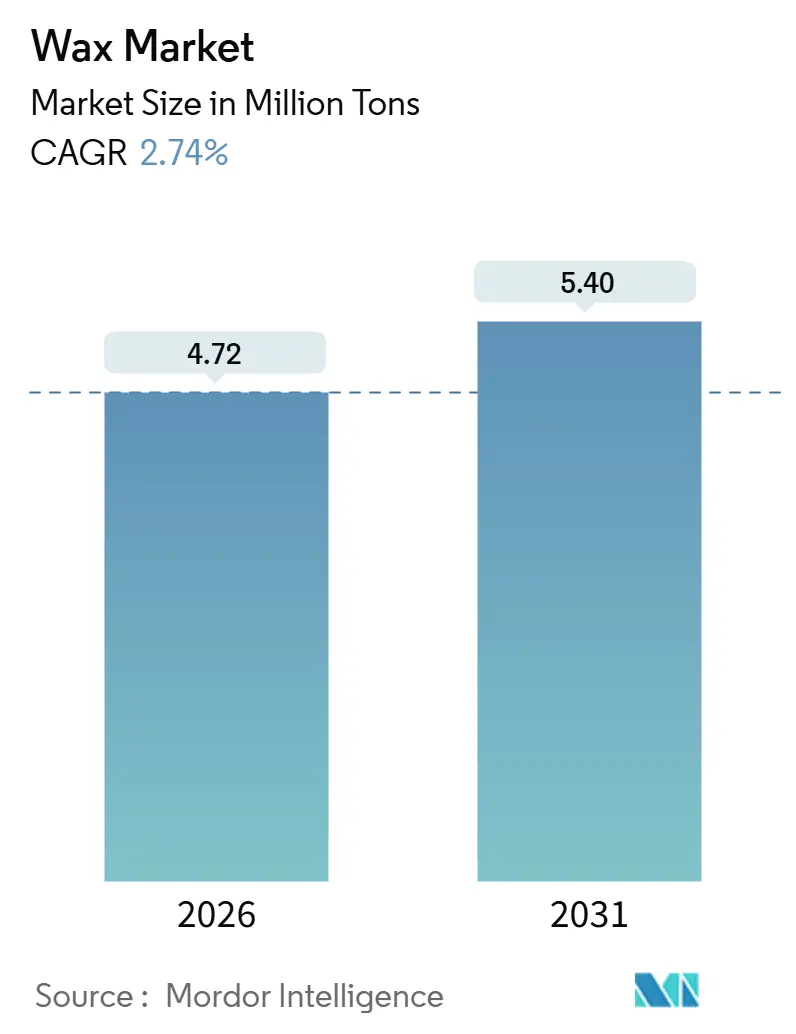
| Market Volume (2026) | 4.72 Million tons |
| Market Volume (2031) | 5.40 Million tons |
| Growth Rate (2026 - 2031) | 2.74% CAGR |
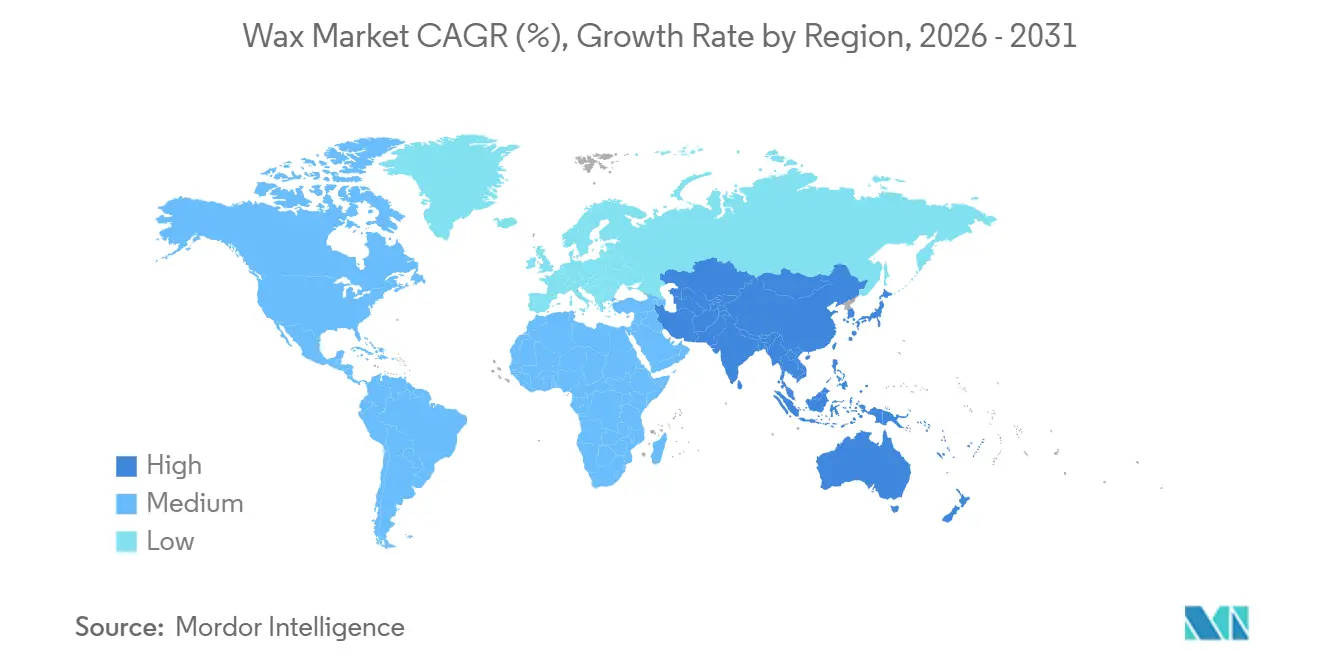
| Fastest Growing Market | Asia Pacific |
| Largest Market | Asia Pacific |
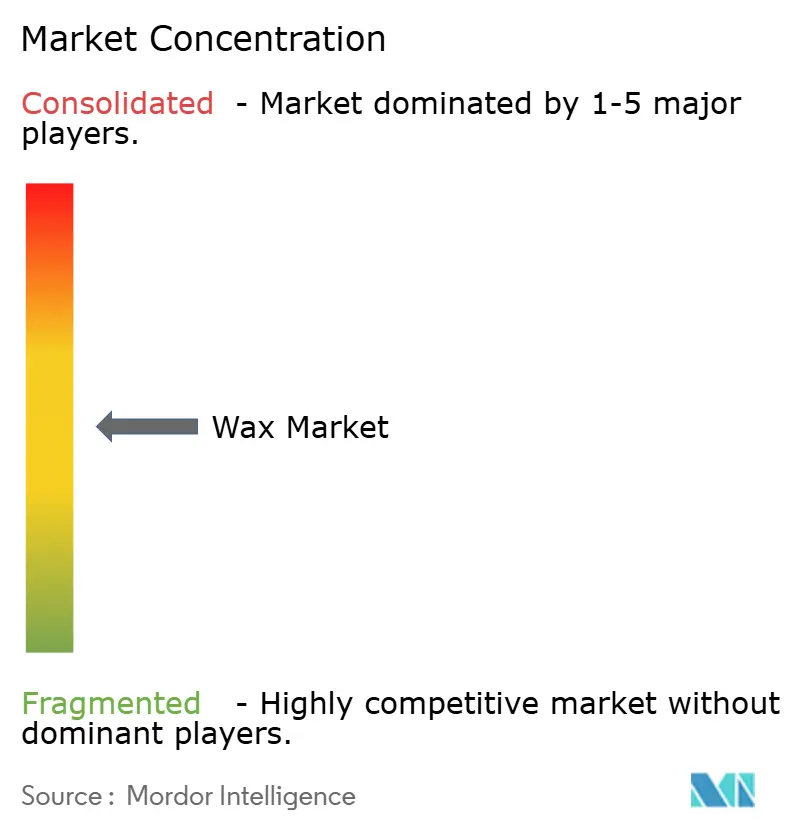
| Market Concentration | Medium |
Major Players *Disclaimer: Major Players sorted in no particular order Image © Mordor Intelligence. Reuse requires attribution under CC BY 4.0. | |
Wax Market Analysis by Mordor Intelligence
The Wax Market size is estimated at 4.72 million tons in 2026, and is expected to reach 5.40 million tons by 2031, at a CAGR of 2.74% during the forecast period (2026-2031). Growth is anchored by Asia-Pacific’s large production base, the premium candle boom in North America, and brand-led clean-label reformulations in Europe. Integrated refiners exploit low-cost slack wax streams, while specialty suppliers accelerate low-carbon Fischer–Tropsch (FT) innovations to defend margins. Supply–demand balances also hinge on the United States’ ethane-cracker build-out, which compresses polyethylene-wax costs, and on European Union PAH limits that favor higher-purity grades. White-space opportunities lie in lithium-ion battery separators and bio-based FT waxes produced from captured CO₂.
Key Report Takeways
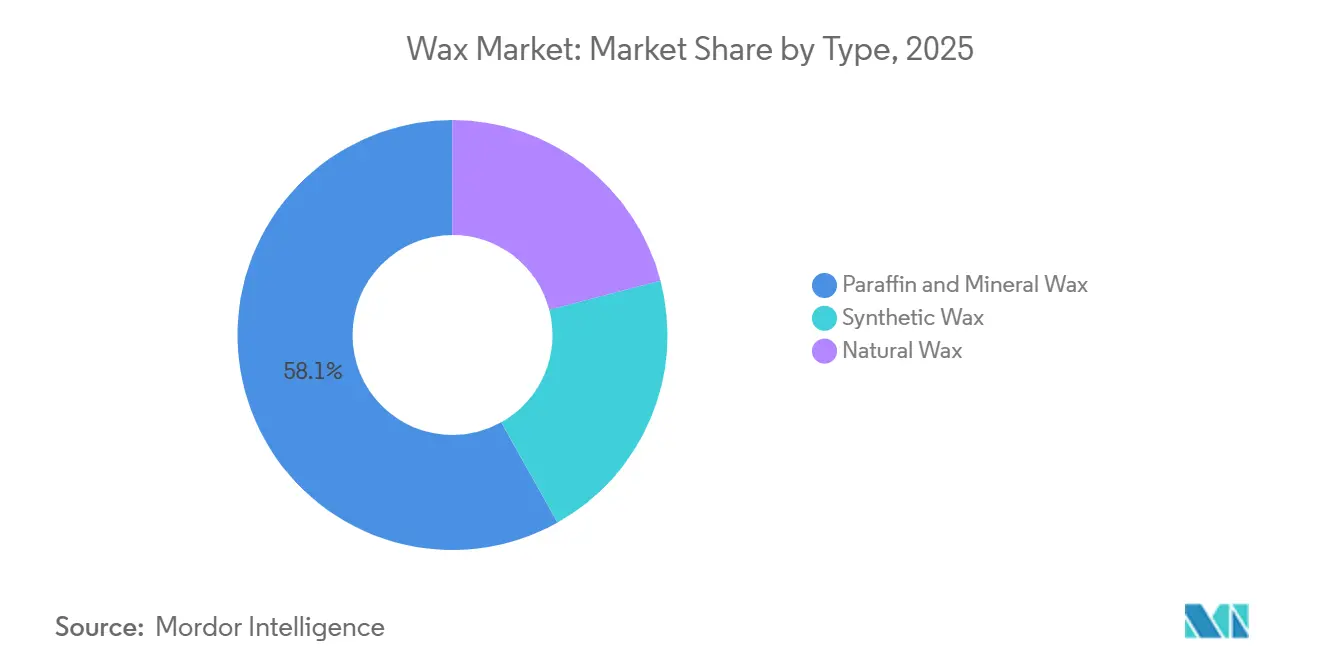
- Paraffin and mineral waxes led with 58.12% of the 2025 wax market share, while natural waxes are forecast to grow at a 3.45% CAGR through 2031.
- Candle making captured 60.32% of the 2025 volume, yet cosmetics are advancing at the fastest 3.68% CAGR to 2031.
- Industrial grades commanded 65.24% of 2025 volume, but cosmetic and pharmaceutical grades are on track for a 3.39% CAGR to 2031.
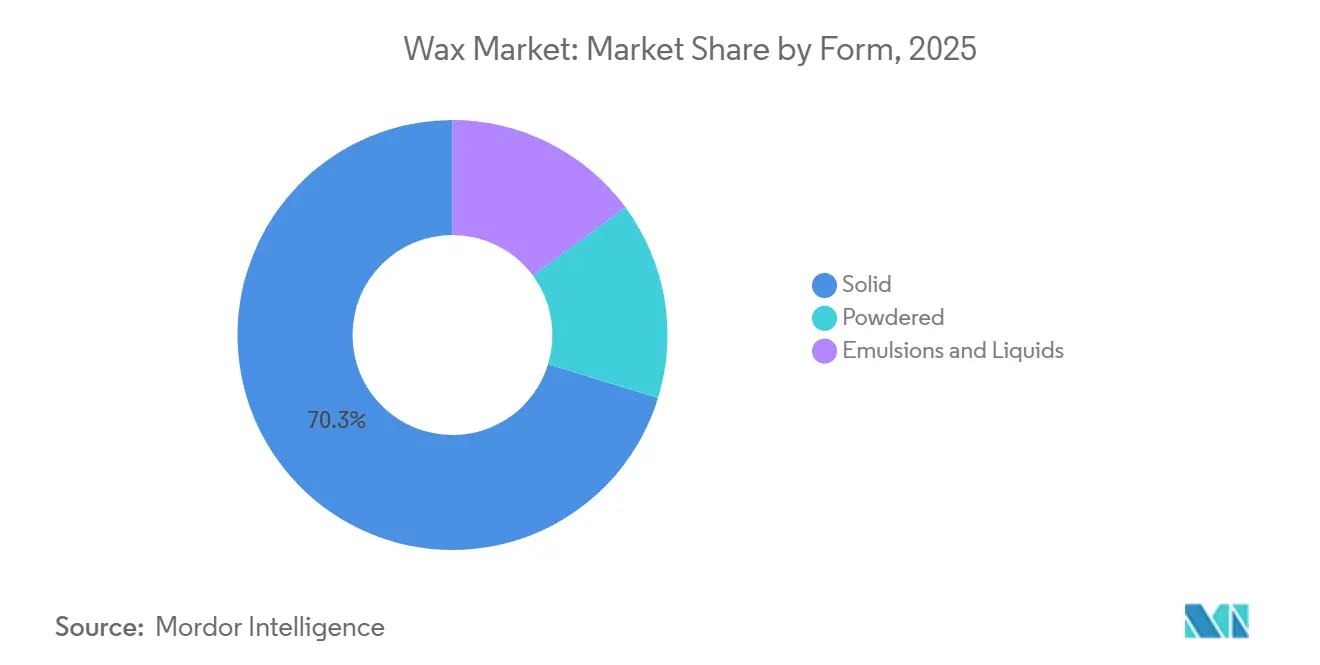
- Solid waxes held 70.26% of the 2025 volume, whereas emulsions and liquids will expand at a 3.31% CAGR through 2031.
- Asia-Pacific accounted for 45.54% of the 2025 volume and is expected to log the quickest 3.27% CAGR through 2031.
Note: Market size and forecast figures in this report are generated using Mordor Intelligence’s proprietary estimation framework, updated with the latest available data and insights as of January 2026.
Global Wax Market Trends and Insights
Driver Impact Analysis*
| Drivers | (~) % Impact on CAGR Forecast | Geographic Relevance | Impact Timeline |
|---|---|---|---|
| Asia-Pacific e-commerce boom boosting hot-melt packaging and FT wax demand | +0.9% | China, India, ASEAN; spill-over to North America | Medium term (2-4 years) |
| Clean-label cosmetics in Europe accelerating plant and bee-based wax shift | +0.6% | Germany, France, United Kingdom; expanding to North America | Long term (≥4 years) |
| North America ethane-cracker build-out lowering PE-wax cost curve | +0.5% | United States, Canada; indirect benefit to Asia-Pacific importers | Short term (≤2 years) |
| Candle premiumisation and wellness trend expanding global paraffin demand | +0.4% | Global, early gains in North America and Western Europe | Medium term (2-4 years) |
| Bio-based oleogels replacing saturated fats with natural waxes | +0.3% | Europe, North America, Brazil | Long term (≥4 years) |
| Source: Mordor Intelligence | |||
Asia-Pacific E-commerce Boom Boosting Hot-Melt Packaging and FT Wax Demand
Asia-Pacific’s wax consumption is growing significantly owing to rapid industrialization in the region. Monthly Chinese paraffin exports hit 70,800 tons in May 2025, evidence of strong downstream demand from packaging converters[1]China Customs, “Monthly Paraffin Export Statistics,” customs.gov.cn. Sasol introduced SASOLWAX LC100 in August 2024, cutting the product's carbon footprint by 35% to target premium e-commerce packaging. Clariant’s rice-bran-based Ceridust 1310, launched in April 2025, secures printing-ink performance with improved sustainability metrics. With no stringent wax-specific regulation, ISO 9001 certification and brand carbon reporting now influence supplier selection.
Clean-Label Cosmetics in Europe Accelerating Plant and Bee-Based Wax Shift
European brands are reformulating to exclude synthetic hydrocarbons, spurring demand for candelilla, carnauba, rice-bran, and sunflower wax alternatives. Licocare RBW Vita reduces the carbon footprint by 80% compared with carnauba yet replicates hardness and gloss, helping premium brands meet Scope-3 goals. Beeswax retains multifunctional appeal but faces substitution as vegan lines proliferate, and fluctuating honey output makes supply planning complex. The EU microplastics ban in rinse-off cosmetics, effective October 2028, tips formulation choices toward natural texturizers. Compliance costs rise under EU Regulation 1223/2009 and REACH, but these same rules underpin higher selling prices for certified grades.
North America Ethane-Cracker Build-Out Lowering PE-Wax Cost Curve
U.S. ethane output averaged 3.0 million barrels per day in May 2024, underpinning competitive ethylene and polyethylene wax chains[2]U.S. Energy Information Administration, “Petroleum Supply Monthly,” eia.gov. ExxonMobil’s Baytown expansion, due 2028, blends Group III base stocks with specialty waxes, extracting margin uplift from integrated operations. Braskem’s sugarcane-based polyethylene wax showcases renewable potential but remains capacity-constrained in Brazil. Lower U.S. feedstock costs narrow the price gap with paraffin, boosting PE-wax penetration in packaging and candles. European refiners, by contrast, exit commodity fuels—as seen in Shell’s Wesseling refinery transformation—to chase higher-value specialties.
Candle Premiumisation and Wellness Trend Expanding Global Paraffin Demand
Premium candles demand high-melting-point paraffin for extended burn and superior scent throw at a raw-material cost of USD 1.50–2.00 per kg, far below the USD 8–12 per kg beeswax range. Wellness positioning keeps sales stable year-round, with U.S. imports of scented candles growing 5% year-on-year in 2025. China produced 123,800 tons of paraffin in July 2025, most of which flowed into export-oriented candle plants. Retailers increasingly mandate third-party PAH tests to stay within the EU 50 mg/kg limit, nudging suppliers toward hydrotreating upgrades. Microcrystalline waxes, prized for oil-binding capacity, are also gaining popularity as brands widen product lines to include wax melts.
Restraint Impact Analysis*
| Restraints | (~) % Impact on CAGR Forecast | Geographic Relevance | Impact Timeline |
|---|---|---|---|
| European Union REACH PAH limits tightening on paraffin in toys and cosmetics | -0.4% | EU-27, United Kingdom; indirect impact on exporters to EU | Short term (≤2 years) |
| Crude and gas price volatility squeezing synthetic and paraffin margins | -0.3% | Global, acute in Europe and ASEAN import-dependent countries | Short term (≤2 years) |
| Vegan-cosmetic reformulations substituting beeswax with oleochemicals | -0.2% | Europe, North America, urban Asia-Pacific | Medium term (2-4 years) |
| Source: Mordor Intelligence | |||
European Union REACH PAH Limits Tightening on Paraffin in Toys and Cosmetics
From April 2026, the REACH amendment caps polycyclic aromatic hydrocarbons in clay targets, toys, and paraffin-bearing cosmetics at 50 mg/kg. Slack-wax-based paraffin carries higher inherent PAH content, prompting investments in hydrotreating that add USD 100–200 per ton to cost. Clariant’s PFAS-free additives portfolio dovetails with these changes, positioning the company favorably among premium formulators. The restriction spills into food-contact inks under EU Regulation 1935/2004, where migration testing now forms part of supplier audits. Asian exporters not bound by REACH retain a cost edge, yet multinationals increasingly harmonize across regions to simplify compliance.
Crude and Gas Price Volatility Squeezing Synthetic and Paraffin Margins
Paraffin margins fall whenever crude strengthens faster than fuel-oil cracks, while FT waxes feel the squeeze from spot LNG spikes. Sasol’s wax division recorded impairments of ZAR 364 million in 2025, illustrating sensitivity to natural-gas prices. Slack wax availability tracks lube-oil demand; any slide in automotive mileage tightens feedstock supply for paraffin producers. FT players with long-term gas contracts—such as Pearl GTL in Qatar—temper volatility but remain exposed when Brent/LNG ratios shift unfavorably. Smaller independents hedge by toll processing or fixed-price feedstock deals, though these cut flexibility in boom markets.
*Our forecasts treat driver/restraint impacts as directional, not additive. The impact forecasts reflect baseline growth, mix effects, and variable interactions.
Segment Analysis
By Type: Paraffin Dominance Faces Natural-Wax Disruption
Paraffin held 58.12% of 2025 volume, anchored by China’s 2 million-ton output and a cost advantage of USD 1.50–2.00 per kg. Natural grades are rising at a 3.45% CAGR, the highest among types, as European brands favor plant-derived waxes for cleaner labels. Synthetic FT and polyethylene waxes fill high-performance niches in hot-melt adhesives and coatings. SASOLWAX LC100, unveiled in 2024, lowers carbon footprint by 35%, expanding premium packaging appeal. Clariant’s rice-bran Licocare series demonstrates low-carbon innovation in natural waxes, underscoring a steady shift away from pure mineral grades.
China’s share of paraffin exports keeps the wax market liquid, but tightening PAH norms in the EU incentivize blends with purified microcrystalline fractions. While paraffin remains king in candle making due to superior scent throw, soy and coconut blends nibble at share in vegan lines. Microcrystalline fractions service specialty rubber and cosmetics, fetching premiums for 55–100 °C melting points. Brazil’s 17,844-ton carnauba output gives natural wax suppliers bargaining power in price negotiations. Collectively, these dynamics foreshadow a slow yet steady erosion of paraffin’s wax market share over the next decade.


By Application: Cosmetics Outpace Candles in Growth Velocity
Candle making absorbed 60.32% of 2025 volume, yet cosmetics will expand the fastest at 3.68% CAGR through 2031, driven by PFAS-free and vegan reformulations. Packaging, powered by Asia-Pacific e-commerce, benefits from wax-rich hot-melt systems. Rubber applications rely on paraffin at roughly 1 phr in tire formulas to counter ozone cracking. Cosmetic-grade beeswax, carnauba, and candelilla deliver emulsification and gloss, justifying prices of USD 8–12 per kg.
Hot-melt demand lifts polyethylene and FT fractions with narrow molecular-weight distributions. Crayons, polishes, and electrical insulation represent niche but sticky outlets for microcrystalline grades. Clariant’s Ceridust 1310 brings rice-bran wax into printing inks, spotlighting cross-application innovation. Wellness-inspired candles, now sold year-round, pull high-melting-point paraffin, keeping solid waxes dominant. Cosmetics’ superior growth trajectory nonetheless signals that the wax market size linked to beauty applications will capture incremental value.
By Grade: Industrial Wax Leads, Cosmetic Grades Accelerate
Industrial grades accounted for 65.24% of the 2025 volume, serving adhesives, rubber, and textile coatings. Cosmetic and pharmaceutical grades, however, will grow at 3.39% CAGR to 2031 as regulatory thresholds for PAHs and UV-absorbance tighten under FDA 21 CFR 172.886 and EU E 903. Food-grade compliance likewise demands molecular-weight checks under FDA 172.888, increasing quality-control spend.
Carnauba and rice-bran waxes fetch premiums for GRAS status, with carnauba trading around USD 10 per kg FOB Brazil. Hydrotreatment upgrades raise production costs for paraffin, narrowing price gaps and nudging customers up the purity ladder. Clariant’s PFAS-free portfolio helps formulators de-risk ahead of 2028 microplastic bans. Consequently, the wax market size for higher-grade material will outpace bulk volumes, amplifying value-over-tonnage dynamics.
By Form: Solid Waxes Dominate, Emulsions Gain in Packaging
Solid waxes held 70.26% of the 2025 supply, thanks to candle, cosmetic, and rubber processing norms. Emulsions and liquids, however, will rise at a 3.31% CAGR because packaging lines favor ready-to-use, low-VOC systems. Sasol’s LC Spray series, rolled out in February 2025, trims carbon footprint by 32% for micronized coating uses, underpinning the shift toward aqueous dispersions.
Powdered waxes deliver matting in powder coatings, while liquid oxidized polyethylene aids PVC processing by reducing fusion torque. Asia-Pacific converters prefer emulsions for corrugated-box production to minimize energy usage, reinforcing demand for specialty dispersions. Overall, momentum toward liquids and emulsions will gradually reduce the solid wax’s market share but will lift aggregate margins.
Geography Analysis
Asia-Pacific controlled 45.54% of 2025 global volume and is forecast to expand at a region-leading 3.27% CAGR through 2031, propelled by China’s 2 million-ton output and robust e-commerce packaging. Utilization at CNPC’s wax units averages 90%, underscoring supply reliability. India’s domestic candle and cosmetic clusters start to displace imports, yet still rely on slack wax cargos from China and the Middle East.
North America benefits from a shale-gas-driven cost edge: ethane at Henry Hub parity keeps polyethylene wax competitive. Premium candle sales and private-label packaging bolster demand, while Mexico positions itself as a low-cost converter feeding U.S. auto and e-commerce channels. Continued ethane cracker expansions suggest that the region’s wax market will enjoy a structural input-cost advantage.
Europe confronts headwinds: REACH PAH limits push suppliers to invest in hydrotreating, raising break-evens by USD 150 per ton. Clean-label initiatives in Germany and France boost natural wax uptake, but refinery exits—such as Shell’s Wesseling pivot—tighten local supply. South America relies heavily on Brazil’s 17,844-ton carnauba crop for export revenues, while Petrobras captures byproduct paraffin from its 1.851 million bpd refining system. Middle East and Africa remain net importers despite abundant crude: Saudi Arabia imported 2,077 tons of wax in 2023, highlighting a mismatch between feedstock availability and specialty processing.

Competitive Landscape
The wax market is moderately consolidated, with leading players capitalizing on captive feedstock to hold cost leadership. Sasol and Clariant spearhead low-carbon innovation: SASOLWAX LC100 lowers carbon footprint by 35% and targets premium packaging, while Clariant’s PFAS-free range caters to cosmetics and food-contact polymers. AWAX Group’s January 2025 purchase of Sasol Wax GmbH signals European consolidation and an appetite for portfolio breadth. Battery-separator waxes constitute a lucrative frontier, demanding ultra-pure paraffin that prevents dendrite formation. Fraunhofer IKTS pilots FT wax from biogas and CO₂, pointing to a future green supply. Oleochemical challengers, leveraging palm-kernel and sunflower feedstocks, court vegan cosmetics and threaten beeswax incumbents. Braskem’s sugarcane polyethylene wax proves renewables can meet performance metrics, but scale remains an obstacle. Vertical integration, product stewardship, and lifecycle disclosures are emerging as decisive differentiators in the wax market.
Wax Industry Leaders
Exxon Mobil Corporation
China Petrochemical Corporation
Shell plc
Sasol Ltd.
H&R GROUP
- *Disclaimer: Major Players sorted in no particular order

Recent Industry Developments
- April 2025: Clariant launched Ceridust 1310, a rice-bran wax blend that enhances rub resistance in flexible-packaging inks.
- February 2025: Sasol introduced SASOLWAX LC Spray 30 G and 30 G-EF micronized FT waxes, cutting product carbon footprint by 32%, for coatings and inks in Europe and North America.


Research Methodology Framework and Report Scope
Market Definitions and Key Coverage
Our study defines the global wax market as the annual production and trade of paraffin, microcrystalline, synthetic Fischer-Tropsch, and plant-derived solid waxes that feed candles, packaging, cosmetics, rubber compounding, and industrial coatings. We size the market chiefly in metric tons so the numbers align with how refineries and specialty plants report output.
We exclude specialty downstream blends; therefore, we leave out phase-change materials and depilatory strips that already carry additives.
Segmentation Overview
- By Type
- Paraffin and Mineral Wax
- Synthetic Wax
- Natural Wax
- By Application
- Candle Making
- Packaging
- Cosmetics
- Adhesives
- Rubber
- Other Applications
- By Grade
- Food Grade
- Industrial Grade
- Cosmetic and Pharmaceutical Grade
- By Form
- Solid
- Powdered
- Emulsions and Liquids
- By Geography
- Asia-Pacific
- China
- India
- Japan
- South Korea
- ASEAN
- Rest of Asia-Pacific
- North America
- United States
- Canada
- Mexico
- Europe
- Germany
- United Kingdom
- France
- Italy
- Spain
- Rest of Europe
- South America
- Brazil
- Argentina
- Rest of South America
- Middle East and Africa
- Saudi Arabia
- South Africa
- Rest of Middle East and Africa
- Asia-Pacific
Detailed Research Methodology and Data Validation
Primary Research
We spoke with Asian and European candle producers, global packaging converters, refinery off-take managers, and cosmetic-wax formulators. These discussions let us validate utilization rates, regional average selling prices, and substitution trends that secondary data only hinted at.
Desk Research
Mordor analysts pulled primary datasets from United Nations Comtrade (HS 271290, 340490), the Energy Information Administration's refinery yield files, Eurostat PRODCOM wax tables, International Energy Agency fuel-substitution outlooks, and the Federation of European Candle Makers' shipment notes. We enriched those with company 10-Ks, investor presentations, and Questel patent counts to trace technology shifts, while news on Dow Jones Factiva plus financials in D&B Hoovers tracked capacity additions. The cited sources are illustrative; many further public records were consulted for context and confirmation.
Market-Sizing & Forecasting
We adopt a top-down production-plus-trade rebuild to anchor the 2025 baseline. We then compare outputs with sampled supplier roll-ups and ASP × volume approximations to refine totals. Variables such as refinery throughput, Fischer-Tropsch capacity, candle export tonnage, per-capita personal-care spending, synthetic-to-paraffin price spreads, and REACH-driven bio-wax uptake feed a multivariate ARIMA model that projects demand to 2030. Bottom-up gaps are closed with volume proxies from channel checks before sign-off.
Data Validation & Update Cycle
Our team runs variance thresholds, flags anomalies, and re-contacts sources when gaps widen. Reports refresh each year, with interim updates for feedstock shocks or major capacity closures so clients receive the latest view.
Why Mordor's Wax Market Tonnage Baseline Is Dependable
We recognize that published estimates often diverge because firms pick different scopes, metrics, and refresh cadences.
Key gap drivers include the mixing of ancillary derivatives, the use of single regional ASPs for world totals, and forecasts tethered mainly to crude-price heuristics. Mordor recalculates tonnage annually from live trade flows and fresh interviews, giving users a traceable, metric-aligned baseline.
Benchmark comparison
| Market Size | Anonymized source | Primary gap driver |
|---|---|---|
| 4.68 million tons (2025) | Mordor Intelligence | |
| USD 10.84 billion (2024) | Global Consultancy A | Blends mineral, synthetic and natural wax values; volume unknown; fixed 2023 ASP applied globally |
| USD 11.4 billion (2025) | Global Consultancy B | Focuses on industrial grades only; omits natural wax; broad margin assumptions replace primary price checks |
| USD 14.7 billion (2024) | Industry Association C | Aggregates multiple derivatives and specialty blends; unclear split between paraffin and specialty grades |
The comparison shows that when scope, unit of measure, and validation steps vary, totals drift. Mordor's disciplined variable selection, yearly recalibration, and clear audit trail deliver a balanced baseline that decision-makers can trust.


Key Questions Answered in the Report
How large is the wax market in 2026?
The wax market size is estimated at 4.72 million tons in 2026 and is forecast at 5.40 million tons by 2031.
Which region grows the fastest to 2031?
Asia-Pacific leads with a projected 3.27% CAGR, supported by China’s large paraffin output and e-commerce packaging demand.
What segment shows the quickest growth?
Cosmetics wax applications advance at a 3.68% CAGR, outperforming candles and packaging.
How are EU regulations affecting paraffin suppliers?
REACH limits of 50 mg/kg PAHs effective April 2026 compel refiners to invest in hydrotreating or pivot to natural and synthetic alternatives.
Why are bio-based oleogels important?
Oleogels structured with natural waxes lower trans- and saturated-fat content in foods, aligning with nutrition guidelines and clean-label trends.
Which companies lead low-carbon wax innovation?
Sasol, with its SASOLWAX LC100 line, and Clariant, with Licocare RBW Vita and PFAS-free additives, are frontrunners in carbon-reduced wax solutions.
Page last updated on:


