
Acetic Acid Market Size and Share
Acetic Acid Market Analysis by Mordor Intelligence
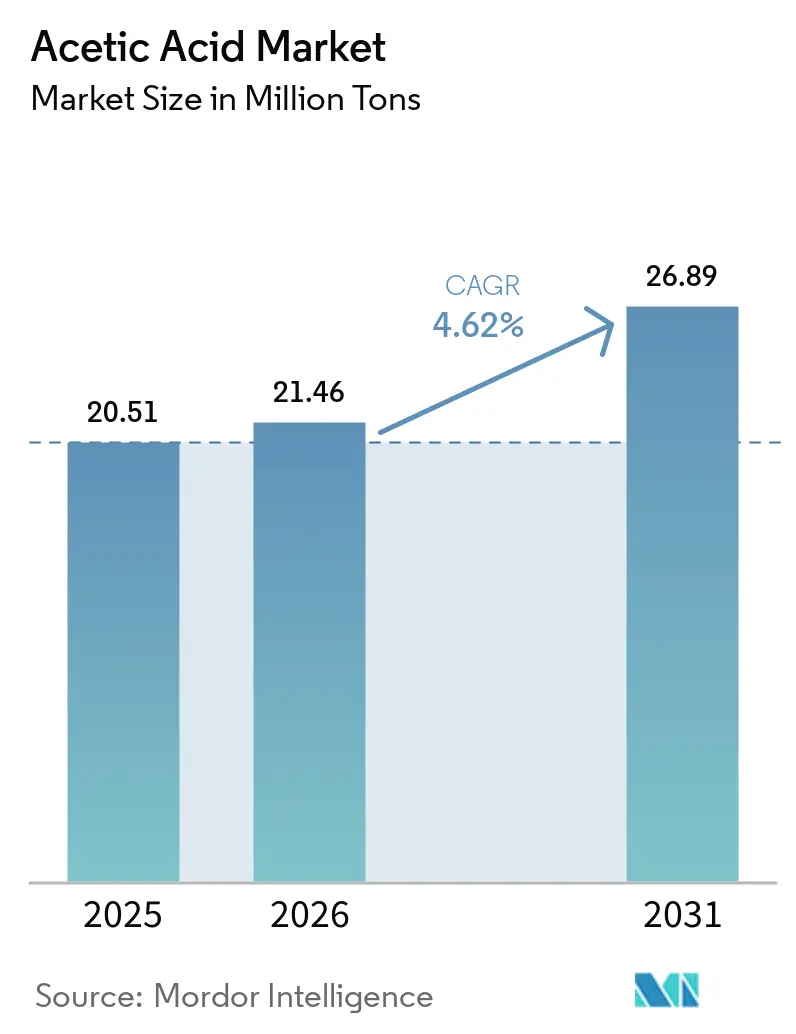
The acetic acid market size is expected to grow from 21.46 million tons in 2026 to 22.45 million tons in 2027 and is forecast to reach 27.78 million tons by 2032 at 4.35% CAGR over 2027-2032.
Downstream polymer production and purified terephthalic acid investment in China give acid demand an operating industrial base and a route to expand through derivative manufacturing. Variable methanol costs and duties on Chinese exports make conversion returns and commercial access to industrial buyers important constraints on the capture of that growth. Integrated carbonylation chains compete on methanol cost and scale, while bio-based supply competes on carbon footprint and delivery reliability for buyers with emission-reduction goals. Returns favor producers that secure methanol and place output into VAM and PTA chains, while Chinese exporters serving U.S. industrial users must also recover the tariff cost.
Key Report Takeaways
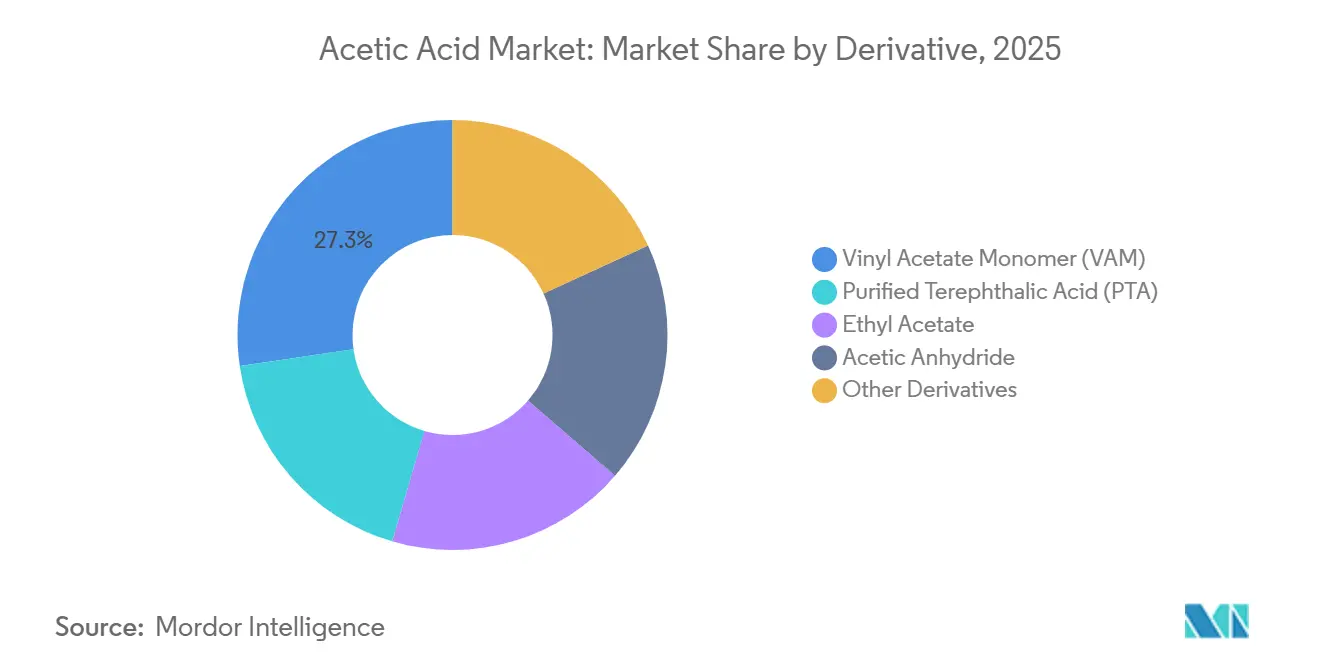
- By derivative, vinyl acetate monomer led with a 27.31% acetic acid market share in 2026, while purified terephthalic acid is forecast to be the fastest-growing segment at a 4.75% CAGR over 2027-2032.
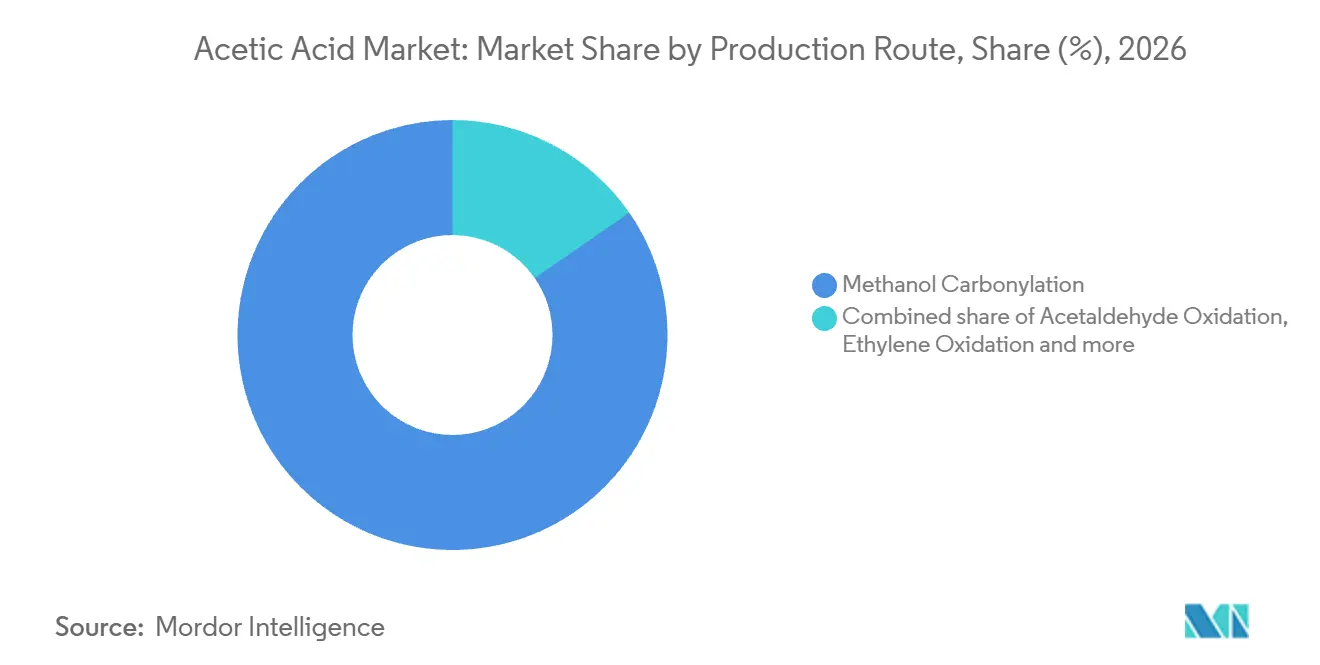
- Among production routes, methanol carbonylation accounted for an 84.64% share of the acetic acid market size in 2026, and bio-based fermentation is forecast to be the fastest-growing segment at a 5.4% CAGR over 2027-2032.
- Across applications, adhesives, paints and coatings led with 36.76% of global acetic acid volume in 2026, while medical applications are forecast to be the fastest-growing segment at a 6.3% CAGR over 2027-2032.
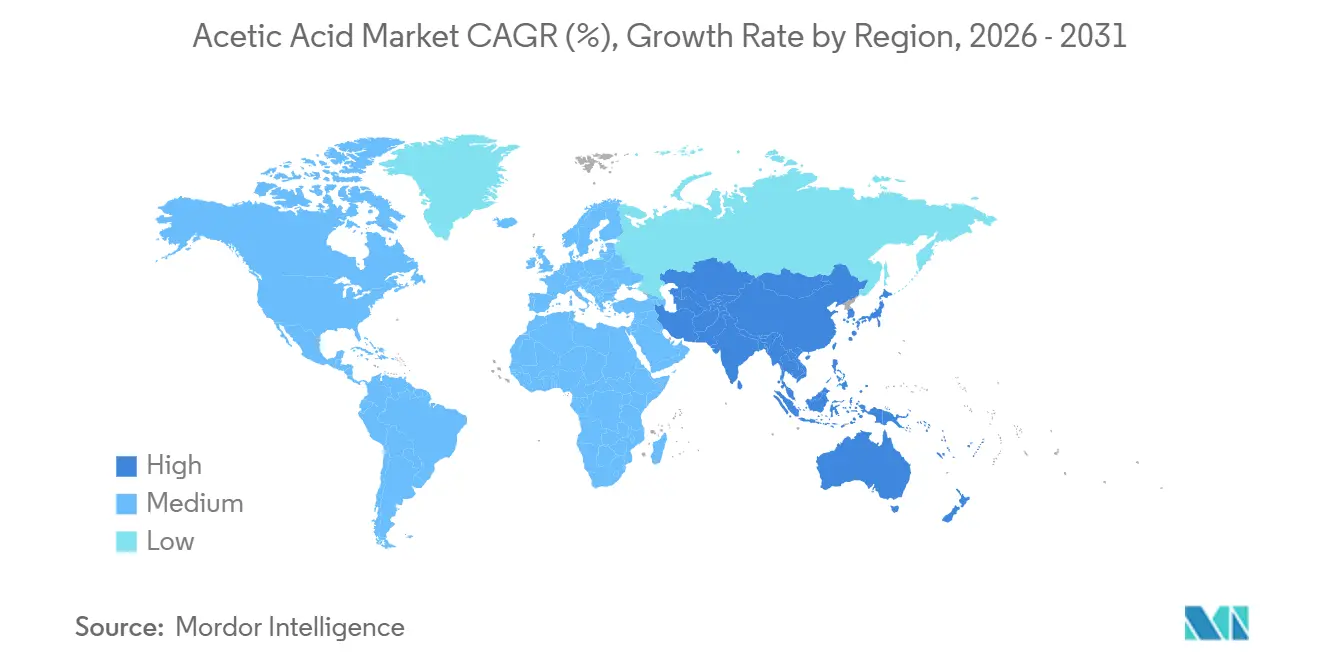
- Geographically, Asia-Pacific held the lead with 69.56% of global acetic acid volume in 2026 and is also forecast to be the fastest-growing region at a 4.95% CAGR over 2027-2032.
Note: Market numbers in this report are based on Mordor Intelligence's proprietary estimation framework, which combines nine months of actuals with Q4 projections for base year 2026.
Market Trends and Insights
Drivers Impact Analysis of Acetic Acid Market*
| Driver | (~) % Impact on CAGR Forecast | Geographic Relevance | Impact Timeline |
|---|---|---|---|
| Surging Vinyl Acetate Monomer Demand | +2.2% | China and Japan | Short term (≤ 2 years) |
| Steady PTA Capacity Additions in Asia | +1.8% | China and India | Medium term (2-4 years) |
| Expansion of Acetate-Ester Solvents in High-Solids Coatings | +1.1% | North America, Europe and Asia-Pacific | Medium term (2-4 years) |
| Bio-Based Acetic Acid Pathways Scaling Under Net-Zero Mandates | +0.6% | Germany and the United States | Medium term (2-4 years) |
| CO₂-to-Acetic Acid Electrosynthesis Pilots | +0.1% | Asia-Pacific, North America and Europe | Long term (≥ 4 years) |
| Source: Mordor Intelligence | |||
Surging Vinyl Acetate Monomer Demand
Vinyl acetate monomer (VAM) demand connects acetic acid suppliers with both an established consumption base and expansions in downstream polymer production. China’s apparent VAM consumption was about 2.93 million metric tons in 2025, according to China Chemical Economic and Technical Development Center data cited by Jiangsu SOPO.[1] In 2026, Sinopec subsidiary Chongqing Chuanwei Chemical started up a specialty polyvinyl alcohol (PVA) resin unit in China with annual capacity of 50,000 metric tons. VAM is used to manufacture PVA, whose applications include adhesives, coatings and water-soluble packaging films. The unit produced qualified product and shipped its first batch to Europe, linking its VAM-derived production requirements to export customers as well as China’s domestic consumption base.
Steady PTA Capacity Additions in Asia
Purified terephthalic acid (PTA) project commissioning creates a concrete downstream production opportunity for acetic acid suppliers serving Asian industrial customers. In August 2025, Jiangsu Hailun Petrochemical put a PTA technical-upgrade and expansion project into operation in Jiangyin, Jiangsu, China. The project had annual capacity of 3.2 million metric tons, and its operator is a subsidiary of Jiangsu Sanfame Polyester Material. Celanese’s 2025 annual report identifies acetic acid as primarily used to manufacture VAM, PTA and other acetyl derivatives. The commercial benefit comes from serving the project’s acetic acid requirements, with independent producers needing an agreed supply role to translate the downstream expansion into their own sales.
Expansion of Acetate-Ester Solvents in High-Solids Coatings
Acetate-ester requirements determine how expansion in high-solids coatings translates into demand for the acid used to make those solvents. The commercial opportunity depends on both the amount of coating produced and the acetate-ester portion of its formulation. Additional acetic acid requirements arise at the ester producer serving those formulations. Higher coating output can increase that requirement, while a lower acetate-ester intensity can offset part of the volume opportunity. Formulation mix decides acid volume as much as coating output does.
Bio-Based Acetic Acid Pathways Scaling Under Net-Zero Mandates
Commercial distribution infrastructure helps a bio-based production pathway serve customers that need dependable industrial supply. Lenzing and Speyer & Grund commissioned a dedicated bio-based acetic acid storage tank at Speyer & Grund’s Meerane site in Germany on April 10, 2025.[2] Lenzing produced the acid as a pulp-production by-product, and the expanded storage increased supply flexibility. Lenzing’s 2025 annual report states that a Quantis life-cycle analysis found the product’s carbon footprint more than 85% lower than comparable fossil-based products, giving buyers with emission-reduction goals a measurable reason to specify it. The tank’s exclusive use for Lenzing’s bio-based acid allows that differentiated product to be handled under its own identity in Germany.
Restraints Impact Analysis of Acetic Acid Market*
| Restraint | (~) % Impact on CAGR Forecast | Geographic Relevance | Impact Timeline |
|---|---|---|---|
| Volatile Methanol Feedstock Pricing | -0.8% | India and North America | Short term (≤ 2 years) |
| Anti-Dumping and Tariff Actions on Chinese Exports | -0.5% | United States and China | Short term (≤ 2 years) |
| Rhodium/Iridium Catalyst Supply Risk | -0.2% | China, North America and Europe | Medium term (2-4 years) |
| Source: Mordor Intelligence | |||
Volatile Methanol Feedstock Pricing
Methanol-price variation makes the relationship between feedstock costs and acid selling prices a constraint on expansion economics. Gujarat Narmada Valley Fertilizers & Chemicals Limited (GNFC) showed methanol prices varying from FY 2021-22 through FY 2025-26 alongside acetic acid prices in its company-specific Indian feedstock-spread chart. Methanex’s average realized methanol selling price rose to USD 361 per metric ton in 2025 from USD 355 per metric ton in 2024. Its 2025 annual report characterized methanol prices as historically volatile and cyclical and expected that pattern to continue. GNFC also lists methanol production, so part of its methanol cost may reflect captive supply rather than external purchases. Higher methanol costs can absorb an acid-price gain, leaving externally sourced production exposed even when acid selling prices rise.
Anti-Dumping and Tariff Actions on Chinese Exports
Beginning July 24, 2026, the U.S. Trade Representative’s 12.5% Section 301 duty covered Chinese acetic acid under HTSUS 2915.21.00, except articles for pharmaceutical use.[3] Specified goods loaded and in transit before July 24 were excepted if they entered before July 28, 2026. That end-use distinction makes accurate classification commercially relevant because the same tariff code does not imply the same duty treatment. The additional charge can narrow the price advantage of covered industrial imports in U.S. sales. Holding the pre-duty delivered price would require Chinese exporters to absorb the added charge on covered industrial shipments.
*Our forecasts treat driver/restraint impacts as directional, not additive. The impact forecasts reflect baseline growth, mix effects, and variable interactions.
Acetic Acid Market Segment Analysis
By Derivative:
VAM Production Supports Established DemandVinyl acetate monomer (VAM) accounted for a 27.31% share of the acetic acid market size in 2026. Japan produced 444,939 metric tons of VAM in 2025. That national output illustrates an operating Japanese manufacturing base that requires acid feedstock as derivative production occurs. Acid suppliers serving those Japanese VAM producers therefore have a recurring feedstock-supply role tied to operating output, extending the opportunity beyond initial plant commissioning.
Purified terephthalic acid (PTA) is forecast to be the fastest-growing derivative segment, at a 4.75% CAGR over 2027-2032. Separation-technology supplier Sulzer describes PTA production as p-xylene oxidation in acetic acid, followed by solvent recovery that separates acetic acid from reaction water. SASA commissioned its PTA plant in Türkiye in the first quarter of 2025 with annual production capacity of 1.75 million metric tons. The investment completed a vertical integration step in SASA’s polyester production chain. The oxidation-solvent and recovery steps make acid handling and separation part of process design for an integrated PTA plant such as SASA's.

By Production Route:
Carbonylation Integration and Fermentation DevelopmentMethanol carbonylation held 84.64% of the market in 2026, making it the largest production-route segment. In its 2026 half-year report, China-based Jiangsu SOPO Chemical Co., Ltd. reported 1.2 million metric tons of annual acetic acid capacity using methanol carbonylation. The company’s manufacturing chain extends from coal-based gas to methanol and then to acid. The example shows how a producer can support substantial acid capacity with a connected upstream gas and methanol manufacturing system, making integration part of the route’s commercial proposition.
Bio-based fermentation is forecast to be the fastest-growing production-route segment, at a 5.4% CAGR over 2027-2032. In May 2025, HELM AG reported that Again had begun construction in Texas City, United States, on a facility intended to produce chemicals including acetic acid. The process uses bacteria to ferment waste CO₂ with hydrogen, and HELM AG was identified as the future distribution partner. That announcement targeted production within a year. The combination of a different production route and an identified distribution partner connects technology development with a route to industrial customers.
By Application:
Formulation Inputs and Medical SpecificationsAdhesives, paints and coatings represented a 36.76% acetic acid market share in 2026. Korea Alcohol Industrial makes acetate-ester solvents with glacial acetic acid and identifies paints and adhesives as ethyl acetate applications. Industrial acid suppliers can serve an ester manufacturer whose output becomes an ingredient in the final formulation. That creates a demand chain in which the chemical requirements of a coating or adhesive formulation determine the opportunity available to the upstream acid producer.
Medical applications are forecast to be the fastest-growing segment, at a 6.3% CAGR over 2027-2032. Serving this segment requires suppliers to define the intended medical application before committing an acid grade. A specification tied to that use gives the supplier a concrete qualification target rather than treating medical growth as demand for interchangeable industrial volume.
Geography Analysis
Asia-Pacific Acetic Acid Market
Asia-Pacific accounted for 69.56% of the acetic acid market size in 2026 and is forecast to grow at a 4.95% CAGR over 2027-2032, making it the largest and fastest-growing geography. Handsome Chemical commissioned a 600,000-metric-ton acetic acid plant in Jingmen, Hubei, China, in May 2025. Handsome Chemical’s plant was scheduled for gradual capacity release in the second half of 2025, according to Yip’s Chemical Holdings, which reported a 24% effective stake in the producer. Yip's described Handsome Chemical as the world's largest acetate solvents company and reported planned simultaneous release of 600,000 metric tons of acetate capacity, pairing the acid expansion with the producer's downstream manufacturing.
North America’s feedstock integration is illustrated by Celanese’s Clear Lake, Texas, methanol joint venture with Mitsui, in which Celanese owns 50%. Celanese reported that its share of Fairway Methanol production and a long-term Mitsui contract met almost all its North American methanol needs in 2025. Europe faced production-cost pressure as INEOS announced on September 22, 2026, that it would mothball all 3 Hull Acetyls units until further notice because of uncompetitive energy costs. At that date, 2 units had ceased production and the third was due to stop within days. Mothballing the units INEOS described as Europe's last remaining world-scale Acetyls facilities would remove that local scale option for European buyers for the shutdown's duration.
In South America's other markets, the European Commission identified Sucroal S.A. as Colombia's sole acetic-acid producer in its September 2025 ruling. Elsewhere in Europe, the Netherlands recorded gross acetic acid imports of 51,896.2 metric tons from the world in 2025, illustrating an import channel within the region. In Asia-Pacific's other markets, Pakistan's Noventra Limited (formerly LOTTE Chemical Pakistan Ltd.) uses acetic acid as the solvent in paraxylene oxidation to produce PTA. Within Middle-East and Africa's other markets, Egypt reported gross acetic acid exports of 9.98 metric tons to the world in 2025. Under that Colombian supply structure, switching to another producer would mean sourcing beyond domestic production.
Mordor Intelligence provides coverage of the acetic acid market across other key regional markets, including North America and Asia, each with their regulatory frameworks and demand patterns. Detailed country-level analysis extends to India incorporating local coverage and market participation, as required.
Regulatory Framework and Outlook
The table compares selected jurisdictions from the perspective of industrial glacial acetic acid producers and importers, focusing on classification, hazard communication and inventory reporting. China's hazardous chemicals catalogue lists acetic acid above 80% concentration, while Brazil's Law 15.022/2024 sets a reporting threshold of 1 metric ton annually per substance, averaged over the previous 3 years. United States manufacturers, importers and distributors evaluating substances faced a May 19, 2026 deadline under the revised Hazard Communication Standard. For mixtures, manufacturers, importers and distributors must comply by November 19, 2027, and employers must make any necessary workplace label, program and training updates by May 19, 2028.
Regulatory Table of Acetic Acid Market
| Decision factor | China | United States | Germany | Brazil | South Africa |
|---|---|---|---|---|---|
| Primary authority | Ministry of Emergency Management for safety and registration | Occupational Safety and Health Administration | Federal Chemicals Agency at the Federal Institute for Occupational Safety and Health | Statutory Technical and Deliberative Chemical Substances Committees | Department of Employment and Labour |
| Key instruments or direction | Hazardous Chemicals Safety Law and hazardous-chemical registration measure | 29 CFR 1910.1200 Hazard Communication Standard | EU classification, labeling and packaging (CLP) Regulation (EC) No. 1272/2008 and specified amended provisions | Law 15.022/2024 chemical-substances framework | Hazardous Chemical Agents Regulations, 2021 |
| Commercial effect | Producers and importers register listed acid; sellers provide compliant safety data sheets and labels | Manufacturers and importers classify chemicals and obtain or develop safety data sheets for hazardous chemicals | Classify before market placement; label and package hazardous products | Above-threshold producer/importer reporting; initial 3-year period starts with database availability | Hazard assessment before workplace supply; hazardous-agent classification, safety data sheets and correct labels |
| Current policy attractiveness | Medium | Medium | Medium | High | Medium |
| Future direction of policy attractiveness | No change | No change | Hardening | Hardening | No change |
| Source: Mordor Intelligence | |||||
China’s core registration and documentation duties continue under its May 1, 2026 law, with broader update triggers and explicit Chinese-language and seller-delivery requirements incorporated into the baseline for No change. For glacial acid evaluated as a substance, the passed U.S. deadline supports No change because later phases govern mixtures, whereas Germany's specified CLP derogations end December 31, 2026, supporting Hardening. Brazil's High rating reflects continued production, import and use during the 3-year registration period starting with database availability, while Hardening reflects enacted reporting duties whose implementation a 2026 federal Attorney General's Office opinion said required a decree and Deliberative Committee. South Africa's Medium rating reflects workplace supply duties, while its Department of Employment and Labour's 2025/26 performance report recorded a review of the 2021 regulations, supporting No change without an implemented replacement or new compliance date.
Value Chain Stages
The comparison follows methanol supply, acetic acid production and the commercial agreements connecting producers with customers. Methanex sold 9.52 million metric tons of methanol in 2025, illustrating the scale of an upstream supplier serving the chemical industry. Value capture depends on the function performed, while resilience requires addressing both physical production commitments and the terms under which their output is sold.
Value Chain Analysis Table of Acetic Acid Market
| Primary activity | Key participants | Value capture | Bottleneck | Resilience response |
|---|---|---|---|---|
| Methanol supply | Methanol producers and suppliers such as Methanex | Methanol sales | Dependence on an available feedstock source | Qualify alternative sources before committing additional acid output |
| Acetic acid production | Acetic acid producers such as INEOS, Celanese Corporation and LyondellBasell Industries Holdings B.V. | Acetic acid product sales | Production commitments need an adequate commercial outlet | Link production commitments to contracted downstream requirements |
| Commercial sales | Producer sales businesses such as INEOS | Product sales under negotiated pricing formulas | Different price-reset schedules leave different cost exposure | Match reset frequency and formula coverage to the exposure retained |
| Source: Mordor Intelligence | ||||
Approximately 66% of INEOS Quattro’s Acetyls Business sales used cost-plus pricing in 2025. Prices for its remaining sales reflected monthly or quarterly customer negotiations or market indices. These arrangements place different portions of cost risk with the supplier even when the physical product follows the same production chain. Negotiation frequency matters most for the remaining sales, where a manufacturing-cost change can precede the next price reset.
Competitive Landscape
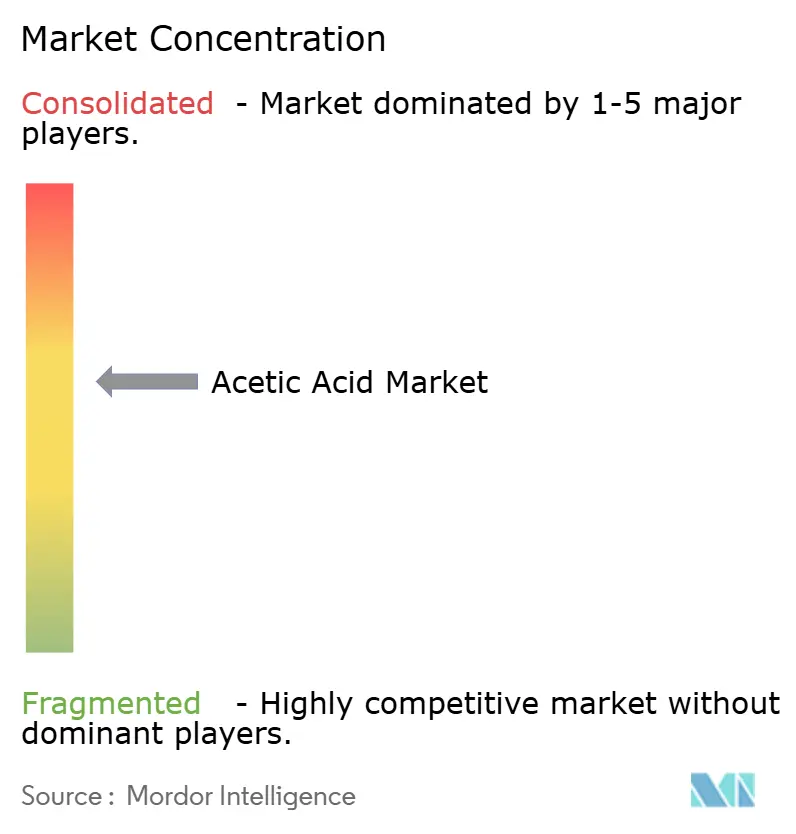
Established producers Celanese Corporation and INEOS compete with Jiangsu SOPO, Huayi Group and Yankuang Cathay in a moderately concentrated supplier field. INEOS Quattro contains INEOS’s Acetyls Business, which its 2025 report ranked second globally with an estimated 11% share of acetic acid production capacity, citing S&P Global. Eastman Chemical Company includes acetic acid and derivatives in its Intermediates portfolio and said in 2023 it would retain Kingsport acetyl manufacturing after selling its Texas City acetyl operations to INEOS. LyondellBasell Industries Holdings B.V. supplies glacial acetic acid, methanol and VAM, while Wacker Chemie AG uses acetic acid in specialty-chemical manufacturing. INEOS Quattro’s top 10 Acetyls Business customers generated 63% of that business’s 2025 revenue, making retention of major accounts commercially significant.
Celanese reported unaudited Acetyl Chain net sales of USD 4.23 billion in 2025, down from USD 4.76 billion in 2024. Net sales fell 11%, with price and volume each down 6% and a 1% currency benefit, reflecting oversupply-driven pricing across most products and weaker demand affecting volume, primarily in acetate tow. In August 2025, LyondellBasell announced a planned September La Porte turnaround to begin converting VAM production to a catalyst intended to improve margins and reduce precious-metal use. Celanese's results show how price and volume pressure can compound across an integrated portfolio, while LyondellBasell's stated strategy targeted the production cost of a specific derivative.
Wacker's feedstock strategy and U.S. import duties create distinct conditions for suppliers serving specialty-chemical and industrial buyers. In its 2025 annual report, Wacker said it was gradually replacing fossil acetic acid with biogenic grades certified as 100% sustainable, including certification examples such as ISCC and PEFC. For covered non-pharmaceutical Chinese imports, Section 301 adds a cost absent from acid made at INEOS's Texas City site, solely owned by its Acetyls Business since December 1, 2023. Domestic production and certified biogenic inputs therefore address different requirements for serving these buyers. Suppliers seeking Wacker's biogenic-grade business need to substantiate the feedstock certification that distinguishes those inputs from fossil acid.
Acetic Acid Industry Leaders
-
Celanese Corporation
-
INEOS
-
Eastman Chemical Company
-
LyondellBasell Industries Holdings B.V.
-
Wacker Chemie AG
- *Disclaimer: Major Players sorted in no particular order
Acetic Acid Market Companies Covered in this Report
- Celanese Corporation
- Daicel Corporation
- Eastman Chemical Company
- Gujarat Narmada Valley Fertilizers & Chemicals Limited
- INEOS
- Jiangsu SOPO (Group) Co., Ltd.
- Kingboard Holdings
- LyondellBasell Industries Holdings B.V.
- Mitsubishi Chemical Corporation
- PetroChina Company Limited
- SABIC
- Sekab
- Shandong Hualu Hengsheng Chemical Co., Ltd.
- Shanghai Huayi Energy Chemical Co., Ltd.
- Sipchem Company
- Tanfac Industries Ltd
- Wacker Chemie AG
- Yankuang Energy Group Company Limited
Key Opportunities for Market Participants
These opportunities compare low-carbon methanol supply for acetic acid production, prospective formulation work and commercial production partnerships. In April 2026, INEOS and Sandpiper announced a planned Texas City methanol project explicitly linked to INEOS’s acetic acid production. On January 21, 2026, Kemvera (formerly New Iridium) reported completing its initial process design package for a planned plant with approximately 50,000 metric tons of annual capacity for bio-based acetic acid and bio-ethyl acetate combined. Those milestones separate the task of developing a feedstock pathway from the work of qualifying an acid application and organizing production.
Market Opportunities Table of Acetic Acid Market
| Opportunity | Why now | Buyer / lead segment | Recommended play | Main barrier | Likely beneficiaries |
|---|---|---|---|---|---|
| Lower-carbon feedstock-linked acetic acid supply | April 2026 collaboration explicitly connected planned methanol supply with acid production | Acetic acid producers, including announced anchor customer INEOS | Develop acid supply proposals tied to a defined feedstock pathway | Investment commitment, with a 2027 decision targeted in the announcement | Acetic acid producers such as INEOS |
| Application development for bio-based acetic acid | January 2026 design milestone for a planned joint-product plant | Prospective footwear and disinfectant formulation developers evaluating the bio-based product pair | Qualify the acid component for a specified formulation before scaling supply | Turning prospective applications into qualified commercial requirements | Bio-based chemical developers such as Kemvera |
| Production partnerships for bio-based acid | Kemvera’s roadmap described commercial commissioning with a production partner | Prospective chemical production partners | Structure a partnership around engineering milestones and an agreed acid product specification | Engineering completion and the capital commitment needed for commercial scale | Chemical developers such as Kemvera and prospective production partners |
| Source: Mordor Intelligence | |||||
The central opening is to pair Kemvera’s bio-based acid with a defined formulation before committing the plant. Kemvera envisions near-term uses for its bio-acetic acid and bio-ethyl acetate products in footwear and disinfectants, and its roadmap targets FEL-3 completion in Q4 2026 and commercial-plant commissioning with a production partner in Q2 2028. Qualifying the acid for one of those formulations before a production-partner decision would give prospective investors a product specification and potential buyer requirement against which to assess the engineering commitment.
Recent Industry Developments in Acetic Acid Market
- Sep 2026: Citing uncompetitive energy costs, INEOS announced mothballing of all 3 Hull Acetyls units in the United Kingdom until further notice, with 2 having ceased production and the third then due offline within days.
- Jul 2026: Beginning July 24, the U.S. Trade Representative applied a 12.5% Section 301 duty to Chinese acetic acid under HTSUS 2915.21.00, except articles for pharmaceutical use. Goods loaded and in transit before July 24 were excepted if they entered before July 28.
- Apr 2026: INEOS and Sandpiper Chemicals announced a planned Texas City low-carbon methanol project in which INEOS would use up to 300,000 tons per year for its acetic acid production.
Acetic Acid Market Report Scope and Research Methodology
Market Definition and Coverage
Global acetic acid market measures annual metric tons of acetic acid produced for industrial and commercial use worldwide. The volume is classified by derivative demand, production route, application, and region.
Scope exclusions: Separately sold downstream derivative volumes and revenues, separately sold upstream inputs and catalysts, and finished downstream products are excluded.
Segments Covered in This Report
- By Derivative
- Vinyl Acetate Monomer (VAM)
- Purified Terephthalic Acid (PTA)
- Ethyl Acetate
- Acetic Anhydride
- Other Derivatives
- By Production Route
- Methanol Carbonylation
- Acetaldehyde Oxidation
- Ethylene Oxidation
- Bio-based Fermentation
- By Application
- Adhesives, Paints and Coatings
- Plastics and Polymers
- Food and Beverage
- Textile
- Medical
- Other Applications
- By Geography
- Asia-Pacific
- China
- India
- Japan
- South Korea
- ASEAN Countries
- Rest of Asia-Pacific
- North America
- United States
- Canada
- Mexico
- Europe
- Germany
- United Kingdom
- France
- Italy
- NORDIC Countries
- Rest of Europe
- South America
- Brazil
- Argentina
- Rest of South America
- Middle-East and Africa
- Saudi Arabia
- South Africa
- Rest of Middle-East and Africa
- Asia-Pacific
Data Sources, Market Sizing, and Validation
Desk Research
Public research uses sources such as the U.S. Census Bureau's international trade data for commodity trade flows, Eurostat's sold-production and trade statistics for chemical-sector context, and the U.S. EPA CompTox Chemicals Dashboard for chemical identity and public-use information. Peer-reviewed literature on acetic-acid fermentation and the Council for Scientific and Industrial Research's fermentation review help distinguish emerging biological production evidence from established industrial supply.
Company filings, investor materials, and reputable chemical-industry reporting can clarify operating capacity, outages, feedstock arrangements, project timing, and downstream demand signals. These sources can be cross-checked against trade and production series. These sources are not exhaustive, and further sources inform collection, validation and clarification.
Primary Interviews and Surveys
Interviews and structured surveys would target acetic acid producers, derivative manufacturers, distributors, and large industrial users, with respondents spanning commercial, operations, procurement, and planning roles. Their estimates would test secondary evidence on operating volumes, captive use, trade, and segment demand, while unresolved gaps would be documented and triangulated against independent production, capacity, and trade indicators.
Distribution of primary research fieldwork respondents
| Company type | Respondent position | Region |
|---|---|---|
| Top tier: 35% | CXOs: 15% | APAC: 50% |
| Mid tier: 45% | Functional/Unit leaders: 40% | EMEA: 28% |
| Smaller Players: 20% | Managers: 45% | Americas: 22% |
Market-Sizing & Forecasting
A top-down estimate begins with global acetic acid output and apparent supply available to industrial and commercial buyers, then reconciles reported exports, imports, and changes in supply where the public series permit. Producer capacity and utilization, plant start-ups or shutdowns, derivative demand in VAM and PTA chains, and regional trade balances serve as practical indicators, with capacity and utilization bounding near-term supply, derivative activity informing demand, and trade reallocating supply across regions. Historical volume patterns and those indicators can be projected with scenario analysis when capacity timing or utilization is uncertain, with primary experts checking the variable-level assumptions against operating conditions and customer demand. Missing observations are bounded with comparable producer or regional evidence and retained as explicit model gaps. Segment shares are built from evidence on route mix, derivative consumption, end-use demand, and regional production and trade, then checked so the categories reconcile to the global volume. Selective bottom-up checks use disclosed producer output or sampled capacity times utilization, with gaps in coverage flagged and reconciled to the top-down total rather than treated as a complete supplier roll-up.
Data Validation & Update Cycle
Analysts triangulate producer disclosures, customs flows, capacity and utilization signals, and downstream activity, checking that independently sourced indicators tell a coherent volume story. Outliers, unexplained year-to-year shifts, and material differences between the top-down estimate and selective producer checks are investigated through source review and analyst review before sign-off, with respondent re-contact triggered when a specific operating, timing, or scope assumption remains unresolved. The dataset is refreshed annually, revisited between cycles when a material start-up, closure, trade action, or production disruption changes the outlook, and given a fresh pre-delivery review for source dates, calculations, segment reconciliation, and consistency.
Mordor Intelligence's Acetic Acid Market Sizing Compared With Other Published Estimates
Published estimates can differ in the transactions and products they count and the inputs used to model demand. Global acetic acid market measures annual metric tons of acetic acid produced for industrial and commercial use worldwide.
Key Gap Drivers include the study's defined coverage and market-specific modeling choices. Producer capacity and utilization, plant start-ups or shutdowns, derivative demand in VAM and PTA chains, and regional trade balances serve as practical indicators, with capacity and utilization bounding near-term supply, derivative activity informing demand, and trade reallocating supply across regions.
Benchmark comparison
| Source | Market Size | Gaps in Research Methodology |
|---|---|---|
| Mordor Intelligence | 22.45 million tons (2027) | |
| Peer-reviewed Article A | 20.3 million tons (2024) | At its 2024 base, this estimate is 9.6% below this report's 2027 value of 22.45 million tons, 3 years later. The earlier forecast year places the estimate below the later comparison year. |
| Research Thesis B | 20 million tons (2025) | At its 2025 base, this estimate is 10.9% below this report's 2027 value of 22.45 million tons, 2 years later. The source reports a 2025 worldwide production projection, preceding the comparison year. |
Mordor Intelligence's analysts triangulate producer disclosures, customs flows, capacity and utilization signals, and downstream activity, checking that independently sourced indicators tell a coherent volume story.
Key Questions Answered in the Report
What is the acetic acid market size and growth outlook?
The size is expected to reach 22.45 million tons in 2027 and 27.78 million tons by 2032, at a 4.35% CAGR over 2027-2032.
What supports growth in acetic acid demand?
Vinyl acetate monomer demand and purified terephthalic acid (PTA) additions support growth. Jiangsu Hailun Petrochemical, a Jiangsu Sanfame Polyester Material subsidiary, put its 3.2-million-metric-ton-per-year PTA technical-upgrade and expansion project into operation in China in August 2025.
Which acetic acid application is the largest?
Adhesives, paints and coatings held 36.76% of global acetic acid volume in 2026. Medical applications are forecast to grow at a 6.3% CAGR over 2027-2032.
Which companies are major acetic acid producers?
Celanese Corporation and INEOS are among the major acetic acid producers.
What is a key cost challenge for acetic acid suppliers?
Methanol price variation can complicate the economics of acid production. Gujarat Narmada Valley Fertilizers & Chemicals Limited showed varying methanol prices in its Indian feedstock-spread series from FY 2021-22 through FY 2025-26.
Which region leads the acetic acid sector?
Asia-Pacific held 69.56% of global acetic acid volume in 2026 and is forecast to grow at a 4.95% CAGR over 2027-2032.