Market Overview
| Study Period | 2021 - 2031 |
|---|---|
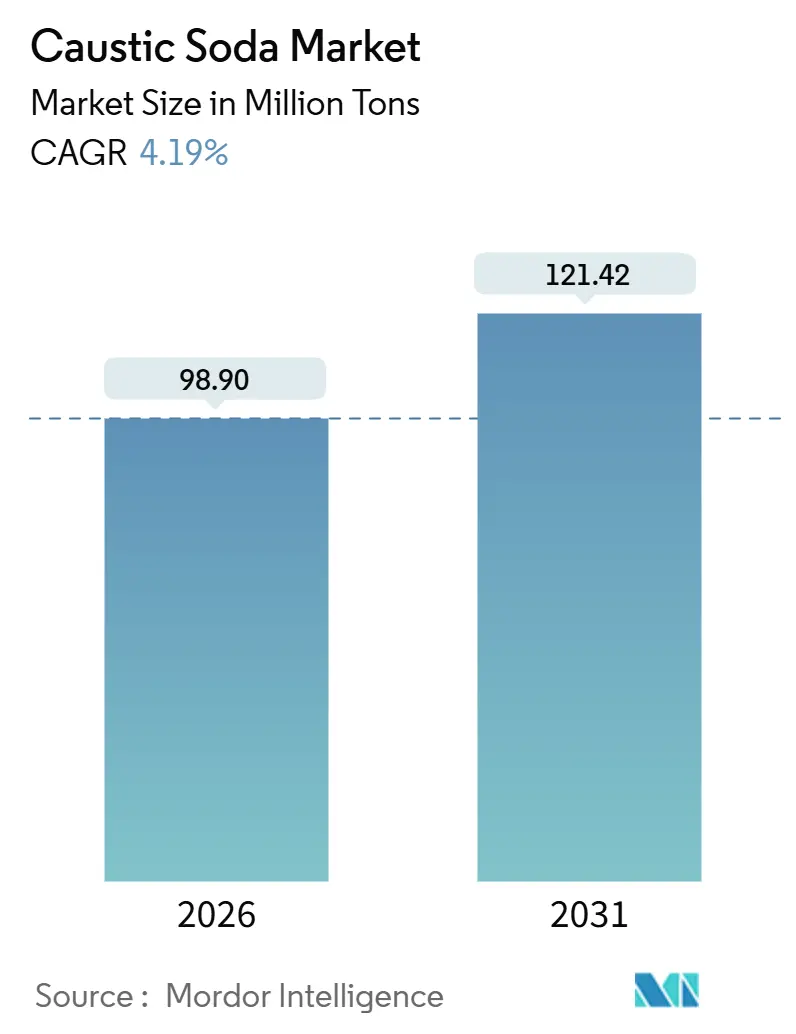
| Market Volume (2026) | 98.90 Million tons |
| Market Volume (2031) | 121.42 Million tons |
| Growth Rate (2026 - 2031) | 4.19% CAGR |
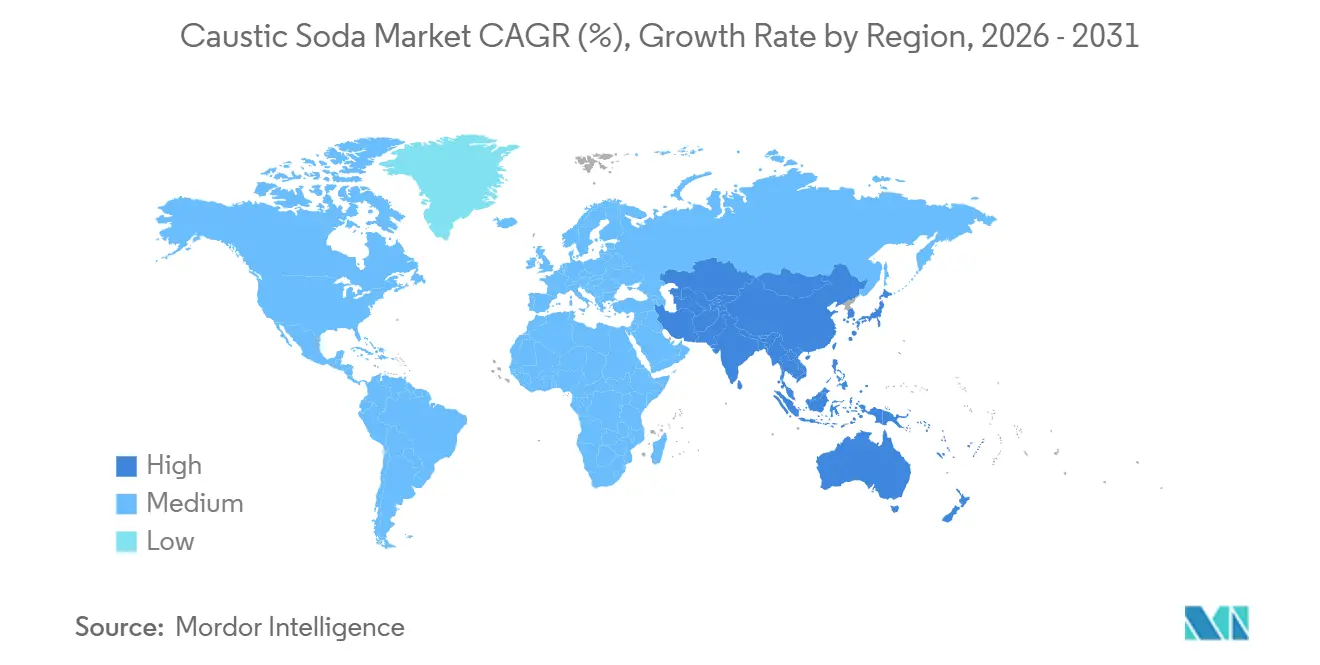
| Fastest Growing Market | Asia Pacific |
| Largest Market | Asia Pacific |
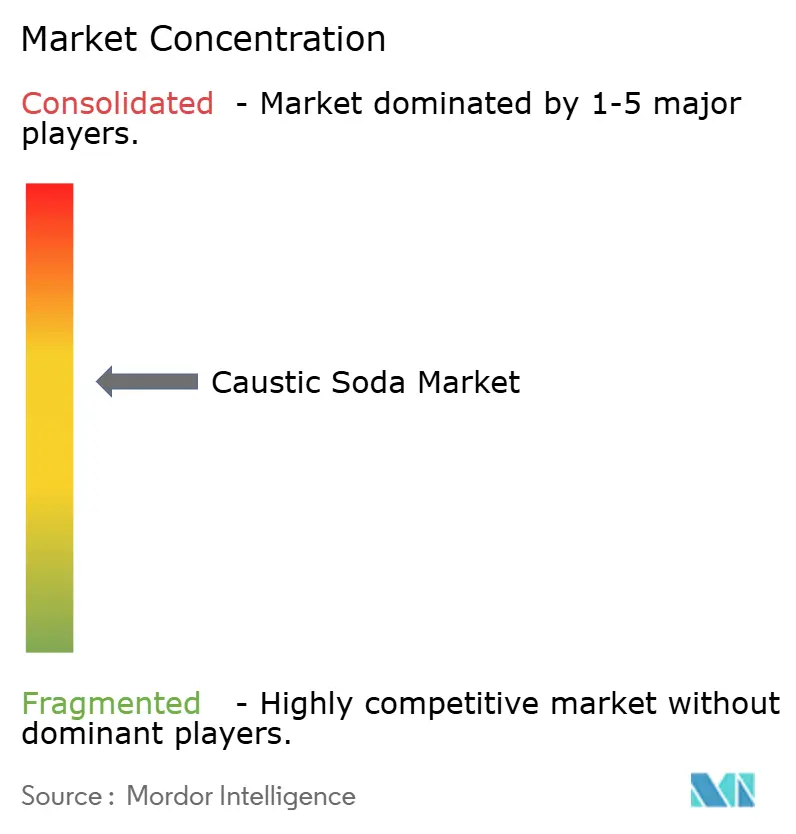
| Market Concentration | Medium |
Major Players *Disclaimer: Major Players sorted in no particular order Image © Mordor Intelligence. Reuse requires attribution under CC BY 4.0. | |
Caustic Soda Market Analysis by Mordor Intelligence
The Caustic Soda Market size is estimated at 98.90 Million tons in 2026, and is expected to reach 121.42 Million tons by 2031, at a CAGR of 4.19% during the forecast period (2026-2031). High-purity grades are increasingly favored for electrochemical energy storage and specialty chemicals, signaling a structural shift in demand rather than a fleeting cyclical rebound. By late 2024, Hanwha Solutions ramped up its chlor-alkali capacity to secure a steady supply for lithium-ion purification and the emerging sodium-ion battery value chain. This move positions energy storage as a direct rival to pulp, chemicals, and alumina in the quest for caustic supply. The Asia-Pacific region is set to grow steadily through 2031. In contrast, European producers grapple with power costs significantly higher than those of North America, leading to accelerated plant closures and a heightened reliance on imports. While membrane cell units dominate the market due to their energy efficiency, diaphragm conversions are driving the legacy route to rapid growth, as companies opt for retrofitting over shutting down. Liquid solutions benefit from cost-effective pipeline and bulk rail logistics. Meanwhile, solid flakes and prills cater to remote mining and water facilities, where freight costs make dilute products less viable.
Key Report Takeaways
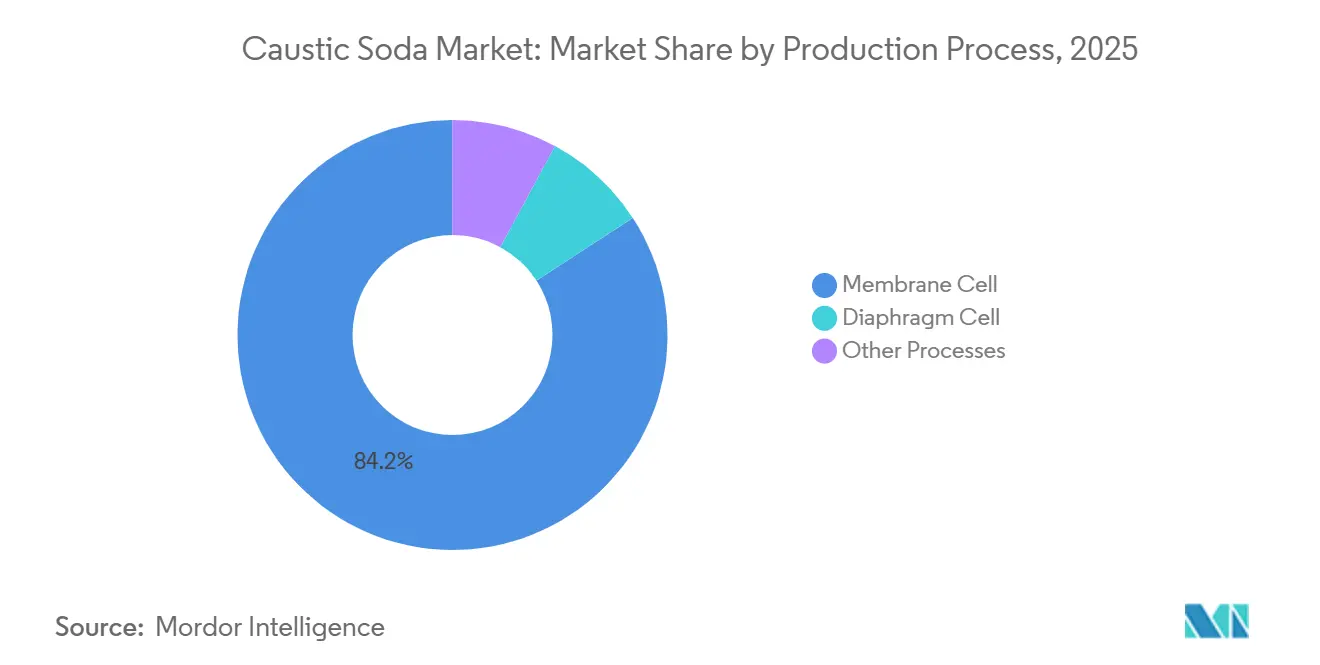
- By production process, membrane cells held 84.17% of the caustic soda market share in 2025, and diaphragm cells are projected to record a 5.67% CAGR through 2031.
- By form, liquid grades captured 65.86% of the caustic soda market share in 2025, while solid grades will expand at a 4.89% CAGR to 2031.
- By concentration grade, 50 wt% solutions accounted for 37.18% of the caustic soda market size in 2025, and 73 wt% or higher strengths are forecast to grow at a 5.51% CAGR.
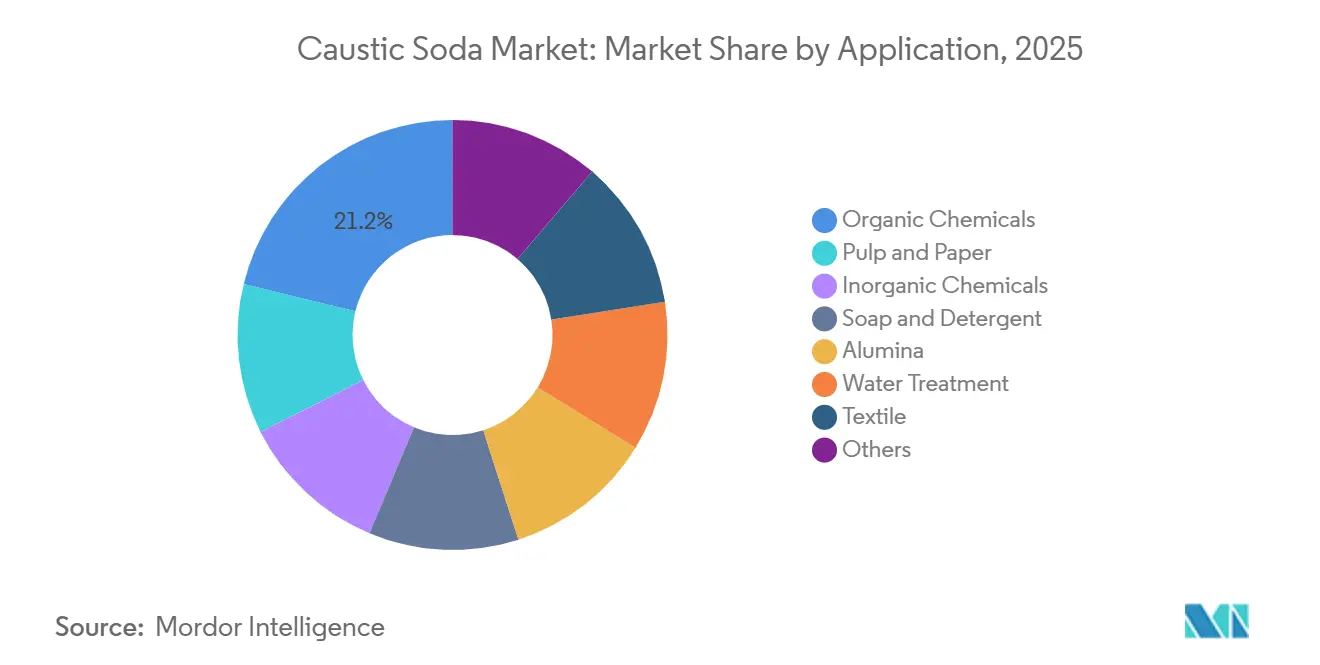
- By application, organic chemicals led with 21.18% of the caustic soda market share in 2025, and pulp and paper is advancing at a 5.19% CAGR through 2031.
- By geography, Asia-Pacific commanded 65.17% of the caustic soda market size in 2025 and is set to grow at a 5.91% CAGR to 2031.
Note: Market size and forecast figures in this report are generated using Mordor Intelligence’s proprietary estimation framework, updated with the latest available data and insights as of January 2026.
Global Caustic Soda Market Trends and Insights
Drivers Impact Analysis*
| Drivers | (~) % Impact on CAGR Forecast | Geographic Relevance | Impact Timeline |
|---|---|---|---|
| Accelerated alumina refinery expansions | +0.8% | Asia-Pacific and Australian bauxite supply chain | Medium term (2-4 years) |
| Surging soap and detergent production | +0.6% | India, Southeast Asia, Sub-Saharan Africa | Long term (≥ 4 years) |
| Expansion of pulp and paper capacity | +0.9% | Southeast Asia, South America, Nordics | Medium term (2-4 years) |
| Increasing demand from water treatment | +0.5% | Middle East desalination, India municipal infrastructure | Long term (≥ 4 years) |
| Scale-up of sodium-ion battery cathodes | +0.4% | China and South Korea, spillover to North America and Europe | Short term (≤ 2 years) |
| Source: Mordor Intelligence | |||
Accelerated Alumina Refinery Expansions
Between 2025 and 2028, China's demand for alumina is set to rise significantly. This surge is largely fueled by smelting expansions in India, Indonesia, and the Gulf, which are channeling bauxite flows towards Asia. Australian trihydrate ore, which requires less NaOH to produce alumina, is increasingly replacing monohydrate deposits with higher consumption. In India, refiners are adopting sophisticated liquor controls, reducing caustic losses. This advancement not only curtails unit consumption but also accommodates an increase in absolute volume. As a result, the close-knit relationship between bauxite procurement and Bayer-process refinement boosts regional output while simultaneously reducing caustic intensity[1]SpringerLink, “Caustic Consumption in Alumina Refining,” link.springer.com.
Surging Soap and Detergent Production
Annual detergent demand in India and Southeast Asia is rising as disposable income rises, but the caustic intensity per finished ton drops because manufacturers substitute synthetic surfactants for traditional soap saponification. Organized players add LABS and alcohol ethoxylate lines that need caustic only for pH control, whereas small African plants still rely on full saponification, preserving higher NaOH loadings. Fast-growing detergent markets see a muted gain in caustic volume, which modestly contributes to the overall CAGR.
Expansion of Pulp and Paper Capacity
By 2028, Indonesia, Vietnam, and Brazil are set to establish significant kraft capacity, driven by mandates for fiber-based packaging and restrictions on single-use plastics. Mills typically use caustic for processes like lignin dissolution and bleaching. While Nordic producers have adopted methods to enhance liquor recovery and produce biofuels from black liquor-reducing their fresh caustic makeup-new mills in Southeast Asia have yet to integrate these practices, resulting in higher intensity. Consequently, pulp and paper emerges as the fastest-growing application at 5.19% CAGR.
Increasing Demand from Water Treatment Industry
By 2028, desalination plants in Saudi Arabia and the UAE are set to boost their collective capacity. This surge will drive up the demand for bulk NaOH, primarily for post-treatment remineralization. In contrast, municipal schemes in India utilize on-site electrochlorination, which simultaneously produces caustic, thereby moderating the incremental tonnage. Furthermore, while industrial sectors, notably electronics and petrochemicals, are ramping up their use of high-purity caustic, the prevalent practice of on-site generation keeps the net CAGR uplift limited.
Restraints Impact Analysis*
| Restraints | (~) % Impact on CAGR Forecast | Geographic Relevance | Impact Timeline |
|---|---|---|---|
| Volatile electricity prices in Europe | -0.7% | European Union, UK, Turkey | Short term (≤ 2 years) |
| Energy-intensive and CO₂-heavy process | -0.5% | Global, strongest where carbon pricing applies | Medium term (2-4 years) |
| Alumina digestion alternatives lowering NaOH | -0.3% | China pilot projects | Long term (≥ 4 years) |
| Source: Mordor Intelligence | |||
Volatile Electricity Prices in Europe
Electricity constitutes a significant portion of the total cost in the chlor-alkali industry. In 2024, industrial rates in Europe placed European producers at a disadvantage compared to their U.S. counterparts. Responding to prolonged margin pressures, INEOS decided to mothball its Tavaux downstream unit in 2025 and subsequently reduced its chlor-alkali output[2]INEOS, “Tavaux Facility Announcement,” ineos.com. This move underscores the industry's struggle with elevated power prices, leading to capacity adjustments and a heightened reliance on imports. The industry anticipates a concentrated negative impact in the short term, coinciding with contract expirations and the retirement of older plants.
Energy-Intensive and CO₂-Heavy Production Process
Membrane cells consume significant energy for each electrochemical unit, resulting in carbon emissions for every kg of NaOH produced, based on standard grid power. In the EU Emissions Trading System (ETS), carbon prices contribute to an added cost for NaOH. Westlake has successfully reduced its CO₂ intensity by implementing efficiency upgrades and entering into renewable purchase agreements. This move allows the company to price its low-carbon caustic products at a premium. Meanwhile, buyers in the home and personal care sectors are now factoring in Scope 3 emissions in their procurement decisions. This shift is hastening the move away from high-emission suppliers and is projected to impact the global CAGR.
*Our forecasts treat driver/restraint impacts as directional, not additive. The impact forecasts reflect baseline growth, mix effects, and variable interactions.
Segment Analysis
By Production Process Membrane Cells Lead
Membrane units delivered 84.17% of the 2025 volume on an energy advantage over diaphragm lines. OxyChem is converting its LaPorte diaphragm plant to capture that saving and comply with asbestos limits. Although membrane dominance holds, diaphragm capacity still grows at a 5.67% CAGR as North American operators upgrade mercury or asbestos assets rather than close them, ensuring chlorine supply for integrated PVC complexes. The caustic soda market size for membrane cell output will therefore move in line with overall growth, while diaphragm gains a modest share from retrofits. Producers that finish conversions also qualify for renewable power agreements and low-carbon product badges that fetch a premium from sustainability-minded customers.


By Form Liquid Products Prevail
Liquid caustic carried 65.86% of 2025 demand, sustained by pipeline grids on the U.S. Gulf Coast and within large petrochemical corridors in China. Olin's network minimizes freight distances, securing the most competitive supply costs. Solid flakes and prills expand at a 4.89% CAGR because remote mines and decentralized water plants choose higher density and spill-free handling, especially in Australia’s metals sector and African municipal projects. The caustic soda market share of solid grades, therefore, widens despite their higher production cost, indicating that logistics dictates form differentiation more than conversion expense.
By Concentration Grade High Strength Solutions Gain
Standard 50 wt% liquids own 37.18% of 2025 volume, yet 73 wt% and stronger solutions will outpace at 5.51% CAGR as alumina operations are targeting a liquor concentration to reduce steam consumption. Multi-effect and mechanical vapor recompression evaporators at Grasim facilities trim concentration energy, letting high-strength grades compete on delivered cost. Viscose fiber producers also adopt higher feeds for tighter process control, ensuring that premium grades grow faster than overall demand in the caustic soda market.
By Application Organic Chemicals Hold the Lead
Organic intermediates such as epoxies and propylene oxide absorbed 21.18% of 2025 tonnage, thanks to steady demand from coatings and plastics. Pulp and paper rise fastest at 5.19% CAGR on Southeast Asian mill construction that consumes high quantities of NaOH per ton of pulp. Alumina refineries remain the second-largest user, but trend toward lower unit consumption as trihydrate bauxite displaces monohydrate ore and advanced controls tighten liquor circuits. Water treatment, soaps, and textiles each have a small share, with growth moderated by intensity reduction from on-site generation and formulation changes.
Geography Analysis
Asia-Pacific held 65.17% of the 2025 volume and is set to climb at a 5.91% CAGR through 2031, driven by China's chemical integration, India's burgeoning alumina and textile sectors, and pulp investments sprouting in Indonesia and Vietnam. China's Five-Year Plan mandates energy caps, pushing upgrades to membrane technology. This move not only consolidates marginal players but also enhances overall efficiency. In 2024, India ramped up its caustic capacity and rolled out new evaporation systems. These systems are designed for high-concentration outputs, catering to both alumina refiners and viscose production lines.
North America, buoyed by competitively priced shale gas electricity, commands a significant share of the global volume. In a strategic shift, operators are phasing out high-cost diaphragm lines, redirecting production to state-of-the-art membrane sites. This transition bolsters North America's stature as a premier low-carbon supply hub. Europe, while holding a notable volume share, is witnessing a contraction. Escalating power costs are prompting a rationalization, with imports now constituting a growing portion of consumption. Producers in the Middle East leverage subsidized electricity, catering to local petrochemical and water projects. They also export their surplus to Europe and Africa, where a freight cost advantage supports their competitiveness. In South America, demand is on the rise, spurred by Brazil's pulp expansion. However, local chlor-alkali producers face mounting pressures. As they phase out asbestos diaphragms, capital constraints tighten, heightening the chances of renewed imports.

Competitive Landscape
The caustic soda market is moderately consolidated. Dow offers reduced-carbon membrane-grade product from renewable-powered Stade and Schkopau plants certified under ISCC PLUS, meeting European disclosure rules. Olin focuses on electrochemical unit margin optimization, letting chlorine and caustic pricing balance across its network. INEOS Inovyn takes the opposite tack, mothballing power-intensive assets and importing caustic as needed. Membrane retrofits and renewable power contracts are the core strategic levers across the peer set, while Chinese and Indian entrants pursue high-purity and high-strength niches.
Caustic Soda Industry Leaders
Olin Corporation
Westlake Corporation
INEOS
Occidental Petroleum Corporation
Tosoh Corporation
- *Disclaimer: Major Players sorted in no particular order

Recent Industry Developments
- January 2024: Atul Ltd commissioned a caustic-chlorine plant in Valsad, India, with a production capacity of 300 TPD, backed by an investment of INR 1,035 crore (USD 124 million). This initiative is anticipated to positively impact the caustic soda market by boosting domestic production and addressing the increasing demand efficiently.
- May 2024: Hanwha Solutions Corp. aims to expand its facilities to reach an annual production capacity of 1.11 million tons by the end of 2024. However, the company has not provided any further updates. This expansion is expected to strengthen the company's position in the caustic soda market, potentially influencing supply dynamics and market competition.


Research Methodology Framework and Report Scope
Market Definitions and Key Coverage
Our study treats the caustic soda market as all merchant-traded sodium hydroxide, liquid or solid, across membrane, diaphragm, and other chlor-alkali routes, sold for industrial use. Volumes handled within captive chlorine integration chains are counted only when surplus is shipped to third-party users.
Scope exclusion: chlorine derivatives, soda ash, and downstream sodium compounds are outside this baseline.
Segmentation Overview
- By Production Process
- Membrane Cell
- Diaphragm Cell
- Other Processes
- By Form
- Liquid
- Solid
- By Concentration Grade
- 32 wt %
- 50 wt %
- 73 wt % and Higher
- By Application
- Pulp and Paper
- Organic Chemicals
- Inorganic Chemicals
- Soap and Detergent
- Alumina
- Water Treatment
- Textile (Viscose Fibre, Dyeing)
- Others (Food and Pharmaceutical Processing, Mining and metallurgy)
- By Geography
- Asia-Pacific
- China
- India
- Japan
- South Korea
- ASEAN
- Rest of Asia-Pacific
- North America
- United States
- Canada
- Mexico
- Europe
- Germany
- United Kingdom
- Italy
- France
- Nordics
- Rest of Europe
- South America
- Brazil
- Argentina
- Rest of South America
- Middle-East and Africa
- Saudi Arabia
- United Arab Emirates
- Turkey
- South Africa
- Egypt
- Rest of Middle-East and Africa
- Asia-Pacific
Detailed Research Methodology and Data Validation
Primary Research
To plug gaps, we interview chlor-alkali plant managers, bulk-chemical distributors, and procurement heads at pulp, alumina, and detergent manufacturers across Asia-Pacific, Europe, and the Americas. Their insights validate utilization rates, typical contract prices, and regional demand pulses, letting us fine-tune assumptions surfaced in secondary work.
Desk Research
Mordor analysts first map supply using open statistics from bodies such as the United States Geological Survey, Eurochlor, India's CMIE trade tables, and UN Comtrade shipment data, complemented by process-specific energy benchmarks released by the International Energy Agency. Trade associations, for example, the American Forest & Paper Association for pulp demand, and listed-company filings furnish end-use growth clues, while price series are traced through customs databases and Dow Jones Factiva news feeds. D&B Hoovers gives us producer-level financials that anchor plant capacities. These sources illustrate, not exhaust, the full set we consult.
Market-Sizing & Forecasting
We start with a top-down reconstruction. Global chlorine output is paired with the co-production ratio for NaOH, then adjusted for captive consumption and trade flows visible in export-import ledgers. Results are cross-checked through selective bottom-up roll-ups of nameplate capacity multiplied by average operating rate gathered during interviews. Key drivers, alumina production tonnage, world paper and board output, ethylene oxide capacity additions, electricity price indices, and membrane-cell penetration feed a multivariate regression that projects demand to 2030. Exponential smoothing overlays handle short-term price swings; where bottom-up gaps persist, we interpolate using three-year moving averages of regional consumption intensity.
Data Validation & Update Cycle
Outputs face a two-tier review. Analysts run variance checks against historical trade balances and independent price benchmarks, after which a senior reviewer signs off. Reports refresh annually, with interim revisions triggered by capacity closures, energy-price shocks, or regulatory bans. Before release, we rerun the full model so clients receive the latest view.
Why Our Caustic Soda Baseline Stands Up to Scrutiny
Published estimates differ; they often rely on single-region samples, static average selling prices, or exclude captive back-integration.
Benchmark comparison
| Market Size | Anonymized source | Primary gap driver |
|---|---|---|
| 94.95 million tons (2025) | Mordor Intelligence | - |
| USD 47.4 billion (2024) | Global Consultancy A | Converts at spot Asian prices only; omits diaphragm-cell output in Europe |
| USD 44.9 billion (2024) | Trade Journal B | Counts 50% aqueous solution sales but skips solid flakes and pearls |
| USD 55.6 billion (2027) | Industry Association C | Applies 2019 price deck forward with no energy-cost adjustment |
Taken together, the table shows that scope choices, unit conversions, and refresh cadence drive wide gaps. By modeling from production chemistry up, validating with live plant data, and updating every year, Mordor Intelligence offers decision-makers a balanced, transparent baseline they can reliably track against their own procurement or investment metrics.


Key Questions Answered in the Report
What is the projected volume of the caustic soda market in 2031?
The market is forecast to reach 121.42 million tons by 2031, reflecting a 4.19% CAGR from 98.90 million tons in 2026.
Which region contributes the most to global caustic soda demand?
Asia-Pacific accounts for 65.17% of the 2025 volume and is the fastest-growing region at a 5.91% CAGR through 2031.
Why are membrane cell plants preferred over diaphragm units?
Membrane technology consumes less electricity, eliminates asbestos handling, and supports low-carbon product certification, leading to an 84.17% share in 2025.
Which application segment is expanding fastest?
Pulp and paper demand grows at a 5.19% CAGR due to new kraft mills in Southeast Asia and South America, outpacing other end-uses.
What is driving interest in high-purity caustic grades?
Sodium-ion battery cathode manufacturing and advanced semiconductor processes require caustic above 99.5% purity, creating a premium niche market.
Page last updated on:


