Smart Workplace Market Size and Share
Market Overview
| Study Period | 2019 - 2030 |
|---|---|
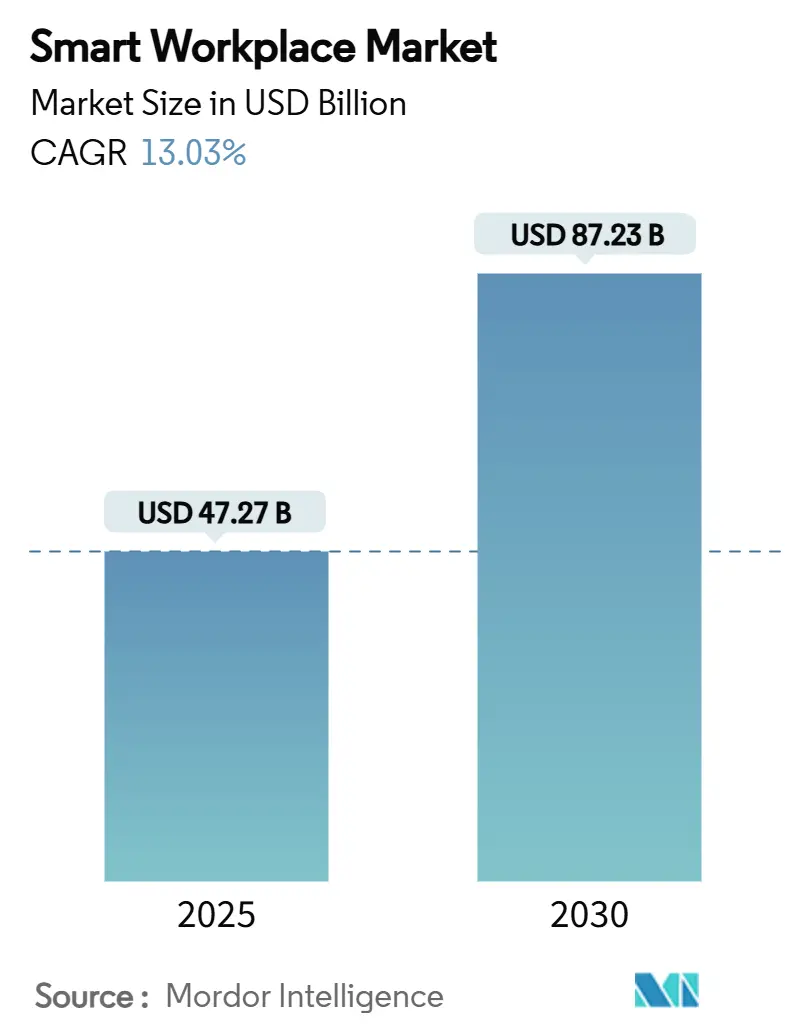
| Market Size (2025) | USD 47.27 Billion |
| Market Size (2030) | USD 87.23 Billion |
| Growth Rate (2025 - 2030) | 13.03% CAGR |
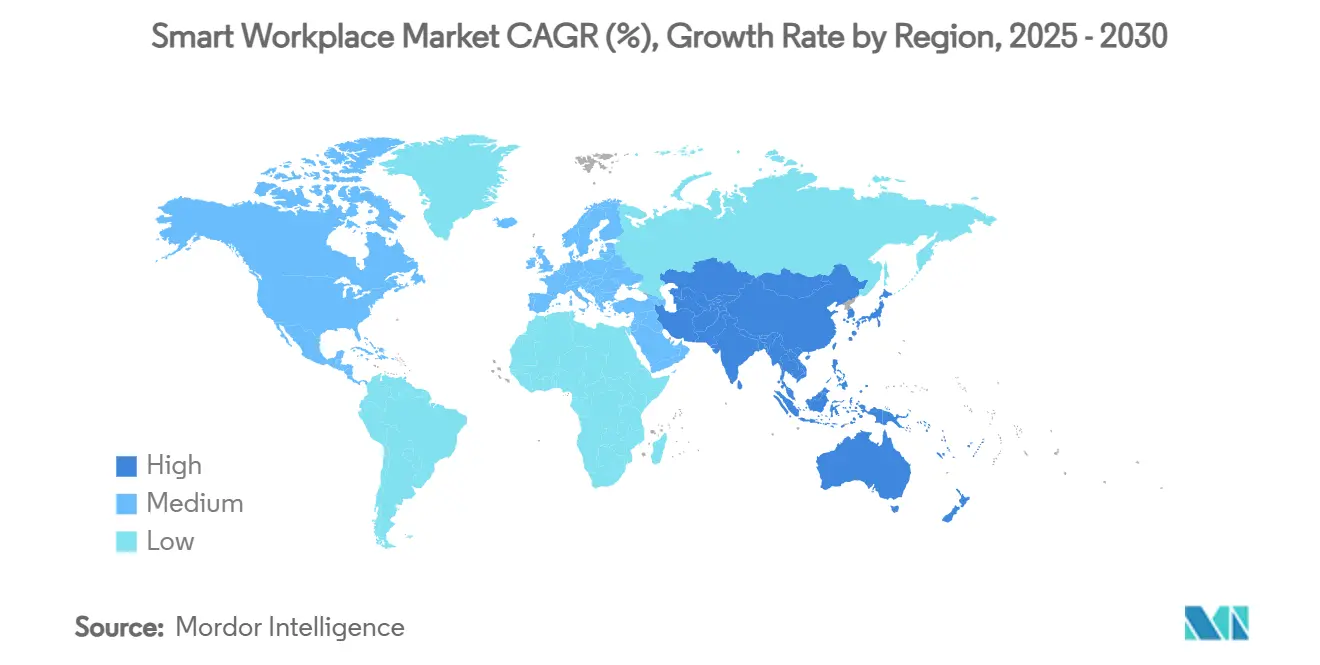
| Fastest Growing Market | Asia Pacific |
| Largest Market | North America |
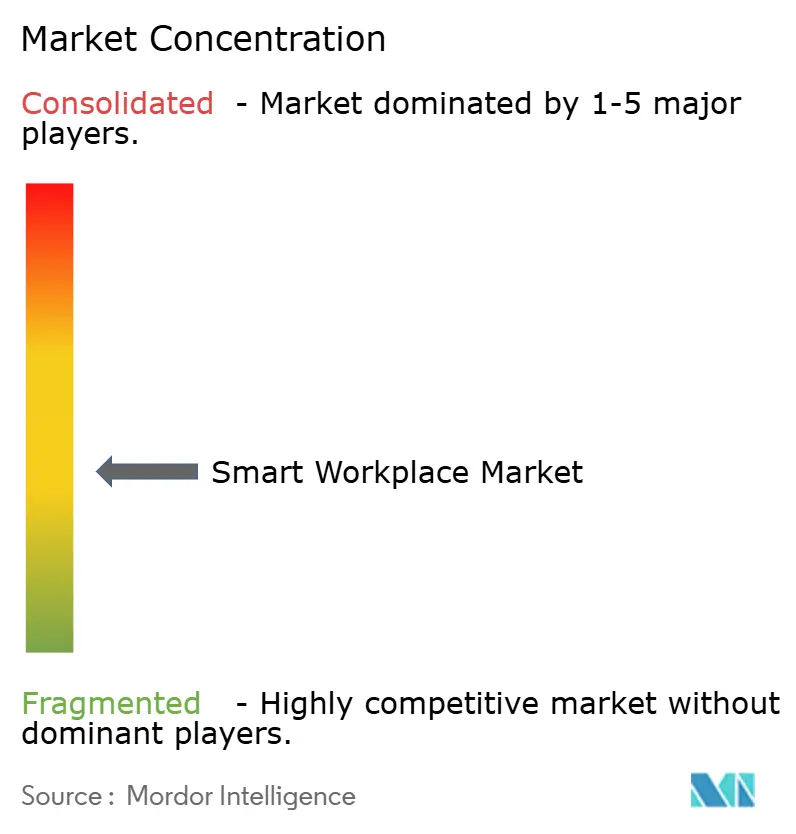
| Market Concentration | Medium |
Major Players *Disclaimer: Major Players sorted in no particular order Image © Mordor Intelligence. Reuse requires attribution under CC BY 4.0. | |
Smart Workplace Market Analysis by Mordor Intelligence
The smart workplace market size reached USD 47.27 billion in 2025 and is forecast to touch USD 87.23 billion by 2030 at a 13.03% CAGR. Strong momentum in the smart workplace market stems from rising hybrid-work adoption, energy-efficiency mandates, and lower IoT hardware costs. Firms report energy savings of up to 30% and productivity gains surpassing 50% when intelligent building platforms orchestrate lighting, HVAC, and space utilization.[1]ABB, “Smart Energy Management,” ABB.com Regulatory updates such as ASHRAE 90.1-2022 and city-level building-performance standards add compliance urgency that keeps the smart workplace market on a double-digit growth path. IoT sensor prices have fallen by nearly 35% since 2020 and cloud AI analytics have become turnkey, opening the smart workplace market to small and medium offices that once lacked the budget for building intelligence. Competitive strategies now emphasize open ecosystems that reduce vendor lock-in and incorporate security-first design to answer cyber-insurer requirements.
Key Report Takeaways
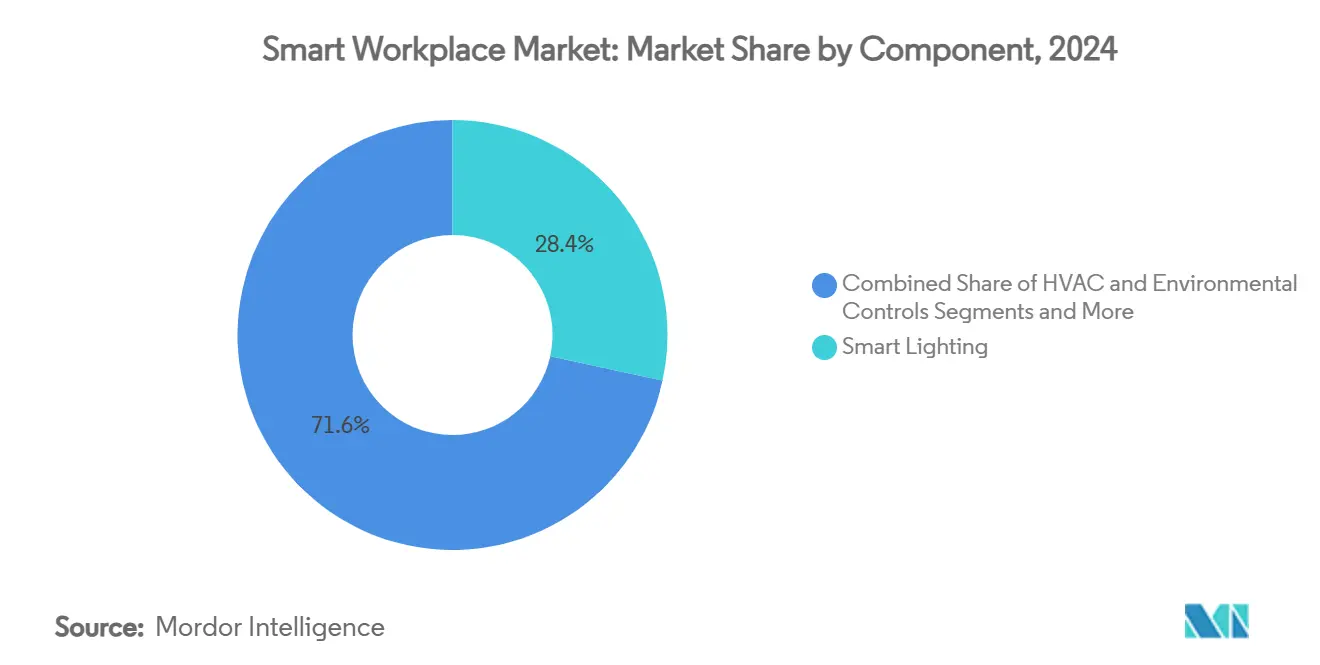
- By component, smart lighting systems captured 28.4% of smart workplace market share in 2024, while sensors and edge devices are advancing at a 13.6% CAGR through 2030.
- By solution type, hardware accounted for 46.1% of the smart workplace market size in 2024 and cloud / SaaS solutions are projected to grow at a 13.8% CAGR to 2030.
- By building size, large enterprises held 63.0% share of the smart workplace market size in 2024, whereas small and medium offices will expand at a 13.9% CAGR over the same horizon.
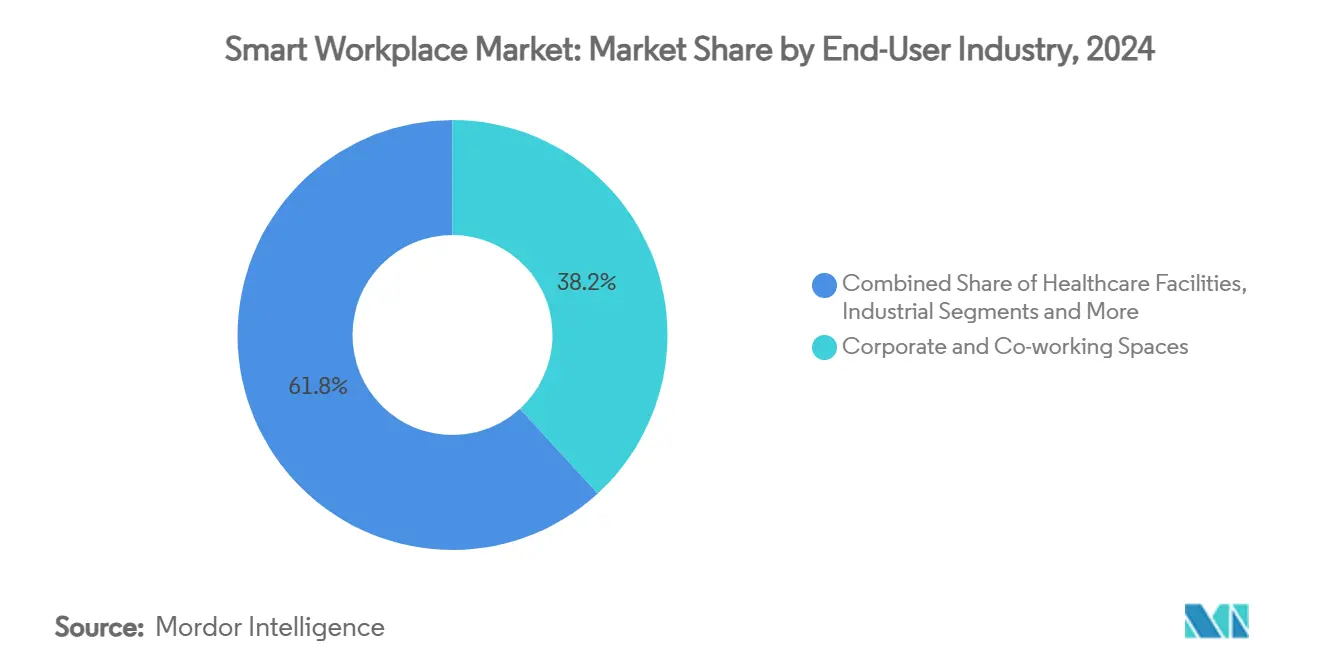
- By end-user industry, corporate and co-working spaces led with 38.2% revenue share in 2024; co-working spaces alone are forecast to post a 13.5% CAGR until 2030.
- By deployment model, on-premises setups accounted for 58.7% of the smart workplace market size in 2024, while cloud and SaaS deployments are projected to grow at a 13.8% CAGR through 2030.
- By geography, North America commanded 34.5% smart workplace market share in 2024 and Asia-Pacific is projected to register the fastest 13.4% CAGR to 2030.
Global Smart Workplace Market Trends and Insights
Drivers Impact Analysis*
| Driver | (~) % Impact on CAGR Forecast | Geographic Relevance | Impact Timeline |
|---|---|---|---|
| Rise of hybrid-work policies | +2.1% | Global with early gains in North America and EU | Medium term (2-4 years) |
| Energy-efficiency regulations for real estate | +1.8% | North America and EU core, expanding to APAC | Long term (≥ 4 years) |
| Declining IoT sensor and gateway costs | +1.5% | Global with accelerated adoption in APAC | Short term (≤ 2 years) |
| Integration of cloud AI and analytics | +2.3% | Global led by North America and APAC | Medium term (2-4 years) |
| Insurance-premium discounts for smart offices | +0.9% | North America and EU | Long term (≥ 4 years) |
| Occupancy-based lease-pricing models | +1.2% | Global with early use in tier-one metros | Medium term (2-4 years) |
| Source: Mordor Intelligence | |||
Rise of Hybrid-Work Policies
Hybrid work now shapes office design worldwide. CBRE found that 92% of organizations embed hybrid programs in workplace policies, up from 71% in 2022.[2]CBRE, “Effective Hybrid Programs,” CBRE.comEnterprises allocate larger budgets to workspace-management software and install dense networks of occupancy sensors to track seat usage in real time. Meeting-space share is projected to rise from 30.2% to 33.5% by 2025, fueling adoption of smart conference-room booking and environmental controls that automatically tune lighting and ventilation. Activity-based layouts depend on granular environmental data that AI platforms analyze to surface predictive insights on foot traffic and comfort. Although hot-desking shows mixed productivity, AI-enabled space optimization models are mitigating friction by aligning desk assignment with historical usage patterns.
Energy-Efficiency Regulations for Commercial Real Estate
Thirteen US jurisdictions introduced building-performance standards that enforce energy benchmarks and penalties for noncompliance. NYC Local Law 88 obliges buildings over 50,000 ft² to upgrade lighting and install sub-metering by January 2025, positioning smart lighting systems as compliance essentials. ASHRAE 90.1-2022 adds over 80 revisions, including on-site renewables and stricter thermal-bridge mitigation. Owners risk insurance surcharges and asset devaluation when ignoring these mandates, so demand escalates for continuous energy-monitoring platforms that validate savings in real time. Utilities and insurers further sweeten adoption with rebates and premium discounts for verified smart workplaces.
Declining IoT Sensor and Gateway Costs
Wider silicon availability and mass-production efficiencies have cut typical multi-sensor node prices by one-third since 2020. Consequently, 72% of enterprises now operate IoT devices in workplace environments. Affordable sensors let small offices monitor occupancy, air quality, and energy simultaneously, generating datasets once exclusive to high-budget campuses. Edge processors embedded in sensors run lightweight ML models that deliver millisecond decisions on lighting dimming or HVAC modulation even if cloud links fail. Surveyed firms reported 75% profitability gains linked to IoT deployments, yet lower-cost devices sometimes ship with weak encryption, expanding the market for secure device-management software.
Integration of Cloud AI and Analytics Platforms
Cloud AI platforms shift smart workplaces from reactive control to predictive optimization. Deloitte found that 62% of employees in Asia-Pacific use generative AI for work tasks, illustrating regional readiness for advanced analytics. Microsoft harvested USD 500 million in internal productivity savings through AI while reducing headcount, suggesting high ROI when AI orchestrates workflows. Smart Building as a Service models package algorithms, data lakes, and cybersecurity into subscription offerings that remove capital barriers. Still, decision-makers balance cloud benefits against privacy rules and latency-sensitive safety systems, prompting hybrid architectures that keep critical controls on premises while pushing analytics to the cloud.
Restraints Impact Analysis*
| Restraint | (~) % Impact on CAGR Forecast | Geographic Relevance | Impact Timeline |
|---|---|---|---|
| High upfront retrofitting costs | -1.7% | Global, stronger effect on SMEs | Short term (≤ 2 years) |
| Interoperability and vendor-lock-in issues | -1.3% | Global, acute in fragmented markets | Medium term (2-4 years) |
| Cyber-insurer exclusions for unmanaged IoT | -0.8% | North America and EU | Long term (≥ 4 years) |
| Employee data-privacy activism | -0.6% | EU core, expanding to other regions | Medium term (2-4 years) |
| Source: Mordor Intelligence | |||
High Upfront Retrofitting Costs
Smart workplace retrofits often require rewiring, PoE upgrades, and network-wide cybersecurity hardening. Capital outlays deter SMEs even when lifecycle savings look attractive. Performance-based ESCO contracts and virtual power plant financing are stepping in; Logical Buildings launched a USD 110 million facility that removes initial capital hurdles for multifamily properties. Lease-structure innovation addresses split-incentive pain points by sharing savings among owners and tenants. Over time, wider availability of plug-and-play wireless sensors and modular controllers is expected to reduce installation cost curves.
Interoperability and Vendor-Lock-In Concerns
Building owners fear becoming captive to closed ecosystems. Diverse protocols—BACnet, KNX, Modbus, MQTT—must interoperate seamlessly to avoid stranded assets. City pilots in Nantes, Hamburg, and Helsinki verified that open-specification frameworks can harmonize data across lighting, HVAC, and security layers. Assessment models now grade BMS openness across acquisition, integration, and orchestration layers, guiding procurement. Ecosystem partnerships like ABB-Zumtobel and Siemens Building X with AWS aim to reassure buyers by offering API-rich platforms.
*Our forecasts treat driver/restraint impacts as directional, not additive. The impact forecasts reflect baseline growth, mix effects, and variable interactions.
Segment Analysis
By Component: Sensors Drive Intelligence Revolution
Smart lighting systems delivered 28.4% smart workplace market share in 2024 thanks to regulatory lighting mandates and rapid LED retrofits. The segment remains foundational because lighting circuits supply reliable power and network pathways for additional devices.[3]Sanalife, “NYC Local Law 88 Guide,” SanalifeEnergy.com Sensors and edge devices are expanding at a 13.6% CAGR, reflecting demand for granular environmental data that fuels predictive analytics. HVAC and environmental controls post steady gains as AI algorithms optimize air-side economizers and thermal zones.
Security and access controls now integrate video analytics to maintain hybrid-workplace safety. Energy-management platforms link these subsystems to quantify savings, earning utility incentives and carbon-credit revenues. The smart workplace industry increasingly views sensors as the nervous system that unlocks value across every infrastructure layer. Vendors ship multi-function sensors that monitor temperature, CO₂, occupancy, and vibration within a single enclosure, simplifying installation. As the component mix evolves, the smart workplace market benefits from open sensor buses that reduce vendor-lock risk and enable pay-as-you-go upgrades.


By Solution Type: Cloud Transformation Accelerates
Hardware captured 46.1% of smart workplace market size in 2024 because each deployment still requires gateways, switches, and field devices. Yet cloud / SaaS platforms are growing 13.8% annually as firms transition from CapEx purchases to subscription models. Software suites consolidate data from lighting, HVAC, and security, presenting unified dashboards that facility teams access through mobile apps. Managed-service providers bundle analytics, cybersecurity, and continuous commissioning to help resource-constrained owners.
The smart workplace industry sees strong interest in AI-as-a-service that feeds data-driven insights without requiring on-premise GPUs. Open-API ecosystems foster hundreds of micro-services that tackle niche functions such as elevator flow balancing or predictive cleaning. Over the forecast window, hardware revenue will tilt toward edge-AI-capable devices that execute ML inference locally, thereby complementing expanding cloud workloads.
By Building Size: SME Adoption Surges
Large enterprises held 63.0% of the smart workplace market size in 2024 owing to multi-site portfolios that justify integrated platforms. They deploy digital twins to simulate building retrofits and leverage enterprise-resource-planning links for automated maintenance workflows. However, small and medium offices are projected to record the highest 13.9% CAGR as cloud onboarding and falling sensor prices reduce barriers.
Flexible workspace providers demonstrate return on investment by showcasing how intelligent systems boost desk utilization and tenant comfort. Financing innovation, including energy-performance contracts and SBaaS bundles, aligns payment schedules with realized savings, making adoption cash-flow positive for SMEs. The smart workplace market responds with starter kits that ship pre-configured sensors, edge gateways, and cloud dashboards that activate in hours rather than weeks.
By End-User Industry: Co-Working Spaces Lead Innovation
Corporate and co-working spaces together delivered 38.2% revenue in 2024, with co-working subspaces projected to expand at a 13.5% CAGR as operators seek real-time visibility into foot traffic and amenity usage. Smart workplace market share in retail and hospitality rises as hotels integrate occupancy sensors to adjust room conditioning between stays.
Healthcare facilities adopt smart air-quality controls to limit infection transmission, while industrial sites deploy location analytics to enhance worker safety around autonomous equipment. Education and government campuses use energy dashboards to meet sustainability commitments and public disclosure rules. Co-working chains act as living laboratories where pilot technologies mature into enterprise-grade solutions, accelerating diffusion across the wider smart workplace market.
By Deployment Model: Cloud Migration Intensifies
On-premises systems retained 58.7% share in 2024 because mission-critical safety and access controls demand sub-second response and isolated fail-safe operation. Nevertheless, cloud deployments will rise at 13.8% CAGR as cyber-security frameworks and edge-to-cloud encryption satisfy data-sovereignty requirements.
Hybrid architectures prevail: local controllers maintain deterministic control loops while mirrored data streams feed cloud AI engines that optimize energy and predictive maintenance. The smart workplace market rewards vendors that supply reference architectures validated by cloud hyperscalers. Integration templates accelerate time-to-value and reassure IT leaders that data segregation and identity management meet corporate standards.
Geography Analysis
North America anchored 34.5% smart workplace market share in 2024 on the strength of stringent energy codes and rapid hybrid-work policy uptake. Building-performance standards across 13 jurisdictions create a transparent compliance landscape that channels investment toward lighting upgrades, sub-metering, and AI-driven optimization. Federal tax incentives for renewable integration further enhance ROI for smart energy management projects. Technology ecosystems in Silicon Valley, Austin, and Toronto facilitate partnerships between device manufacturers and AI software firms, accelerating product commercialization.
Europe follows closely, driven by net-zero carbon commitments and data-privacy regulations that influence system architecture. Cities such as Amsterdam and Berlin mandate environmental reporting, motivating adoption of sensors that quantify carbon intensity at zone level. Vendors must embed privacy-by-design features to comply with GDPR, often using on-edge anonymization and role-based access controls. Utility feed-in tariffs for demand response incentivize integration with national grids, positioning smart workplaces to act as distributed energy resources.
Asia-Pacific is the fastest rising region with a 13.4% CAGR through 2030 as governments prioritize AI and smart-city agendas. South Korea’s planned 3-gigawatt AI-data center underscores national ambition to lead in computational infrastructure. China’s tier-one cities retrofit aging stock to hit aggressive energy-intensity targets, while India’s tech hubs roll out SBaaS for new Class-A offices. Generational workforce demographics reveal 81% of university students using AI tools, amplifying expectations for intelligent workplaces. The region’s annual office-space demand of 75 million ft² through 2027 magnifies the addressable base for smart workplace offerings

Competitive Landscape
The smart workplace market is moderately fragmented, with top-tier multinationals and agile specialists vying for share. Siemens, Cisco, Honeywell, ABB, and Johnson Controls integrate hardware, cloud platforms, and services to present end-to-end ecosystems. ABB bolstered its Asian footprint by acquiring Siemens' wiring-accessories business for more than USD 150 million, strengthening channel reach in 230 Chinese cities. Johnson Controls divested its HVAC unit to Bosch for USD 8 billion, signaling a reshuffle that concentrates resources on digital-first solutions.
Strategic partnerships highlight AI centrality. Siemens collaborates with Microsoft on industrial foundation models, and its Building X suite integrates with AWS for scalable analytics. Honeywell and Cisco co-develop AI energy-optimization algorithms that tie HVAC and network-usage data into a single decision loop. IBM pushes agentic AI orchestration through its watsonx platform, offering governance toolkits that meet corporate AI-ethics standards.
Emerging players focus on niche pain points like cyber-physical security or open-standard middleware. Edgecom, backed by ABB, applies generative AI to industrial energy management and peak-demand shaving. Logical Buildings scales behind-the-meter virtual power plants financed through shared-savings contracts. With insurers tightening underwriting, startups offering IoT device-risk scoring gain traction.
Smart Workplace Industry Leaders
Siemens AG
Cisco Systems Inc.
Honeywell International Inc.
ABB Ltd.
Schneider Electric SE
- *Disclaimer: Major Players sorted in no particular order

Recent Industry Developments
- July 2025: IBM opened its Agentic AI Innovation Center in Bengaluru to co-create autonomous AI agents for workplace optimization.
- July 2025: Microsoft reported USD 500 million in AI-driven productivity savings alongside workforce reductions.
- June 2025: IBM launched a governance and security suite for agentic AI combining watsonx.governance and Guardium AI Security.
- May 2025: Siemens introduced industrial AI agents within its Industrial Copilot ecosystem, citing 50% productivity gain.


Global Smart Workplace Market Report Scope
| Smart Lighting Systems |
| HVAC and Environmental Controls |
| Security and Access Controls |
| Energy‐Management Systems |
| Sensors and Edge Devices |
| Hardware |
| Software Platforms |
| Managed and Professional Services |
| Large Enterprises (≥1,000 seats) |
| Small and Medium Offices (<1,000 seats) |
| Corporate and Co-working Spaces |
| Healthcare Facilities |
| Industrial and Logistics |
| Retail and Hospitality |
| Education and Government |
| On-premises |
| Cloud / SaaS |
| North America | United States | |
| Canada | ||
| Mexico | ||
| South America | Brazil | |
| Argentina | ||
| Rest of South America | ||
| Europe | Germany | |
| United Kingdom | ||
| France | ||
| Italy | ||
| Russia | ||
| Rest of Europe | ||
| Asia-Pacific | China | |
| Japan | ||
| India | ||
| South Korea | ||
| Rest of Asia-Pacific | ||
| Middle East and Africa | Middle East | Saudi Arabia |
| United Arab Emirates | ||
| Turkey | ||
| Rest of Middle East | ||
| Africa | South Africa | |
| Nigeria | ||
| Rest of Africa | ||
| By Component | Smart Lighting Systems | ||
| HVAC and Environmental Controls | |||
| Security and Access Controls | |||
| Energy‐Management Systems | |||
| Sensors and Edge Devices | |||
| By Solution Type | Hardware | ||
| Software Platforms | |||
| Managed and Professional Services | |||
| By Building Size | Large Enterprises (≥1,000 seats) | ||
| Small and Medium Offices (<1,000 seats) | |||
| By End-user Industry | Corporate and Co-working Spaces | ||
| Healthcare Facilities | |||
| Industrial and Logistics | |||
| Retail and Hospitality | |||
| Education and Government | |||
| By Deployment Model | On-premises | ||
| Cloud / SaaS | |||
| By Geography | North America | United States | |
| Canada | |||
| Mexico | |||
| South America | Brazil | ||
| Argentina | |||
| Rest of South America | |||
| Europe | Germany | ||
| United Kingdom | |||
| France | |||
| Italy | |||
| Russia | |||
| Rest of Europe | |||
| Asia-Pacific | China | ||
| Japan | |||
| India | |||
| South Korea | |||
| Rest of Asia-Pacific | |||
| Middle East and Africa | Middle East | Saudi Arabia | |
| United Arab Emirates | |||
| Turkey | |||
| Rest of Middle East | |||
| Africa | South Africa | ||
| Nigeria | |||
| Rest of Africa | |||


Key Questions Answered in the Report
What is the current global smart workplace market size and forecast growth rate?
Spending reached USD 47.27 billion in 2025 and is forecast to rise to USD 87.23 billion by 2030 at a 13.03% CAGR.
Which technology component is expanding the fastest inside smart workplaces?
Sensors and edge devices are advancing at a 13.6% CAGR through 2030 as companies seek granular data for AI-driven optimization.
How do hybrid-work policies influence investment decisions?
With 92% of organizations now supporting hybrid arrangements, firms prioritize occupancy analytics and flexible space-management platforms to improve utilization and cut energy waste.
What typical return on investment can executives expect from intelligent building upgrades?
Deployments commonly deliver energy savings up to 30% and productivity gains above 50% when lighting, HVAC, and space-booking systems are orchestrated by AI.
Which geographic region offers the strongest near-term growth opportunity?
Asia-Pacific leads with a projected 13.4% CAGR to 2030, supported by rapid AI adoption, urbanization, and sizable new office demand.
How are rising cybersecurity requirements shaping purchasing criteria?
Insurers increasingly exclude losses tied to unmanaged IoT devices, so buyers favor platforms with zero-trust segmentation, continuous monitoring, and open APIs to avoid lock-in while meeting coverage needs.
Page last updated on:


