Smart Connected Assets And Operations Market Size and Share
Market Overview
| Study Period | 2020 - 2031 |
|---|---|
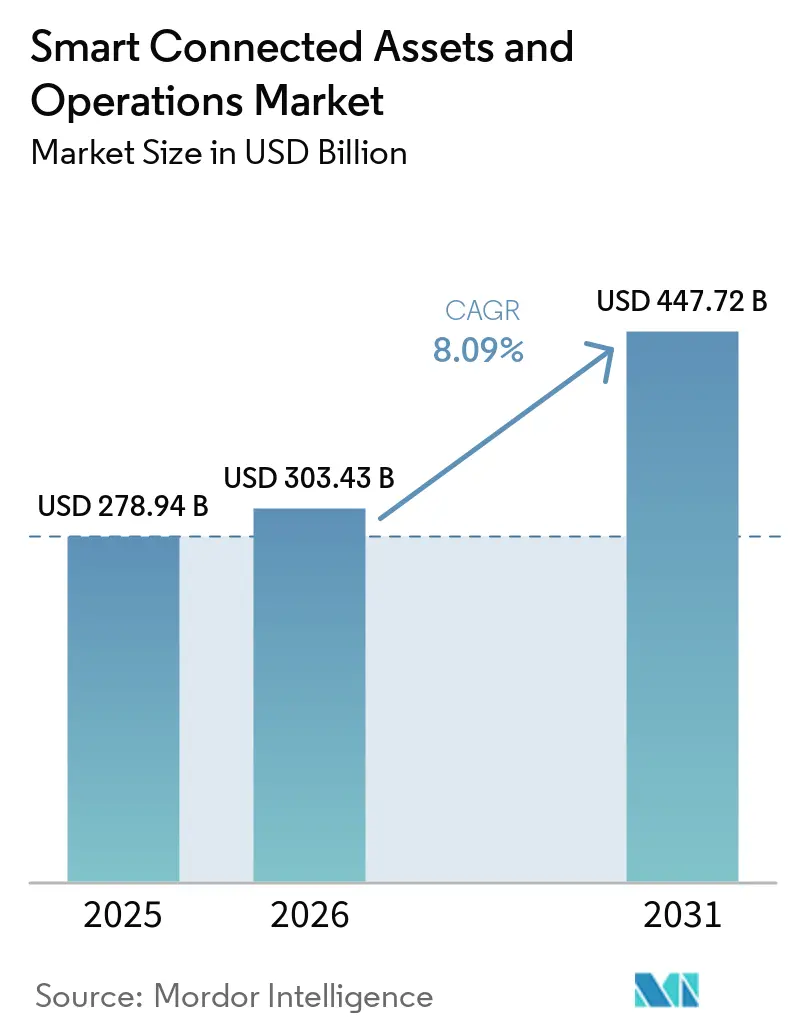
| Market Size (2026) | USD 303.43 Billion |
| Market Size (2031) | USD 447.72 Billion |
| Growth Rate (2026 - 2031) | 8.09% CAGR |
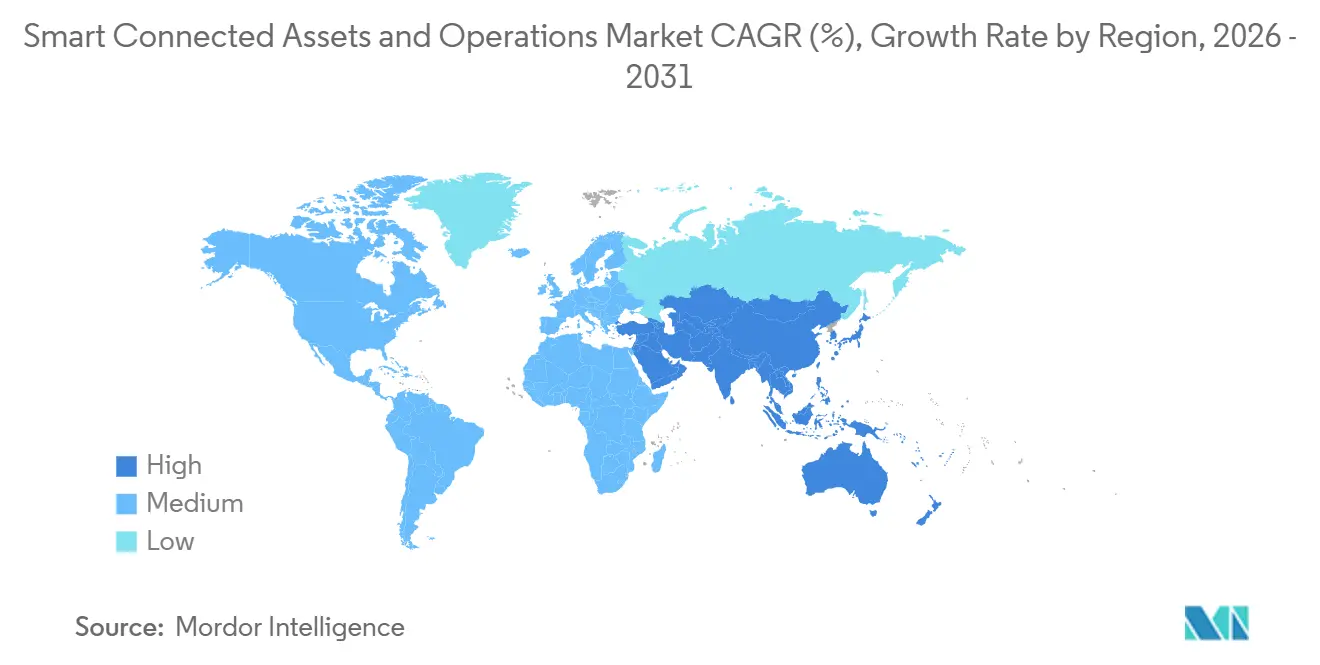
| Fastest Growing Market | Asia Pacific |
| Largest Market | North America |
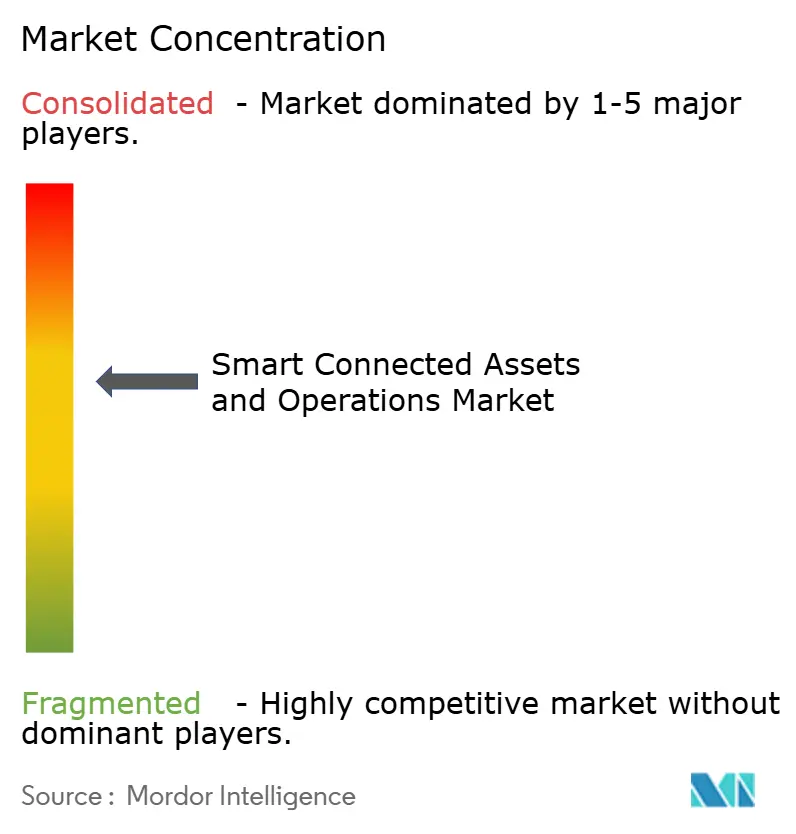
| Market Concentration | Medium |
Major Players *Disclaimer: Major Players sorted in no particular order Image © Mordor Intelligence. Reuse requires attribution under CC BY 4.0. | |
Smart Connected Assets And Operations Market Analysis by Mordor Intelligence
The Smart Connected Assets and Operations market size was valued at USD 278.94 billion in 2025 and is estimated to grow from USD 303.43 billion in 2026 to reach USD 447.72 billion by 2031, at a CAGR of 8.09% during 2026-2031. Demand is expanding as cloud-native analytics converge with operational technology, edge intelligence reduces latency, and environmental regulations penalize energy waste and unplanned downtime. Hardware remains the largest spending category, yet enterprise budgets are steadily shifting toward software subscriptions and managed services that enable outcome-based contracts. Wireless adoption is accelerating on the back of 5G private networks and low-power wide-area technologies that extend connectivity to remote assets traditional cabling cannot reach. Manufacturers, utilities, and resource companies are driving uptake to curb unplanned stoppages, increase safety, and achieve net-zero targets, while hyperscale cloud providers embed asset-performance modules directly into their industrial IoT suites.
Key Report Takeaways
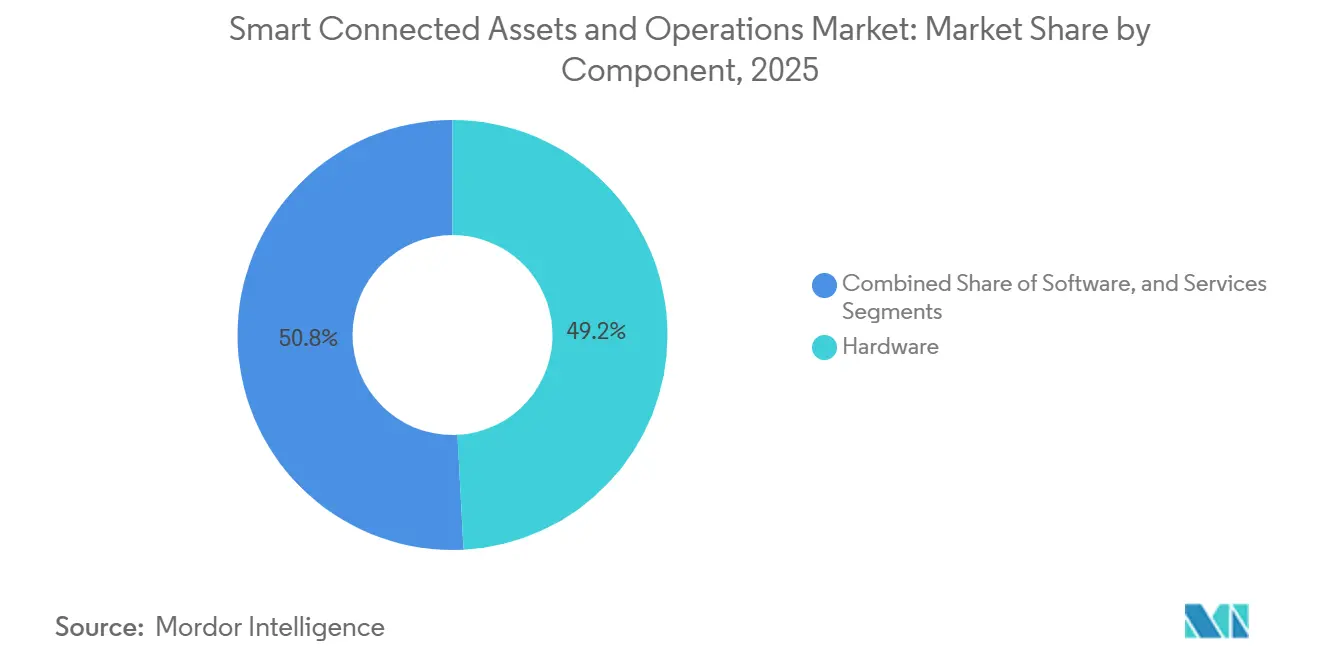
- By component, Hardware held 49.19% of the 2025 Smart Connected Assets and Operations market share, while software and services are advancing at an 8.72% CAGR through 2031.
- By connectivity technology, Ethernet accounted for 76.73% of 2025 revenue, while wireless connectivity is expanding at an 8.95% CAGR as 5G private networks mature.
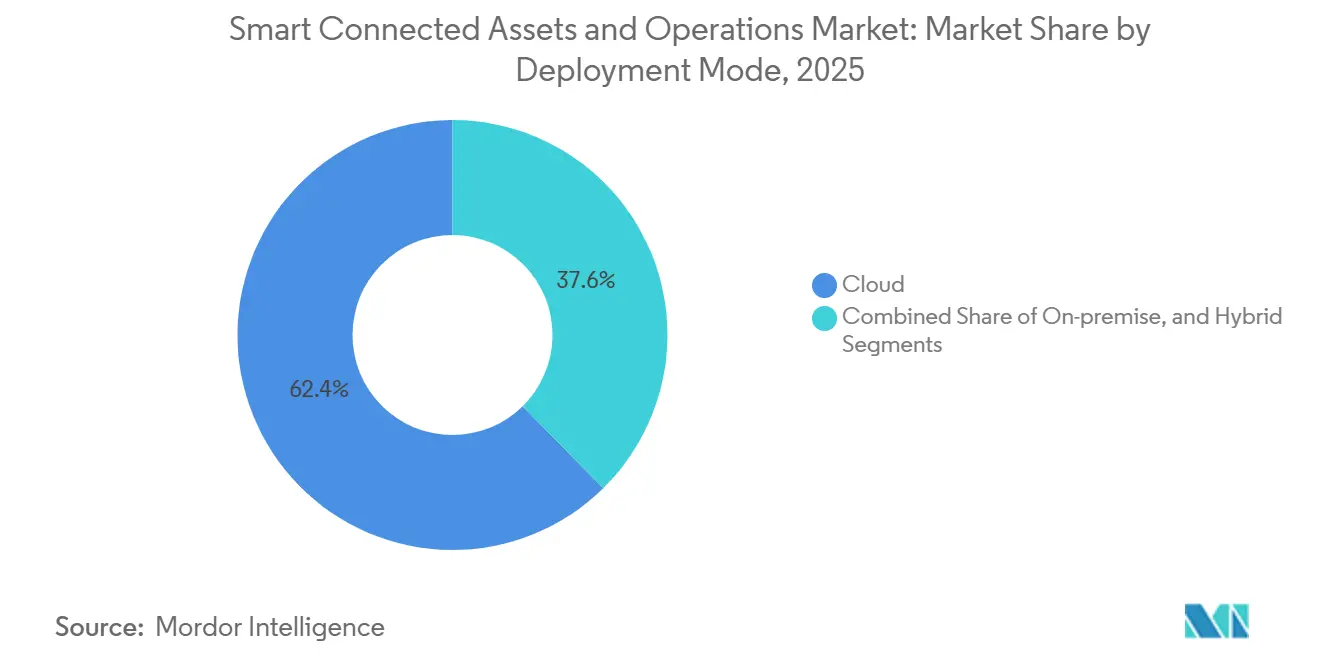
- By deployment mode, Cloud deployment accounted for 62.37% of the 2025 Smart Connected Assets and Operations market size and is growing at an 8.91% CAGR over 2026-2031.
- By industry vertical, Manufacturing accounted for 41.21% of 2025 revenue and is projected to grow at an 8.79% CAGR as predictive-maintenance programs scale.
- By geography, North America captured 37.63% of 2025 demand, advancing at an 8.87% CAGR on the back of reshoring incentives and grid-modernization spending over th forecast period.
Note: Market size and forecast figures in this report are generated using Mordor Intelligence’s proprietary estimation framework, updated with the latest available data and insights as of January 2026.
Global Smart Connected Assets And Operations Market Trends and Insights
Driver Impact Analysis*
| Driver | (~) % Impact on CAGR Forecast | Geographic Relevance | Impact Timeline |
|---|---|---|---|
| Rapid Adoption of Industrial IoT Platforms Integrating Asset Performance Management | +2.1% | Global, focus in North America and Asia-Pacific | Medium term (2-4 years) |
| Increasing Shift Toward Predictive Maintenance to Minimize Downtime | +1.8% | Global, strongest in Manufacturing and Energy sectors | Short term (≤2 years) |
| Demand for Remote Operations and Worker Safety in Hazardous Environments | +1.3% | Global, particularly Oil and Gas and Mining | Medium term (2-4 years) |
| Proliferation of 5G Private Networks Enabling Real-Time Analytics at the Edge | +1.6% | Asia-Pacific core, spill-over to North America and Europe | Long term (≥4 years) |
| Regulatory Push for Sustainability and Energy-Efficiency Reporting | +1.2% | North America and EU, expanding to Asia-Pacific | Long term (≥4 years) |
| Convergence of Digital Twin Technology With AI-Driven Asset Modeling | +1.4% | Global, early adoption in developed markets | Long term (≥4 years) |
| Source: Mordor Intelligence | |||
Rapid Adoption of Industrial IoT Platforms Integrating Asset Performance Management
Global manufacturers are consolidating point tools into unified industrial IoT platforms that stream sensor data, historian logs, and enterprise records into prescriptive-maintenance dashboards. Amazon Web Services shipped SiteWise Edge in 2025, offering sub-100 ms local latency while synchronizing summaries with the cloud, a design that keeps control networks isolated from public traffic.[1]AWS, “AWS SiteWise Edge,” Amazon Web Services, aws.amazon.com PTC’s 2025 investor filing showed ThingWorx deployments rising 40% year over year as automotive suppliers cited tight CAD and PLM integration that cuts root-cause analysis from days to hours. Rockwell Automation reported subscription software revenue surpassing USD 1 billion in 2025, driven by FactoryTalk Hub, which connects more than 500,000 devices worldwide. GE Digital repositioned Predix as a horizontal layer and now partners with domain specialists to deliver turnkey wind-farm and power-plant optimizations that extend turbine inspection intervals by up to 20%.
Increasing Shift Towards Predictive Maintenance to Minimise Downtime
Predictive maintenance has moved from pilot to enterprise scale as the savings case hardens. Shell documented a 35% drop in unplanned downtime and a 20% reduction in maintenance spend in its 2025 sustainability report, resulting in annual savings above USD 200 million. Factory AI achieved a 92% bearing-failure forecast accuracy 14 days before degradation across 12 automotive plants in 2025. Emerson’s AspenTech V15 embeds generative AI models that align maintenance windows with production schedules, helping chemical plants reduce unplanned outages by 15%.[2]Emerson, “AspenTech V15 Release Notes,” emerson.com The International Energy Agency calculates that similar techniques could avert USD 50 billion in outage costs across power generation by 2030 if adoption reaches 60%. Managed-service providers such as Augury bundle sensors, analytics, and uptime guarantees so mid-size factories can avoid capital expense while transferring performance risk to the vendor.
Proliferation of 5G Private Networks Enabling Real-Time Analytics at Edge
Private 5G removes reliability gaps that plagued Wi-Fi in metal-dense industrial halls. Siemens deployed private 5G across 15 factories by February 2026, achieving sub-10 ms machine-to-machine latency and supporting more than 10,000 devices per square kilometer. Celanese and NTT installed a private LTE network at the Clear Lake chemical complex, enabling real-time video analytics for previously manually inspected reactor vessels. Airbus and Ericsson now orchestrate robotic riveting over 5G standalone at Hamburg final assembly, sustaining sub-millimeter precision on 60-meter fuselage sections.[3]Ericsson AB, “Airbus 5G Standalone Case,” ericsson.com Bosch Rexroth confirmed packet loss below 0.01% under harsh electromagnetic interference, a threshold required for time-sensitive networking.
Regulatory Push for Sustainability and Energy-Efficiency Reporting
Governments are tightening disclosure rules that force operators to measure energy use at the asset level. The European Union’s Corporate Sustainability Reporting Directive obliges companies with over 250 employees to publish Scope 1-3 emissions in phased rollouts starting 2024. The United States Securities and Exchange Commission proposed similar climate-disclosure requirements in 2025, prompting utilities and manufacturers to instrument equipment to capture granular power and emissions data. Japan’s Ministry of Economy, Trade, and Industry now ties low-interest transition loans to verified reductions in plant-level energy intensity. Connected-asset platforms with embedded carbon libraries help enterprises calculate real-time greenhouse-gas intensity per product batch, simplifying audit preparation. Vendors that attain ISO 50001 energy-management certification are winning tenders as corporates align procurement with net-zero roadmaps.
Restraint Impact Analysis*
| Restraint | (~) % Impact on CAGR Forecast | Geographic Relevance | Impact Timeline |
|---|---|---|---|
| High Upfront Capital Requirements and Integration Complexity for Brownfield Assets | -0.8% | Global, especially Europe and North America, with aging industrial plants | Short term (≤ 2 years) |
| Cybersecurity Vulnerabilities Across Expanded Attack Surfaces | -0.7% | Global, particularly acute in critical infrastructure sectors | Medium term (2-4 years) |
| Interoperability Challenges Caused by Proprietary Legacy Protocols | -0.5% | Global, notably in process industries with multi-decade asset lifecycles | Long term (≥ 4 years) |
| Shortage of Cross-Disciplinary OT-IT-Analytics Talent | -0.6% | Global, most severe in North America and Western Europe | Medium term (2-4 years) |
| Source: Mordor Intelligence | |||
High Upfront Capital and Integration Complexity for Brownfield Assets
Retrofitting legacy machinery with sensors and gateways often costs multiple times as much as greenfield deployments. Schneider Electric reported average EcoStruxure rollouts at refineries lasting 18-24 months because engineers must reverse-engineer decades-old programmable-logic-controller logic before layering analytics. Emerson disclosed that 40% of asset-performance projects require custom middleware to bridge Modbus, Profibus, and Foundation Fieldbus, adding USD 200,000-500,000 per site. IEC 62443 cybersecurity standards finalized in 2024 compel network segmentation and encryption that many brownfield operators lack, driving parallel infrastructure upgrades. Regulated utilities, constrained by rate-case cycles, often defer such capital-heavy programs unless mandated by safety or compliance bodies.
Cyber-Security Vulnerabilities Across Expanded Attack Surfaces
Connecting control systems to enterprise IT enlarges the threat landscape for ransomware and nation-state actors. The Cybersecurity and Infrastructure Security Agency issued 47 ICS advisories in 2025, 30% more than in 2024, covering vulnerabilities in Siemens, Rockwell, and Schneider PLCs and HMIs. Dragos tracked 14 threat groups targeting industrial environments, with ransomware gangs encrypting safety-instrumented systems to maximize leverage. A 2025 peer-reviewed study found that 68% of manufacturers experienced at least one successful OT intrusion over the prior 24 months, with median dwell times of 180 days. Insurers now lift cyber-liability premiums 40-60% for policies covering operational technology and often exclude business-interruption losses, forcing firms to self-insure residual risk. Compliance pressures are mounting; the U.S. FDA mandated software bills of materials for medical devices in 2024, a template that other regulators are poised to extend to industrial equipment.
*Our forecasts treat driver/restraint impacts as directional, not additive. The impact forecasts reflect baseline growth, mix effects, and variable interactions.
Segment Analysis
By Component: Software and Services Outpace Hardware in Value Capture
Hardware retained 49.19% of 2025 revenue, yet the Smart Connected Assets and Operations market size for software and managed services is projected to expand at an 8.72% CAGR as enterprises migrate from reactive asset ownership to outcome-based contracts. Sensors and actuators are commoditizing as semiconductor vendors collapse analog-to-digital conversion, signal conditioning, and radios onto single chips, lowering unit prices by up to 20% annually. Edge gateways such as NVIDIA Jetson Orin deliver 275 TOPS in a 15-watt envelope, enabling on-device anomaly detection without cloud round-trips.
Software commands premium margins as vendors shift from perpetual licenses to consumption pricing. Asset performance suites like IBM Maximo and SAP Intelligent Asset Management embed generative AI that auto-drafts work orders and suggests spare-parts procurement, trimming planner workload by 40%. Managed-services contracts spanning 3-5 years are gaining traction among mid-size manufacturers, with providers assuming responsibility for sensor calibration, model retraining, and cybersecurity patching in exchange for uptime guarantees. Consequently, value capture is tilting toward vendors that bundle analytics, services, and continuous improvement rather than stand-alone hardware.


By Connectivity Technology: Wireless Gains Ground as 5G and LPWAN Mature
Ethernet dominated the Smart Connected Assets and Operations market with 76.73% market share in 2025, but wireless links are growing at an 8.95% CAGR as private 5G, NB-IoT, and LoRaWAN extend coverage to mobile and remote assets. Industrial Ethernet continues to anchor sub-1 ms deterministic control using IEEE 802.1 time-sensitive networking extensions built into Cisco, Hirschmann, and Moxa switches. Wireless options bifurcate between high-bandwidth intra-plant mobility and long-range, low-power telemetry.
Siemens’ February 2026 announcement of sub-10 ms production-floor latency underscores 5G’s suitability for autonomous mobile robots and augmented-reality workflows. NB-IoT accounts for 58% of low-power wide-area deployments globally due to seamless carrier integration, while LoRaWAN leads unlicensed spectrum rollouts outside China with 40% share. Satellite links from Iridium and emerging low-earth-orbit constellations backhaul telemetry from offshore rigs and remote mines where terrestrial networks remain impractical.
By Deployment Mode: Hybrid Architectures Balance Latency and Scalability
Cloud captured 62.37% of 2025 revenue and remains the largest Smart Connected Assets and Operations market segment, advancing at an 8.91% CAGR as hyperscalers release industrial-specific services. Manufacturers in semiconductor fabrication and pharmaceuticals continue to rely on millisecond-latency loops executed on-site to ensure real-time processing and decision-making. However, advancements in edge computing have enabled the integration of edge runtimes, such as AWS IoT Greengrass and Microsoft Azure IoT Hub, which facilitate seamless synchronization between local decision-making processes and elastic cloud-based analytics. This integration allows manufacturers to leverage the scalability and computational power of cloud platforms while maintaining the speed and efficiency of on-site operations.
Hybrid architectures allow enterprises to centralize digital-twin simulations and fleet-wide machine-learning inference in the cloud while retaining deterministic control on premises, avoiding internet dependency for safety-critical processes. Confidential computing enclaves now encrypt data in use, alleviating former security concerns. Meanwhile, regulators from the EU to China enforce data-residency laws, making distributed topologies unavoidable for multinationals operating across jurisdictions. As a result, hybrid deployments are emerging as the pragmatic choice balancing latency, sovereignty, and scale.
By Industry Vertical: Manufacturing Leads While Energy and Healthcare Accelerate
Manufacturing contributed 41.21% of 2025 revenue, and the Smart Connected Assets and Operations industry maintains momentum as automotive, electronics, and machinery companies digitize production lines to attain zero-defect quality targets. Automotive OEMs that implement AI-driven anomaly detection systems have reported a significant reduction of up to 50% in unplanned stoppages. This improvement not only enhances operational efficiency but also allows manufacturers to allocate additional capacity toward producing custom configurations, thereby meeting diverse customer demands more effectively.
Energy and utilities are closing the gap, with grid modernization initiatives driving large-scale sensor rollouts and USD 713 billion in global funding earmarked through 2030 for advanced distribution management systems. Mining operators leverage autonomous haulage and predictive maintenance to boost productivity and worker safety, while agriculture integrates smart irrigation and livestock monitoring to conserve water and enhance yields. Consequently, downstream verticals are poised to close in on manufacturing’s dominance as digital-first use cases proliferate across asset-intensive sectors.
Geography Analysis
North America generated 37.63% of 2025 revenue and is advancing at an 8.87% CAGR as manufacturers reshore capacity and utilities digitize aging transmission assets. The U.S. Department of Energy estimates that renewable penetration exceeded 40% in California and Texas, underscoring the urgency of grid modernization. Rockwell Automation earmarked USD 2 billion for domestic production of PLCs and edge devices to mitigate supply chain bottlenecks. Canada’s utilities in Ontario and British Columbia accelerate advanced-metering infrastructure deployments to shorten outage response times. Mexico attracts foreign investment in automotive electronics, spurring the adoption of connected-asset platforms to sync tri-national supply chains.
Europe prioritizes energy efficiency under the EU CSRD, compelling firms to quantify equipment-level emissions. Severn Trent partnered with Netmore in September 2025 to roll out 1 million LoRaWAN water meters to cut non-revenue water losses by 10%. Siemens, Schneider Electric, and ABB are piloting digital twin factories in Germany, France, and the United Kingdom before global scaling.[4]Netmore Group, “Severn Trent Selects Netmore to Deploy and Manage Advanced Metering Infrastructure Network for One Million Smart Water Meters,” netmoregroup.com Geopolitical sanctions slow Russia's modernization, steering regional demand toward domestic automation vendors.
Asia-Pacific posts the fastest absolute growth as China, Japan, India, and South Korea embed smart-manufacturing policies. China’s Made in China roadmap prioritizes intelligent factories, while Japan’s Society 5.0 aligns cyber-physical systems to offset workforce aging. India’s Smart Cities Mission supports IoT-enabled networks for traffic, waste, and water in 100 urban centers. Australia’s miners operate autonomous fleets controlled from urban centers thousands of kilometers away, validating the viability of edge analytics in remote environments. The Middle East channels oil revenues into diversified smart-city projects, such as Saudi Arabia’s NEOM, and demands robust asset-performance layers. South Africa and Nigeria are piloting precision agriculture and smart metering solutions to improve food security and grid reliability. South America, led by Brazil and Argentina, applies connected-asset frameworks in agribusiness to meet export-market sustainability certification requirements.

Competitive Landscape
The Smart Connected Assets and Operations market is moderately concentrated, with the top 10 vendors capturing roughly 45% of 2025 revenue, yet competition is intensifying as software-native entrants and hyperscalers erode incumbents’ control-system moats. Siemens, Schneider Electric, ABB, Honeywell, Rockwell Automation, and Emerson leverage decades of installed base to cross-sell analytics and lifecycle services. ABB filed 127 industrial-AI patents in 2025, focusing on energy optimization and predictive maintenance for process industries.
PTC, IBM, Microsoft, SAP, and Oracle deliver horizontal platforms that integrate asset performance with enterprise resource planning, giving buyers vendor-agnostic alternatives. AWS, Azure, and Google Cloud bundle asset-performance analytics into their IoT suites, shrinking the total cost of ownership for greenfield adopters. Niche specialists such as Uptake, Augury, and Senseye capture white-space opportunities in wind-turbine diagnostics, HVAC monitoring, and condition-based maintenance through consumption-based pricing.
Strategic alliances are growing, with ABB and Schneider Electric announcing a September 2025 partnership to co-develop interoperable edge-to-cloud energy management solutions, reflecting customer demand for open ecosystems. Consolidation remains likely, with automation majors eyeing cloud-native analytics startups to accelerate recurring-revenue transitions. Vendors that obtain IEC 62443 cybersecurity and ISO 55000 asset management certifications gain preferred supplier status for critical infrastructure bids. Competitive differentiation now hinges on AI-model accuracy, secure edge-to-cloud orchestration, and the ability to contractually guarantee performance outcomes.
Smart Connected Assets And Operations Industry Leaders
Siemens AG
General Electric Company
Schneider Electric SE
ABB Ltd.
Honeywell International Inc.
- *Disclaimer: Major Players sorted in no particular order

Recent Industry Developments
- March 2026: 1NCE and Netmore Group partnered to integrate cellular and LoRaWAN connectivity into a unified IoT platform, enabling device-specific selection of power, range, and throughput options.
- February 2026: Siemens deployed private 5G across 15 German and Chinese factories, achieving sub-10 ms machine-to-machine latency for precision manufacturing.
- February 2026: ABB launched Automation Extended, combining edge computing, AI analytics, and cybersecurity to retrofit brownfield assets with minimal downtime.
- January 2026: Honeywell introduced Forge 3.0, a cloud-native IIoT suite embedding generative AI that reduced mean time to repair by 30% in early aerospace and refining deployments.


Global Smart Connected Assets And Operations Market Report Scope
The Smart Connected Assets and Operations Market pertains to the industry segment dedicated to the integration of advanced technologies, including the Internet of Things (IoT), artificial intelligence (AI), cloud computing, and big data analytics, into physicarefers to the industry segment that integratesl assets and operational processes to improve efficiency, reliability, and performance.
The Smart Connected Assets and Operations Market Report is Segmented by Component (Hardware, Software, and Services), Connectivity Technology (Wired, Wireless, and Satellite), Deployment Mode (On-Premise, Cloud, and Hybrid), Industry Vertical (Manufacturing, Energy and Utilities, Oil and Gas, Mining, Transportation and Logistics, Healthcare, Agriculture, and Smart Cities and Infrastructire), and Geography (North America, Europe, Asia-Pacific, Middle East and Africa, and South America). The Market Forecasts are Provided in Terms of Value (USD).
| Hardware | Sensors and Actuators |
| Gateways and Edge Devices | |
| Software | Asset Performance Management (APM) |
| Manufacturing Execution System (MES) | |
| SCADA and HMI | |
| Analytics and AI Platforms | |
| Services | Professional Services |
| Managed Services |
| Wired | Ethernet |
| Industrial Fieldbus | |
| Wireless | Wi-Fi and Bluetooth |
| 5G / Private LTE | |
| LPWAN (LoRa, NB-IoT, Sigfox) | |
| Satellite / Remote |
| On-Premise |
| Cloud |
| Hybrid |
| Manufacturing |
| Energy and Utilities |
| Oil and Gas |
| Mining |
| Transportation and Logistics |
| Healthcare |
| Agriculture |
| Smart Cities and Infrastructure |
| North America | United States |
| Canada | |
| Mexico | |
| Europe | Germany |
| United Kingdom | |
| France | |
| Russia | |
| Rest of Europe | |
| Asia-Pacific | China |
| Japan | |
| India | |
| South Korea | |
| Australia | |
| Rest of Asia-Pacific | |
| Middle East and Africa | Middle East |
| Africa | |
| South America | Brazil |
| Argentina | |
| Rest of South America |
| By Component | Hardware | Sensors and Actuators |
| Gateways and Edge Devices | ||
| Software | Asset Performance Management (APM) | |
| Manufacturing Execution System (MES) | ||
| SCADA and HMI | ||
| Analytics and AI Platforms | ||
| Services | Professional Services | |
| Managed Services | ||
| By Connectivity Technology | Wired | Ethernet |
| Industrial Fieldbus | ||
| Wireless | Wi-Fi and Bluetooth | |
| 5G / Private LTE | ||
| LPWAN (LoRa, NB-IoT, Sigfox) | ||
| Satellite / Remote | ||
| By Deployment Mode | On-Premise | |
| Cloud | ||
| Hybrid | ||
| By Industry Vertical | Manufacturing | |
| Energy and Utilities | ||
| Oil and Gas | ||
| Mining | ||
| Transportation and Logistics | ||
| Healthcare | ||
| Agriculture | ||
| Smart Cities and Infrastructure | ||
| By Geography | North America | United States |
| Canada | ||
| Mexico | ||
| Europe | Germany | |
| United Kingdom | ||
| France | ||
| Russia | ||
| Rest of Europe | ||
| Asia-Pacific | China | |
| Japan | ||
| India | ||
| South Korea | ||
| Australia | ||
| Rest of Asia-Pacific | ||
| Middle East and Africa | Middle East | |
| Africa | ||
| South America | Brazil | |
| Argentina | ||
| Rest of South America | ||


Key Questions Answered in the Report
What is the projected value of the Smart Connected Assets and Operations market in 2031?
The market is forecast to reach USD 447.72 billion by 2031.
Which component segment is growing the fastest?
Software and managed services are expanding at an 8.72% CAGR, as enterprises increasingly favor subscription-based analytics over stand-alone hardware.
Why are private 5G networks important for connected-asset deployments?
They offer sub-10 ms latency and high device density, enabling autonomous robots, AR-guided maintenance, and closed-loop quality control.
How does predictive maintenance deliver financial benefits?
Case studies indicate up to 35% reductions in unplanned downtime and 20% lower maintenance spending, translating into millions of dollars in annual savings.
Which region currently leads demand?
North America, with a 37.63% revenue share in 2025, driven by early industrial IoT adoption and grid-modernization investments.
What is the main cybersecurity concern for connected operations?
The expanded attack surface increases exposure to ransomware and nation-state threats targeting control systems, raising insurance and compliance costs.
Page last updated on:


