Smart Energy Market Size and Share
Market Overview
| Study Period | 2019 - 2030 |
|---|---|
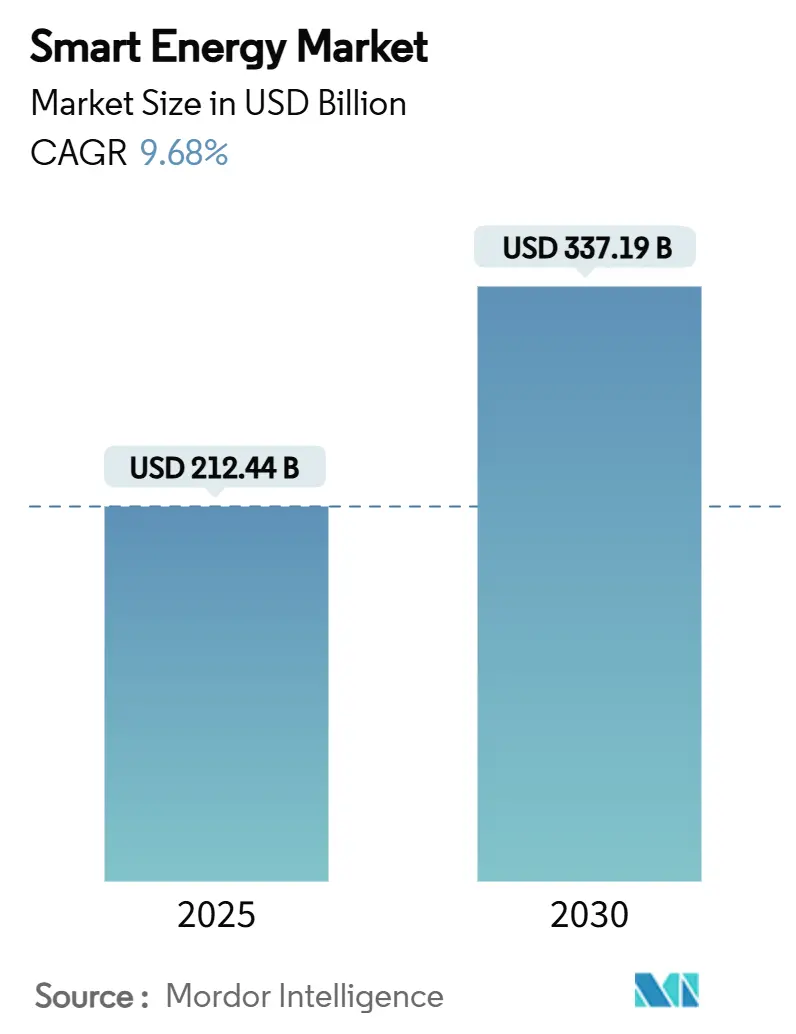
| Market Size (2025) | USD 212.44 Billion |
| Market Size (2030) | USD 337.19 Billion |
| Growth Rate (2025 - 2030) | 9.68% CAGR |
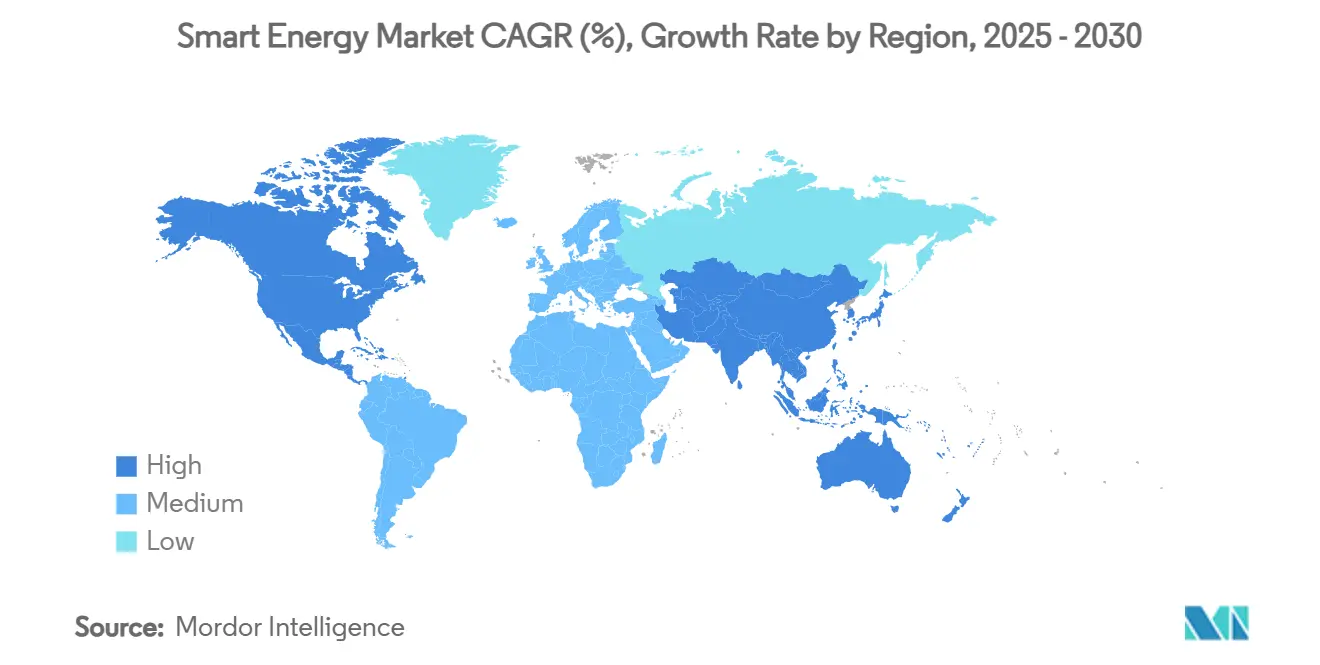
| Fastest Growing Market | Asia Pacific |
| Largest Market | North America |
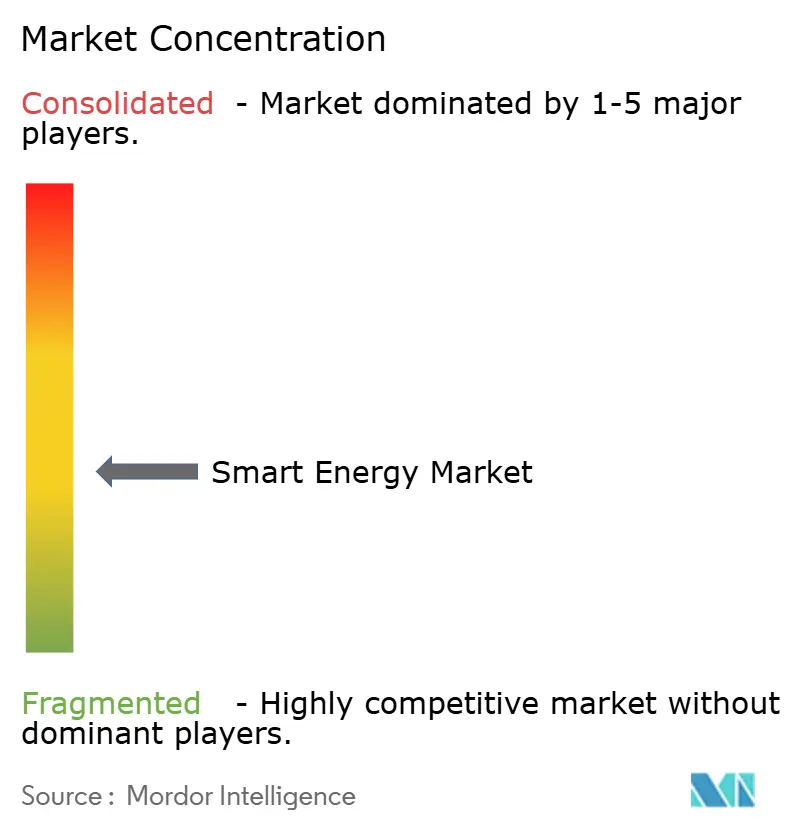
| Market Concentration | Medium |
Major Players *Disclaimer: Major Players sorted in no particular order Image © Mordor Intelligence. Reuse requires attribution under CC BY 4.0. | |
Smart Energy Market Analysis by Mordor Intelligence
The smart energy market size stood at USD 212.44 billion in 2025 and is projected to reach USD 337.19 billion by 2030, reflecting a 9.68% CAGR during the forecast period. Robust government funding, rapid digitalization of power infrastructure, and growing renewable penetration collectively underpin this expansion. Grid-modernization capital outlays such as the U.S. Department of Energy’s USD 14.5 billion allocation in 2024 and China State Grid’s CNY 600 billion (USD 83 billion) commitment are accelerating turnkey deployments of advanced metering, distribution automation, and utility-scale storage solutions.[1]U.S. Department of Energy, “2024 Wrap-Up: Advancing a More Powerful Grid,” energy.gov North America retained the lead with 35.78% revenue contribution in 2024 on the back of stable regulatory frameworks, while Asia-Pacific is expanding the fastest at 12.57% CAGR to large-scale infrastructure programs in China, India, Japan, and South Korea. Competitive intensity is rising as traditional equipment vendors pivot toward software-defined architectures, highlighted by Siemens Smart Infrastructure’s 11% 2024 order growth and 6-9% annual revenue ambition through 2029. Meanwhile, cybersecurity vulnerabilities and interoperability gaps remain key risks that utilities must manage through robust governance and standards compliance.
Key Report Takeaways
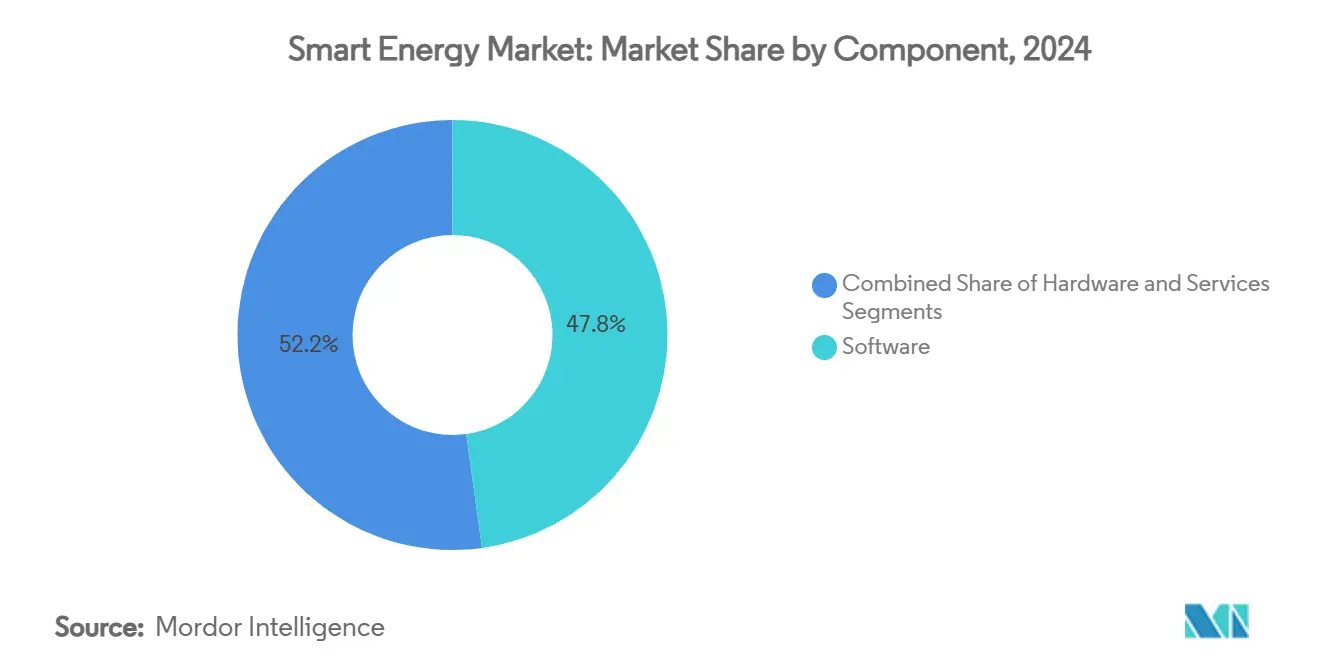
- By component, software captured a 47.81% share of the smart energy market in 2024, and services is projected to capture a 10.72% CAGR between 2025 to 2030.
- By technology, smart grids captured a 38.47% share in the smart energy market for energy storage and energy storage and flexibility platforms is projected to capture an 11.93% CAGR between 2025 to 2030.
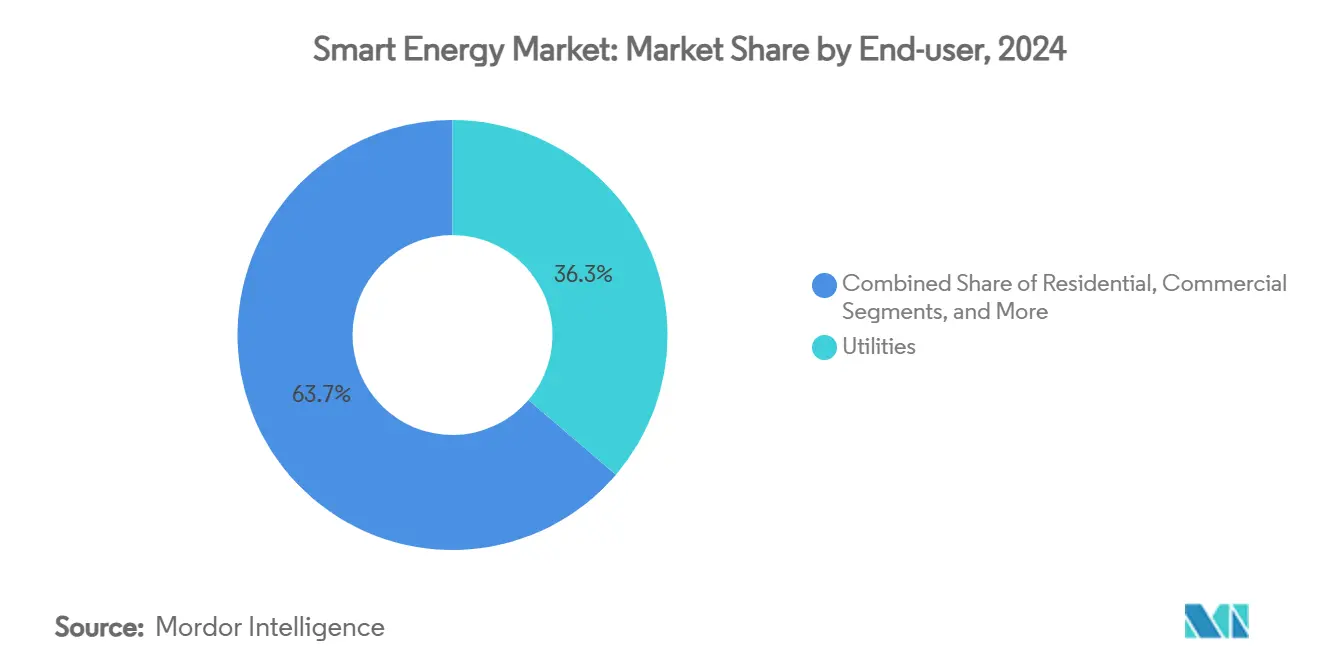
- By end-user, utilities captured a 36.26% share of the Smart Energy market in 2024, and industrial customers is projected to capture a 11.12% CAGR between 2025 to 2030.
- By application, distribution automation captured a 41.15% share in the smart energy market and is projected to capture a 12.34% CAGR between 2025 to 2030.
- By geography, North America captured a 35.78% share of the smart energy market in 2024, and Asia-Pacific is projected to capture a 12.57% CAGR between 2025 to 2030.
Global Smart Energy Market Trends and Insights
Drivers Impact Analysis*
| Driver | (~) % Impact on CAGR Forecast | Geographic Relevance | Impact Timeline |
|---|---|---|---|
| Rapid smart-grid capex programmes | + 2.8% | North America, EU, China | Medium term (2-4 years) |
| Mandatory rollout of advanced metering | + 1.9% | North America, EU, Australia | Short term (≤ 2 years) |
| AI-driven predictive maintenance | + 1.6% | Global (developed markets lead) | Medium term (2-4 years) |
| Surge in EV load and bidirectional flexibility | + 1.4% | North America, EU, China, Japan | Long term (≥ 4 years) |
| Blockchain peer-to-peer trading pilots | + 0.8% | EU, North America, Australia | Long term (≥ 4 years) |
| Electrification of HVAC systems | + 1.1% | Smart-city projects worldwide | Medium term (2-4 years) |
| Source: Mordor Intelligence | |||
Rapid Smart-Grid Capex Programmes Drive Infrastructure Transformation
Government-backed capital programmes are reshaping the smart energy market by funding transmission upgrades, distribution automation, and digital control layers. The U.S. Grid Resilience and Innovation Partnerships programme alone dedicates USD 10.5 billion across fiscal 2022-2026 to accelerate grid-hardening projects. China State Grid surpassed CNY 600 billion (USD 83 billion) in 2024 spending, the utility’s largest annual outlay, prioritizing ultra-high-voltage corridors and real-time monitoring platforms. The EU’s Action Plan for Grids identifies EUR 584 billion investment needs by 2030 to integrate 60% higher electricity demand and fast-growing renewables. Japan’s Green Transformation roadmap adds further momentum by earmarking capital for hydrogen-ready transmission assets and distributed controls. Collectively, these commitments shorten deployment cycles for advanced metering infrastructure, wide-area situational awareness tools, and edge-computing devices that underpin future-proof, decarbonized grids.
Mandatory Advanced Metering Infrastructure Rollouts Accelerate Market Penetration
Regulators in multiple regions are enforcing universal smart-meter mandates that unlock granular consumption data and enable two-way communication. Australia’s Energy Market Commission set a 2030 deadline for full smart-meter coverage within the National Electricity Market, ensuring access to voltage data and near-real-time outage alerts.[2]Australian Energy Market Commission, “Accelerating Smart Meter Deployment,” aemc.gov.au In the United States, investor-owned utilities such as NIPSCO plan 490,000 installations between 2024-2027, while SWEPCO is rolling out 234,000 devices in Louisiana by 2025. Mandates in Europe require smart-meter penetration above 80% by 2028, setting the foundation for dynamic tariffs and automated demand-response programmes. These deployments lower operational expenditures by eliminating manual meter reads, enabling outage localisation within seconds, and providing the high-frequency data stream required for AI-based load forecasting.
AI-Driven Predictive Maintenance Transforms Operational Economics
Artificial intelligence is redefining asset-management economics by pinpointing failure modes before they escalate. Field studies across wind, solar, and hydro portfolios show AI models predict component failures with 92% accuracy, cutting unplanned downtime by 35% and boosting energy output by 8.5%. California’s cloud-based ACCO-BEMS pilot trimmed building-energy use by 25% and delivered 35% cost savings, evidencing cross-sector applicability. Utilities embrace these tools to offset looming skills shortages, with 89% of energy professionals citing digital-talent gaps as a deployment hurdle. By automating inspections and optimising maintenance intervals, AI lengthens asset life, defers capex, and contributes a 1.6-percentage-point uplift to the smart energy market CAGR.
Electric Vehicle Integration Demands Bidirectional Grid Flexibility
Soaring EV adoption adds both load stress and flexibility potential. Vehicle-to-Grid (V2G) studies project aggregated discharge capacity of 20-90 GW and energy storage up to 540 GWh by 2030, enough to provide significant peak-shaving reserves. Japan’s 100% EV sales target for 2035, paired with 300,000 public chargers by 2030, underscores infrastructure urgency. Utilities are deploying smart-charging algorithms and distribution-automation schemes to manage coincident charging peaks and monetize ancillary-service revenues. Advanced battery-management systems mitigate degradation in bidirectional cycles, ensuring EV owners retain warranty coverage while utilities access low-cost, distributed storage.
Restraints Impact Analysis*
| Restraint | (~) % Impact on CAGR Forecast | Geographic Relevance | Impact Timeline |
|---|---|---|---|
| High upfront capex and long payback | -1.8% | Developing markets and smaller utilities | Short term (≤ 2 years) |
| Escalating cyber-security and data-privacy risk | -1.2% | Critical-infrastructure markets worldwide | Medium term (2-4 years) |
| Interoperability and legacy-system gaps | -0.9% | Markets with ageing grids | Medium term (2-4 years) |
| Scarcity of grid-edge AI/OT-security talent | -0.7% | Digitally advanced economies | Long term (≥ 4 years) |
| Source: Mordor Intelligence | |||
High Capital Requirements Challenge Market Penetration
Utility-scale storage ventures such as the 250 MW/1,000 MWh Compass project illustrate the sizable outlays required to modernise grids. Similar petitions in Massachusetts seek zoning relief for 180 MW and 125 MW standalone batteries, underscoring developer exposure to lengthy permitting cycles. Smart-HVAC retrofits, although producing 9-10% savings, still face adoption friction due to higher upfront and recurring software fees. Financing hurdles are acute in emerging economies where utilities have weaker balance sheets and limited tariff headroom. Consequently, high capital intensity dampens near-term uptake, slicing 1.8 percentage points from the smart energy market CAGR.
Cybersecurity Vulnerabilities Threaten Infrastructure Resilience
Digitalisation multiplies attack vectors from endpoint devices to supervisory controls. Simulation work shows coordinated cyber incidents can induce voltage collapse and rolling blackouts if protective relays are compromised. Reviews of Advanced Metering Infrastructure uncover threats to data integrity during meter-to-head-end communications, including replay, spoofing, and ransomware attacks. Utilities now earmark up to 8% of annual IT/OT budgets for cyber defences, affecting the economics of new digital rollouts. Without robust authentication, encryption, and zero-trust architectures, smart-grid value creation remains at risk, trimming 1.2% points from forecast growth.
*Our forecasts treat driver/restraint impacts as directional, not additive. The impact forecasts reflect baseline growth, mix effects, and variable interactions.
Segment Analysis
By Component: Integration Complexity Sustains Solutions Leadership
Software dominated the smart energy market with a 47.81% revenue contribution in 2024, underpinned by turnkey consulting, system design, and managed-service contracts that address end-to-end deployment complexity. Services, although smaller in absolute terms, posted the fastest 10.72% CAGR and are poised to overtake hardware expenditures by 2029 as utilities pivot toward AI-driven optimisation suites. The shift reinforces the narrative that operational intelligence yields higher returns than incremental hardware refreshes.
Siemens’ digital-business revenue doubling to EUR 1.7 billion in 2024 exemplifies this swing toward data-centric value capture.[3]Siemens AG, “Smart Infrastructure Sets Higher Ambitions,” siemens.comHardware retains relevance for grid sensing and protection roles, but profit pools are steadily migrating to SaaS licences and performance-based O&M agreements. Consequently, the smart energy market size for integrated solutions is anticipated to compound briskly as stakeholders outsource complexity to domain specialists.


By Technology: Smart Grids Anchor Deployment; Storage Surges Ahead
Smart Grids held 38.47% of 2024 revenues, reflecting their foundational role in enabling real-time monitoring, advanced protection, and distributed resource orchestration. Yet Energy Storage and Flexibility Platforms are scaling fastest at 11.93% CAGR as battery prices fall and policy support for capacity markets deepens.
Wärtsilä’s 240 MW/1,030 MWh expansion at Eraring will lift Australia’s largest battery to 700 MW, signalling the technology’s mainstreaming. Local voltage-regulation schemes are increasingly seeing participation from smart energy systems, leading to dynamic grid balancing, enhanced reactive power support, and heightened energy efficiency in distributed networks.Digital-twin overlays and advanced power-flow controls further increase hosting capacity for rooftop PV, cementing the smart energy market share of integrated grid-control ecosystems.
By End-user: Utilities Remain Core; Industry Emerges as Growth Engine
Utilities accounted for 36.26% of global spend in 2024, primarily through rate-based investments that modernise aging infrastructure and meet reliability mandates. Industrial customers, especially heavy manufacturers, electrifying process heat, represent the fastest-growing 11.12% CAGR segment. Brattle Group modelling shows Virtual Power Plants leveraging consumer devices could save California USD 750 million annually, underscoring the economic upside for both utilities and corporate buyers.
The smart energy market size for industrial monitoring platforms is projected to rise sharply as factories adopt ISO-aligned energy-management standards and seek real-time carbon accounting dashboards. Commercial and residential customers also advance, albeit at steadier trajectories, driven by building-automation retrofits and EV-charging adoption.
By Application: Distribution Automation Sits at the Epicentre of Grid Modernisation
Distribution Automation commanded 41.15% revenue in 2024, reflecting its role in managing bi-directional power flows and fault-location isolation. It is simultaneously the fastest-growing application at 12.34% CAGR, propelled by FERC’s dynamic-line-rating directives that monetise latent conductor headroom.
Automated feeder reconfiguration, voltage-optimisation, and DERMS platforms now integrate seamlessly, reducing outage minutes and deferring substation upgrades. Generation-optimisation software, transmission synchrophasor analytics, and prosumer-management dashboards collectively support grid stability but grow at lower rates, reinforcing Distribution Automation’s centrality to smart energy market growth.
Geography Analysis
North America sustained leadership with 35.78% of 2024 revenues because of multi-billion-dollar federal grants such as GRIP and clear FERC policy roadmaps that lower investment risk. California’s streamlined storage approvals and income-graduated fixed-charge reforms further accelerate behind-the-meter technology adoption, making the region an early testbed for demand-flexibility marketplaces. The smart energy market size across the U.S. and Canada will keep compounding due to the rising electrification of the transport and heating sectors.
Asia-Pacific is projected to record the highest 12.57% CAGR through 2030, driven by China’s CNY 600 billion grid-modernisation outlay, Japan’s Green Transformation strategy, and South Korea’s 121.9 GW renewable-capacity target. Aggressive rooftop-solar subsidies, high-speed EV-charging corridors, and growing data-center demand further catalyse technology uptake across India, Southeast Asia, and Oceania. Consequently, Asia-Pacific’s smart energy market share will close the gap with North America.
Europe maintains steady growth underpinned by the EU Action Plan for Grids, which estimates EUR 584 billion of network investment needed by 2030. Cross-border interconnectors, dynamic-line-rating pilots, and cyber-resilience obligations ensure member states coordinate on technical standards, lowering the cost of integrating 450 GW of variable renewables expected by 2030. High carbon-price signals and mandated smart-meter rollouts guarantee a stable revenue floor for technology vendors across the region.

Competitive Landscape
The smart energy market remains moderately fragmented, with the top five vendors controlling an estimated 45-50% revenue share across hardware, software, and services. Incumbents such as ABB, Siemens, Schneider Electric, and General Electric leverage manufacturing scale, global service footprints, and broad product catalogues to win turnkey utility contracts. ABB’s USD 32.9 billion in 2024 revenue and 78% emissions reduction underscore its alignment with customers' decarbonization goals. Siemens targets a 6-9% top-line expansion by deepening software monetization, while Hitachi Energy’s additional USD 4.5 billion in capacity investment through 2027 widens its transformer and HVDC supply moat.
Emerging specialists compete through niche innovations such as AI-based predictive-maintenance SaaS, OT cybersecurity appliances, and blockchain trading layers. Start-ups offering low-code DERMS, digital-twin grid simulators, and battery analytics platforms secure venture funding as utilities de-risk pilot projects. ABB’s planned acquisition of Gamesa Electric’s power-electronics arm will add 40 GW of serviceable installed base, expanding its renewable converter portfolio.
Strategic partnerships bridge capability gaps. Software vendors embed their analytics in OEM switchgear, while cloud providers co-develop edge-computing frameworks for substation automation. Standards compliance confers market access advantages; products certified under NIST’s Interoperability Framework find easier procurement pathways with regulated utilities. Overall, competitive positioning now pivots on delivering secure, interoperable, outcome-based solutions rather than discrete hardware, reinforcing service-oriented growth prospects within the smart energy market.
Smart Energy Industry Leaders
Siemens AG
Schneider Electric SE
General Electric Company
ABB Ltd
Honeywell International Inc.
- *Disclaimer: Major Players sorted in no particular order

Recent Industry Developments
- February 2025: ABB released its 2024 Annual Report, highlighting USD 32.9 billion revenue and a 78% cut in scope 1 and 2 emissions since 2019.
- January 2025: The U.S. Department of Energy published the Vehicles-to-Grid Integration Assessment Report, mapping strategies to leverage EV storage for grid stability.
- December 2024: ABB agreed to acquire Gamesa Electric’s power-electronics business, adding 40 GW to its addressable installed base.
- December 2024: Siemens Smart Infrastructure raised revenue-growth guidance to 6-9% and doubled digital income to EUR 1.7 billion.


Global Smart Energy Market Report Scope
| Hardware |
| Software |
| Services |
| Smart Grids |
| Smart Meters |
| Energy Management Systems |
| Energy Storage and Flexibility Platforms |
| Utilities |
| Residential |
| Commercial |
| Industrial |
| Generation Optimization |
| Transmission |
| Distribution Automation |
| Consumption / Prosumer Management |
| North America | United States |
| Canada | |
| Mexico | |
| South America | Brazil |
| Argentina | |
| Rest of South America | |
| Europe | Germany |
| United Kingdom | |
| France | |
| Italy | |
| Spain | |
| Rest of Europe | |
| Asia-Pacific | China |
| Japan | |
| South Korea | |
| India | |
| Rest of Asia-Pacific | |
| Middle East | Saudi Arabia |
| United Arab Emirates | |
| Rest of Middle East | |
| Africa | South Africa |
| Nigeria | |
| Rest of Africa |
| By Component | Hardware | |
| Software | ||
| Services | ||
| By Technology | Smart Grids | |
| Smart Meters | ||
| Energy Management Systems | ||
| Energy Storage and Flexibility Platforms | ||
| By End-user | Utilities | |
| Residential | ||
| Commercial | ||
| Industrial | ||
| By Application | Generation Optimization | |
| Transmission | ||
| Distribution Automation | ||
| Consumption / Prosumer Management | ||
| By Geography | North America | United States |
| Canada | ||
| Mexico | ||
| South America | Brazil | |
| Argentina | ||
| Rest of South America | ||
| Europe | Germany | |
| United Kingdom | ||
| France | ||
| Italy | ||
| Spain | ||
| Rest of Europe | ||
| Asia-Pacific | China | |
| Japan | ||
| South Korea | ||
| India | ||
| Rest of Asia-Pacific | ||
| Middle East | Saudi Arabia | |
| United Arab Emirates | ||
| Rest of Middle East | ||
| Africa | South Africa | |
| Nigeria | ||
| Rest of Africa | ||


Key Questions Answered in the Report
What is the projected value of the smart energy market by 2030?
The market is forecast to reach USD 337.19 billion by 2030.
Which region is expected to grow fastest in smart-grid investments this decade?
Asia-Pacific is projected to post a 12.57% CAGR through 2030 thanks to large-scale programmes in China, Japan, India, and South Korea.
Which technology area is showing the highest growth momentum?
Energy Storage and Flexibility Platforms are expanding at an 11.93% CAGR, driven by utility-scale battery deployments and vehicle-to-grid integration.
How much market share did Distribution Automation command in 2024?
Distribution Automation held 41.15% of 2024 revenues, underscoring its pivotal role in grid modernization.
What are the main obstacles to wider smart-energy adoption?
High up-front capex, cyber-security vulnerabilities, interoperability challenges, and a shortage of OT-security talent collectively constrain rollouts, subtracting more than 4 percentage points from potential growth.
Which companies are leading the competitive field?
ABB, Siemens, Schneider Electric, General Electric, and Hitachi Energy together account for nearly half of total market revenues, yet specialised start-ups are gaining traction in AI, cybersecurity, and blockchain niches.
Page last updated on:


