Smart Kitchen Market Size and Share
Market Overview
| Study Period | 2020 - 2031 |
|---|---|
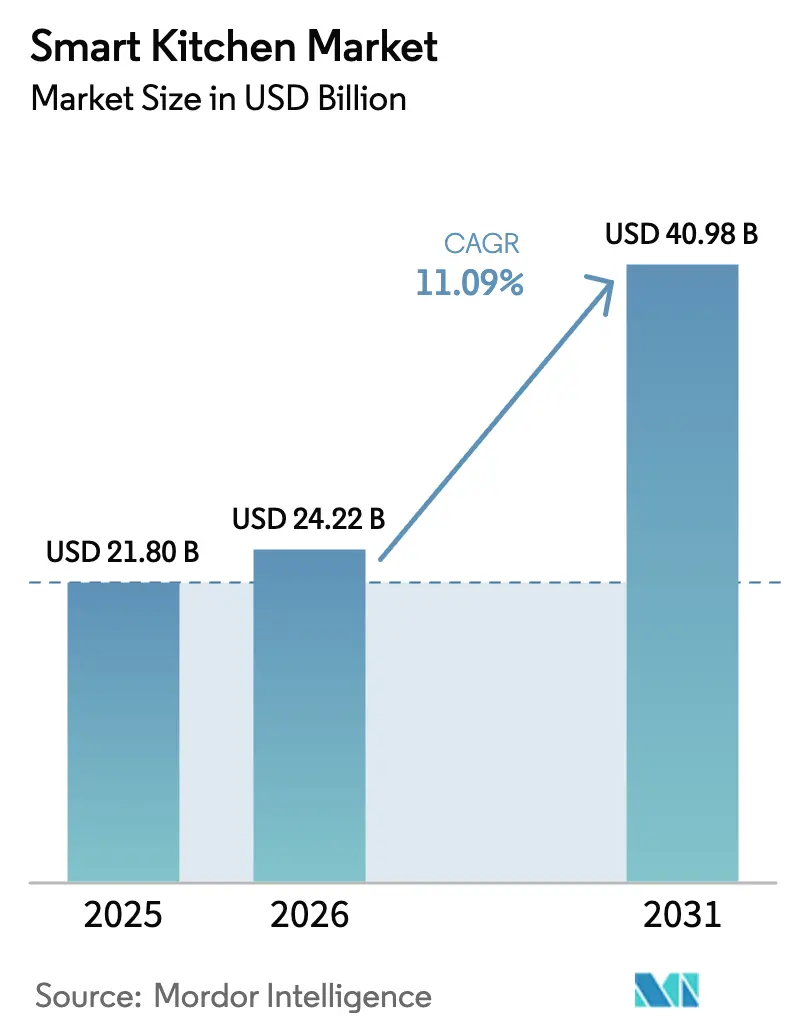
| Market Size (2026) | USD 24.22 Billion |
| Market Size (2031) | USD 40.98 Billion |
| Growth Rate (2026 - 2031) | 11.09% CAGR |
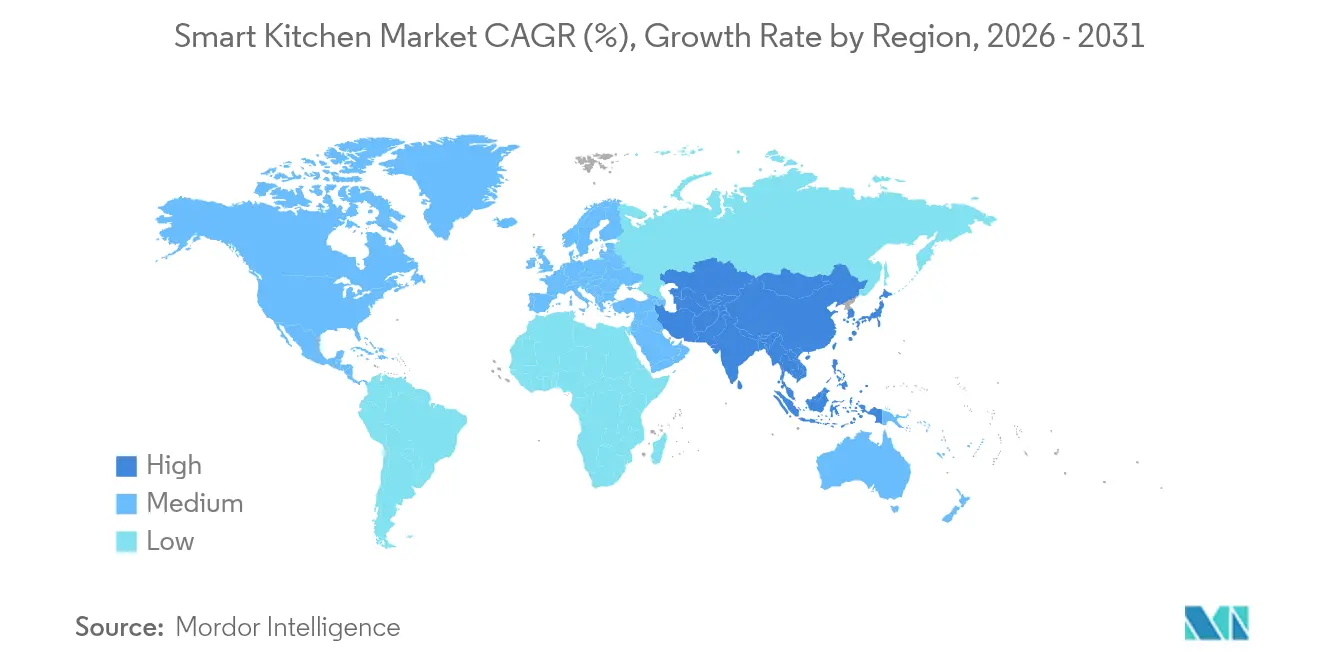
| Fastest Growing Market | Asia Pacific |
| Largest Market | North America |
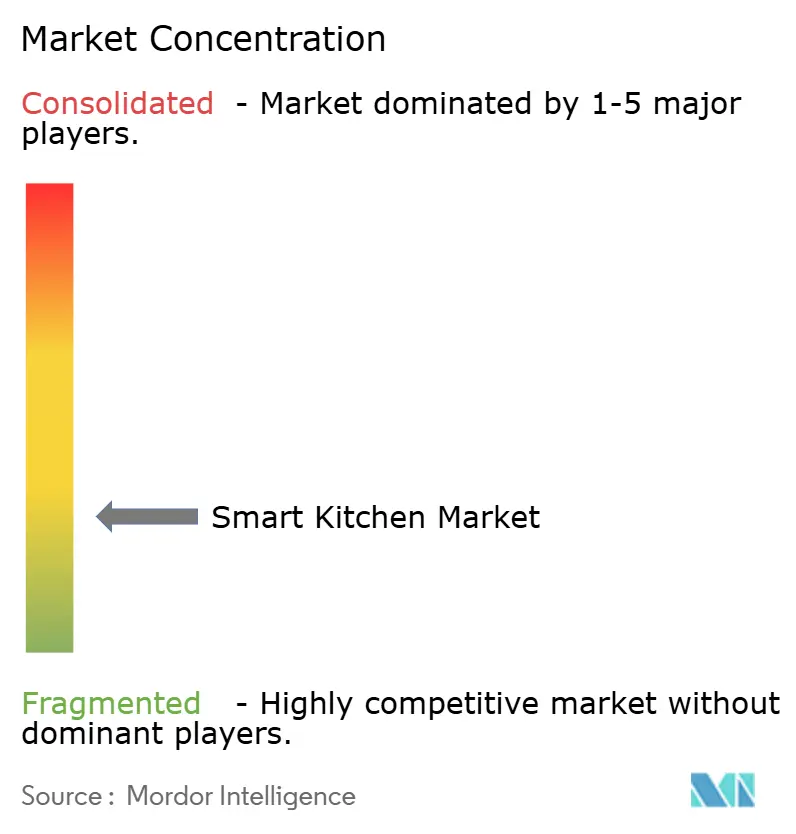
| Market Concentration | Low |
Major Players *Disclaimer: Major Players sorted in no particular order Image © Mordor Intelligence. Reuse requires attribution under CC BY 4.0. | |
Smart Kitchen Market Analysis by Mordor Intelligence
The smart kitchen market size is expected to grow from USD 21.8 billion in 2025 to USD 24.22 billion in 2026 and is forecast to reach USD 40.98 billion by 2031 at 11.09% CAGR over 2026-2031. Rapid uptake of connected cooking platforms, expanding utility rebate programs for appliance-to-grid response, and accelerating interoperability standards position connected appliances as core nodes of home energy ecosystems. North America’s mature smart-home infrastructure and California’s flexible demand appliance rules reinforce early adoption, while Asia-Pacific’s urban middle class and export-driven manufacturing base underpin the fastest regional expansion. Competitive intensity is rising as technology-first entrants pursue aggressive pricing and direct-to-consumer strategies that compress the replacement cycle. In parallel, AI-driven recipe platforms and predictive maintenance services are extending revenue streams beyond hardware, reshaping how manufacturers monetize post-sale engagement.
Key Report Takeaways
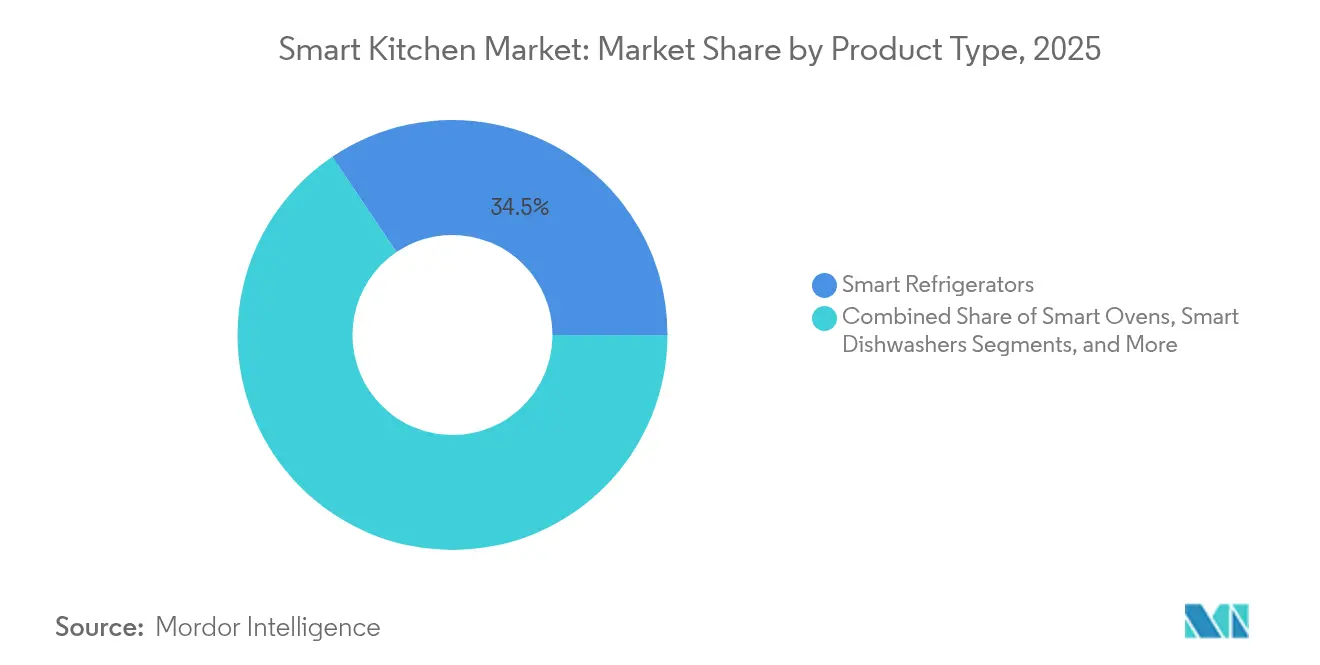
- By product type, smart refrigerators commanded 34.45% revenue share in 2025, while smart cooktops and ranges are projected to expand at 19.35% CAGR through 2031.
- By connectivity technology, Wi-Fi led with 43.65% of the smart kitchen market share in 2025; Thread/Matter protocols are forecast to grow at 18.05% CAGR through 2031.
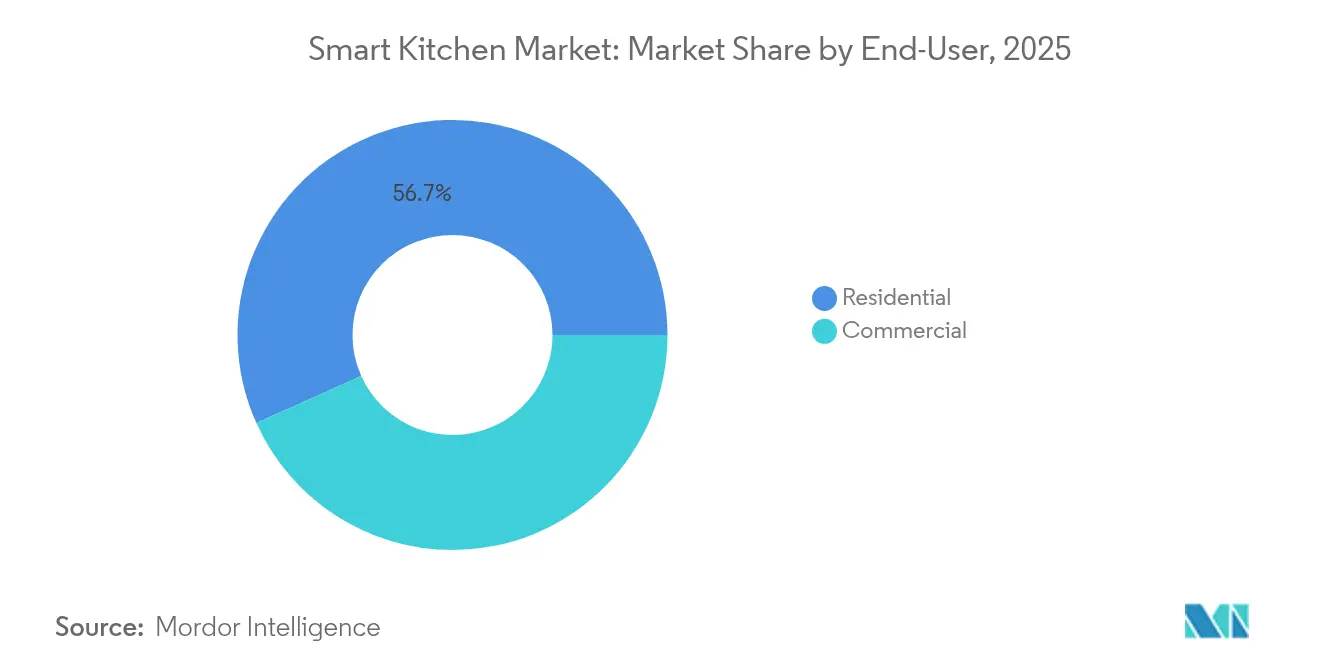
- By end-user, the residential segment held 56.72% of the smart kitchen market size in 2025, whereas hospitality applications are tracking a 14.24% CAGR to 2031.
- By distribution channel, offline retail captured 55.35% revenue share in 2025 and online sales are advancing at 17.25% CAGR through 2031.
- By region, North America retained 36.55% of global revenue in 2025; Asia-Pacific is poised for a 13.28% CAGR between 2026-2031.
Note: Market size and forecast figures in this report are generated using Mordor Intelligence’s proprietary estimation framework, updated with the latest available data and insights as of 2026.
Global Smart Kitchen Market Trends and Insights
Drivers Impact Analysis*
| Driver | (~) % Impact on CAGR Forecast | Geographic Relevance | Impact Timeline |
|---|---|---|---|
| Energy-efficient appliance mandates | +2.8% | Global, early in North America & EU | Medium term (2-4 years) |
| Rising urban single-person households | +1.9% | Core in APAC, spreading worldwide | Long term (≥ 4 years) |
| Rapid smart-home ecosystem adoption | +3.2% | North America & EU, expanding in APAC | Short term (≤ 2 years) |
| AI-driven dynamic recipe platforms | +1.4% | Global, premium-segment emphasis | Medium term (2-4 years) |
| Utility rebates for appliance-to-grid | +2.1% | North America, Australia, select EU markets | Short term (≤ 2 years) |
| Hospitality retrofits for labor-saving tech | +1.6% | Developed markets worldwide | Medium term (2-4 years) |
| Source: Mordor Intelligence | |||
Energy-efficient appliance mandates
Stricter energy rules are redefining product roadmaps and service models. The U.S. Department of Energy’s 2028 cooking-product standard limits annual energy use and bans linear power supplies, unlocking savings equal to 1.4 million homes’ yearly consumption.[1]U.S. Department of Energy, “Consumer Conventional Cooking Products,” energy.gov EU legislation now obliges manufacturers to stock refrigerator parts for 7 years and dishwasher parts for 10 years, encouraging modular designs and aftermarket revenues.[2]European Consumers Centre, “Spare Parts and Repairs: A Right in Europe?,” europe-consommateurs.eu Australia’s modernization of Greenhouse and Energy Minimum Standards forecasts AUD 3.4 billion in consumer savings from efficient electric appliances. These policies push suppliers to embed adaptive load-control software that aligns appliance cycles with grid signals, giving first movers a measurable efficiency edge.
Rapid smart-home ecosystem adoption
Interoperability is moving from nice-to-have to mandatory. Thread Group passed 200 members and 670 product certifications in early-2025. Matter 1.4 adds multi-admin control and energy-data schemas that let cooktops, ovens, and water heaters share load profiles with energy-management apps. The Home Connectivity Alliance, led by Samsung, LG, Haier, and Electrolux, rolled out an Energy Management Interface to bring smart appliances into utility demand programs. Vendors lacking platform alliances face higher R&D outlays and slower market entry, tilting competitive balance toward firms that embrace open standards.
AI-driven dynamic recipe platforms
Appliances are evolving into culinary assistants that anticipate user intent. LG’s second-generation SIGNATURE range uses Gourmet AI to adjust cooking based on food weight and type. Samsung’s Bespoke Family Hub refrigerator tracks inventory with AI cameras and suggests meal plans that cut waste. In commercial kitchens, Aniai’s Alpha Cloud inspects burger patties in real time, underlining AI’s role in quality assurance. By converging inventory data, dietary goals, and utility tariffs, next-generation platforms promise hyper-personalized meal preparation.
Utility rebates for appliance-to-grid response
Grid-interactive appliances unlock two-sided value by trimming bills and earning demand-response incentives. California’s Senate Bill 49 requires grid-ready load management and cybersecurity for qualifying devices. PNNL models suggest embedding demand-response in residential codes could save USD 100-200 billion in U.S. power-system costs over 20 years and cut CO₂ emissions 6% annually by 2030.[3]Pacific Northwest National Laboratory, “Demand Response in Residential Energy Code,” energycodes.gov Berkeley Lab notes buildings already consume 75% of U.S. electricity, so appliance flexibility is pivotal for renewable integration. Manufacturers able to certify secure, grid-responsive products gain access to lucrative utility incentive pools.
Restraints Impact Analysis*
| Restraint | (~) % Impact on CAGR Forecast | Geographic Relevance | Impact Timeline |
|---|---|---|---|
| High upfront purchase price | −2.3% | Worldwide, but especially in price-sensitive markets | Short term (next 2 years) |
| Data-privacy & cyber-security risks | −1.8% | Europe, North America, and other mature economies | Medium term (2–4 years) |
| Patchwork of connectivity standards | −1.5% | Global, hitting multi-brand households hardest | Medium term (2–4 years) |
| Limited lithium-ion supply for smart-battery units | −1.2% | Global, with sharper effects on battery-heavy appliances | Long term (4 years and beyond) |
| Source: Mordor Intelligence | |||
High upfront purchase price
Component inflation and tariffs elevate retail tags. Semiconductor revenue jumped 21% in 2024 and is on track to hit USD 1 trillion by 2029, cascading into appliance bill-of-materials costs. U.S. tariffs slashed washer imports 49% and pushed prices more than 10%, with new rounds projected to hike tags by up to 31%. China’s small-appliance market slipped 9.6% in 2023 and 0.8% in 2024, illustrating demand elasticity in cost-conscious segments. Brands counteract sticker shock by bundling financing and subscription options, but mass-market penetration still hinges on cheaper SKUs.
Data-privacy & cyber-security risks
The proliferation of Wi-Fi, Thread, and Matter endpoints exposes appliances to more attack vectors. Matter mitigates some risks via local control and end-to-end encryption, yet multivendor patch coordination remains complex. EU data-protection statutes and California privacy laws amplify compliance burdens. The U.S. Quadrennial Supply Chain Review singles out connected devices as critical-infrastructure risks, prompting calls for security-by-design certification.[4]U.S. Department of Commerce, “2021–2024 Quadrennial Supply Chain Review,” trade.gov Firms must invest in hardened firmware, over-the-air patching, and transparent data policies to maintain consumer trust.
*Our forecasts treat driver/restraint impacts as directional, not additive. The impact forecasts reflect baseline growth, mix effects, and variable interactions.
Segment Analysis
By Product Type: Refrigerators Lead Innovation Integration
Smart refrigerators retained 34.45% revenue share in 2025 and anchor the smart kitchen market as household information hubs. LG’s T-OLED French Door model blends AI cameras with inventory tracking, positioning the appliance as a service gateway. Yet smart cooktops and ranges are forecast to post 19.35% CAGR through 2031, boosted by hospitality retrofits that seek labor savings and precision cooking. The National Restaurant Association recognized AI-driven combi ovens that cut training time and energy use, illustrating cross-pollination from commercial to residential.
Smart dishwashers benefit from stringent water-efficiency mandates, while coffee makers and range hoods represent emerging niches for specialty vendors. The convergence of recipe platforms and cooking surfaces expands the addressable smart kitchen market, driving hardware-software bundling. Serviceable design and mandated spare-parts availability extend lifecycles yet open recurring revenue in maintenance. Meanwhile, premium segments sustain USD 667 rice cookers in Japan, even as middle-tier devices face price pressure. Balanced portfolios spanning entry to flagship SKUs are therefore vital for volume and margin.


By Connectivity Technology: Thread/Matter Disrupts Wi-Fi Dominance
Wi-Fi captured 43.65% of 2025 revenue, leveraging ubiquitous routers and app familiarity. However, Thread/Matter solutions are projected to expand at 18.05% CAGR, challenging Wi-Fi’s hold by offering low-power mesh and standardized commissioning. Over 200 Thread Group members have cleared 670 certifications, underscoring ecosystem momentum.
Matter 1.4’s energy-management schema lets appliances broadcast real-time load data, meeting utilities’ demand-response integration criteria. For manufacturers, embracing Matter shortens integration cycles with major home platforms, trimming custom-app costs. Bluetooth, NFC, and ZigBee/Z-Wave remain in legacy or proximity-pairing roles, while proprietary stacks risk stranded-asset status as interoperability expectations solidify.
By End-User: Hospitality Drives Commercial Acceleration
Residential buyers produced 56.72% of 2025 revenue, but hospitality kitchens are on a 14.24% CAGR trajectory, reshaping commercial demand. Hotels and QSR chains adopt AI cooking robots that extend service hours and standardize quality, aligning with the USD 8 billion AI-in-hospitality opportunity by 2033.
Restaurants deploy inventory-linked ovens and energy-aware dishwashers to boost margins amid labor shortages and rising utility costs. Outside foodservice, institutions such as hospitals and universities pilot connected meal-prep stations for nutrition tracking and waste reduction. Vendors that tailor durability, hygiene compliance, and remote-diagnostics features capture premium ASPs and longer service contracts.
By Distribution Channel: Direct-to-Consumer Reshapes Retail
Offline channels held 55.35% revenue share in 2025, and online sales are growing 17.25% annually as brands bypass intermediaries. LG’s subscription program generated USD 850 million in 2023, signaling appetite for service-wrapped hardware. First-party e-commerce yields richer usage data that informs iterative software updates and cross-sell strategies.
Brick-and-mortar outlets still attract shoppers seeking live demos and installation support; Best Buy’s omnichannel model showcases this hybrid approach q4cdn.com. Builder and contractor sales secure bulk placements in new housing, underscoring the importance of B2B relationships even as consumer journeys digitize.
Geography Analysis
North America generated 36.55% of global revenue in 2025 thanks to California’s grid-responsive standards and established rebate programs, while federal cooking-appliance rules taking effect in 2028 offer regulatory certainty. Canada mirrors the U.S. path with nationwide energy-efficiency codes and smart-grid pilots. Tariff proposals could raise U.S. appliance prices up to 31%, potentially tempering volume growth.
Asia-Pacific is the fastest-growing region at a 13.28% CAGR to 2031, propelled by urbanization and export-oriented manufacturing. Xiaomi doubled appliance shipments year-on-year in Q1 2025, intensifying rivalry with Midea and Haier. Haier Smart Home’s CNY 79.12 billion March-2025 revenue demonstrates overseas diversification, with 60% of sales now offshore. Japan’s stagnant domestic market pushes local brands toward premium SKUs and regional expansion, while South Korea’s semiconductor edge strengthens in-house component supply. India and ASEAN-5 markets gain momentum from rising disposable incomes and electrification drives.
Europe benefits from right-to-repair mandates that require up to 10-year parts availability, fostering sustainable design and aftermarket services. Poland’s appliance revenue hit 51 billion PLN in 2023, and household smart-appliance penetration should reach 10% by 2025. Germany, the United Kingdom, France, Italy, and Spain anchor mature demand, while the European Chips Act targets 20% global semiconductor share by 2030, cushioning supply risks. Middle East and Africa represent nascent but rising opportunities tethered to infrastructure upgrades and hotel pipeline growth.

Competitive Landscape
Competitive intensity is moderate as legacy appliance giants defend share against digitally native challengers. Samsung’s DX Division booked KRW 1,748,877 billion revenue in 2024, powering AI-infused Bespoke lines. LG Electronics posted an all-time-high KRW 87.73 trillion in 2024 revenue, with its Home Appliance & Air Solution unit contributing KRW 33.2 trillion and subscription revenue up 75%. Midea Group’s Q1 2025 turnover of RMB 128.4 billion and 38% profit growth underscore Chinese innovators’ scale advantages.
The Home Connectivity Alliance, comprising Samsung, LG, Haier, Electrolux, and Frigidaire, advances shared energy APIs, whereas Whirlpool and Bosch remain outside the consortium, carving independent pathways. Thread certification-now at 670 products-serves as a credibility marker, and early Matter adoption lets smaller brands achieve equal footing on interoperability. White-space prospects emerge in commercial automation, energy-storage pairings, and subscription models that smooth hardware demand cycles.
Smart Kitchen Industry Leaders
Electrolux
LG Electronics
Samsung Electronics
Haier Inc. (GE Appliances)
Whirlpool Corporation
- *Disclaimer: Major Players sorted in no particular order

Recent Industry Developments
- January 2025: LG unveiled its second-generation LG SIGNATURE lineup at CES 2025, featuring the T-OLED refrigerator and the Gourmet AI range.
- January 2025: LG confirmed KRW 87.73 trillion 2024 revenue and 75% subscription-business growth.
- November 2024: Matter 1.4 specification introduced multi-admin control and expanded energy-management support.
- June 2024: Bosch considered an offer for Whirlpool, signaling potential consolidation.


Research Methodology Framework and Report Scope
Market Definitions and Key Coverage
Our study defines the smart kitchen market as revenue generated from connected, sensor-enabled kitchen appliances, including refrigerators, ovens, dishwashers, cooktops, hoods, coffee makers, and ancillary gadgets that ship with embedded Wi-Fi, Bluetooth, or emerging Matter/Thread protocols and are controllable via mobile apps or voice assistants. Values reflect factory-gate prices converted to constant 2025 USD.
Scope exclusion: We exclude standalone smart plugs, aftermarket add-on modules, and broader smart-home hubs.
Segmentation Overview
- By Product Type
- Smart Refrigerators
- Smart Ovens
- Smart Dishwashers
- Smart Cooktops & Ranges
- Smart Coffee Makers
- Smart Range Hoods
- Other Product Types
- By Connectivity Technology
- Wi-Fi
- Bluetooth
- NFC
- ZigBee / Z-Wave
- Thread & Matter
- Other Technologies
- By End-User
- Residential
- Commercial
- Hospitality (Hotels, QSRs)
- Restaurants & Catering
- Others (Institutions, Offices)
- By Distribution Channel
- Online Retail (E-commerce, DTC)
- Offline Retail
- Specialty Appliance Stores
- Mass Merchandisers
- Builder / Contractor Sales
- By Geography
- North America
- United States
- Canada
- Mexico
- South America
- Brazil
- Argentina
- Rest of South America
- Europe
- Germany
- United Kingdom
- France
- Italy
- Spain
- Russia
- Rest of Europe
- Asia-Pacific
- China
- Japan
- South Korea
- India
- ASEAN-5
- Australia and New Zealand
- Rest of Asia-Pacific
- Middle East
- Israel
- Saudi Arabia
- United Arab Emirates
- Turkey
- Rest of Middle East
- Africa
- South Africa
- Egypt
- Rest of Africa
- North America
Detailed Research Methodology and Data Validation
Primary Research
Mordor analysts interviewed appliance OEM engineers, component suppliers, large retail buyers, and kitchen installers across North America, Europe, and Asia Pacific. These discussions clarified real-world uptake of Matter firmware, dealer mark-ups, and post-warranty service income, which in turn guided price and replacement-cycle assumptions.
Desk Research
We began with energy-label shipment files from the US Department of Energy, Eurostat PRODCOM, and China Customs, which help us trace annual unit flows. Trade association briefs, such as the Association of Home Appliance Manufacturers, the European Committee of Domestic Equipment Manufacturers, and Korea's KITA, offer penetration clues by product class. Consumer electronics spend pulled from World Bank household final consumption tables provides macro context, and patent analytics accessed through Questel flags technology diffusion patterns. D&B Hoovers snapshots round out maker revenue lines that anchor average selling prices. The sources cited here are illustrative; many additional public and subscription datasets supported validation.
Market-Sizing & Forecasting
We deploy a top-down build that reconciles connected-home adoption rates with kitchen-appliance replacement pools, then cross-check it with selective bottom-up estimates drawn from sampled manufacturer shipments and retail scans. Key variables include: installed base of smart homes, annual kitchen renovation permits, average selling price by appliance class, energy-efficiency label mix, and regional disposable income per household. A multivariate regression projects each driver through 2030; coefficients are stress-tested with scenario views shared by primary experts. Gaps that appear when bottom-up totals deviate beyond three percent prompt a loop-back interview or a re-cut of customs data before finalization.
Data Validation & Update Cycle
Every draft model flows through a two-step peer review, followed by anomaly screening where outputs are compared against independent shipment tallies and quarterly earnings. Reports refresh annually, and we push interim updates if tariff shifts, chipset shortages, or major protocol launches alter the demand curve. Before release, a fresh analyst pass ensures the latest events are captured.
Why Our Smart Kitchen Baseline Commands Reliability
Published estimates often diverge because providers slice the market differently and apply varied price stacks.
Key gap drivers include product scope, as some tally only large built-ins, the treatment of internet-enabled small gadgets, and currency conversions that ignore mid-year swings. Mordor Intelligence applies a consistent appliance roster, reconciles list and transaction prices, and reruns models whenever new shipment filings emerge, which keeps our 2025 baseline balanced and reproducible.
Benchmark comparison
| Market Size | Anonymized source | Primary gap driver |
|---|---|---|
| USD 21.80 B (2025) | Mordor Intelligence | - |
| USD 22.36 B (2024) | Regional Consultancy A | Counts only large built-in appliances and inflates value with retail mark-ups |
| USD 20.94 B (2024) | Trade Journal B | Omits smart coffee makers and air-fry ovens; uses ex-factory Asian prices globally |
| USD 36.59 B (2024) | Global Consultancy C | Blends all smart-home devices, then allocates a kitchen share via consumer surveys |
These comparisons show that when scope alignment and timely price normalization are lacking, totals swing widely. The disciplined, update-ready approach we follow offers decision-makers a dependable starting point.


Key Questions Answered in the Report
What is the current size of the smart kitchen market?
The smart kitchen market was valued at USD 24.22 billion in 2026 and is projected to reach USD 40.98 billion by 2031.
Which region is growing fastest for smart kitchen appliances?
Asia-Pacific is forecast to grow at a 13.28% CAGR from 2026-2031 due to urbanization, export-oriented production, and rising disposable incomes.
Who are the key players in Smart Kitchen Market?
Electrolux, LG Electronics, Samsung Electronics, Haier Inc. (GE Appliances) and Whirlpool Corporation are the major companies operating in the Smart Kitchen Market.
Which product segment is expanding quickest?
Smart cooktops and ranges are expected to post a 19.35% CAGR through 2031, outpacing all other product categories.
How are new connectivity standards affecting the market?
Thread/Matter protocols, growing at 18.05% CAGR, improve interoperability, reduce setup friction, and enable energy-management features that utilities reward.
Why are utility rebates important for the smart kitchen market?
Rebate programs incentivize grid-interactive appliances, lowering end-user costs and opening new revenue channels for manufacturers through demand-response participation.
Page last updated on:


