Smart Retail Market Size and Share
Market Overview
| Study Period | 2020 - 2031 |
|---|---|
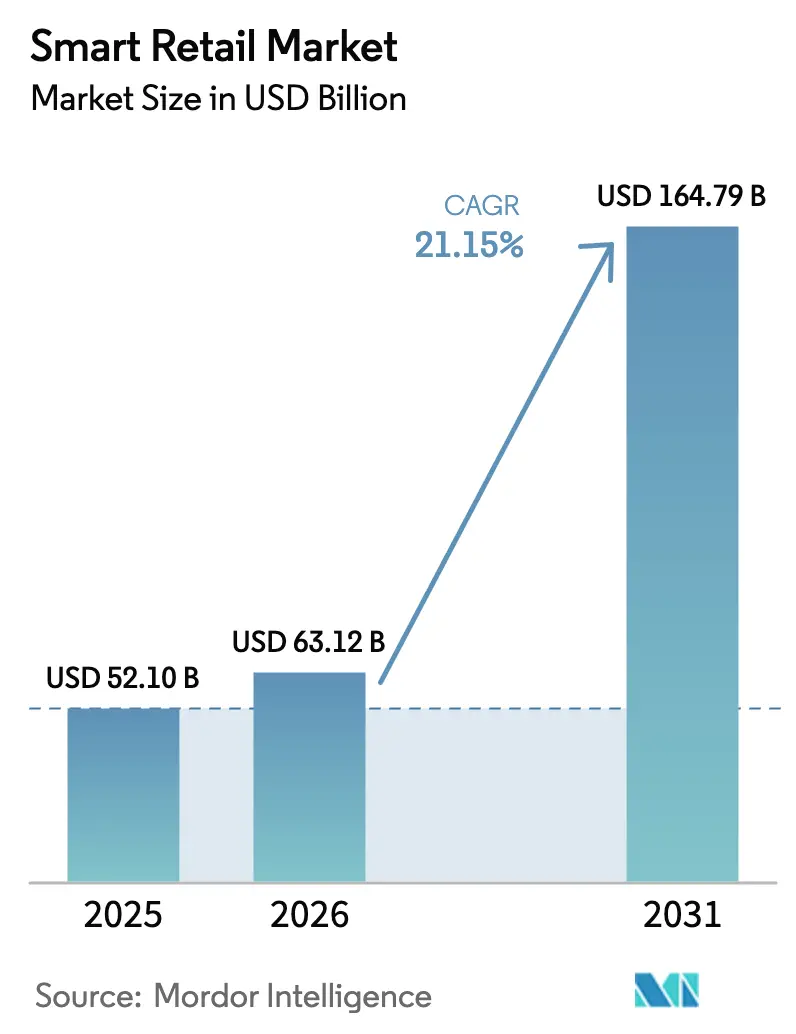
| Market Size (2026) | USD 63.12 Billion |
| Market Size (2031) | USD 164.79 Billion |
| Growth Rate (2026 - 2031) | 21.15% CAGR |
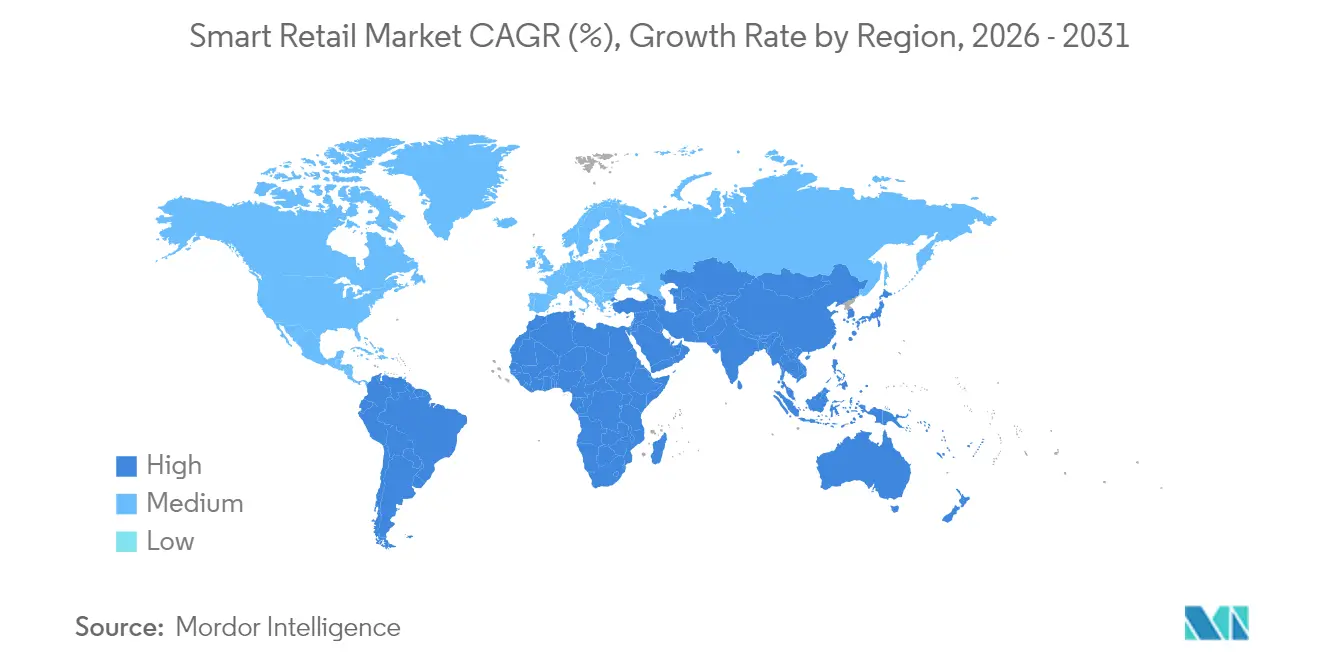
| Fastest Growing Market | Asia Pacific |
| Largest Market | North America |
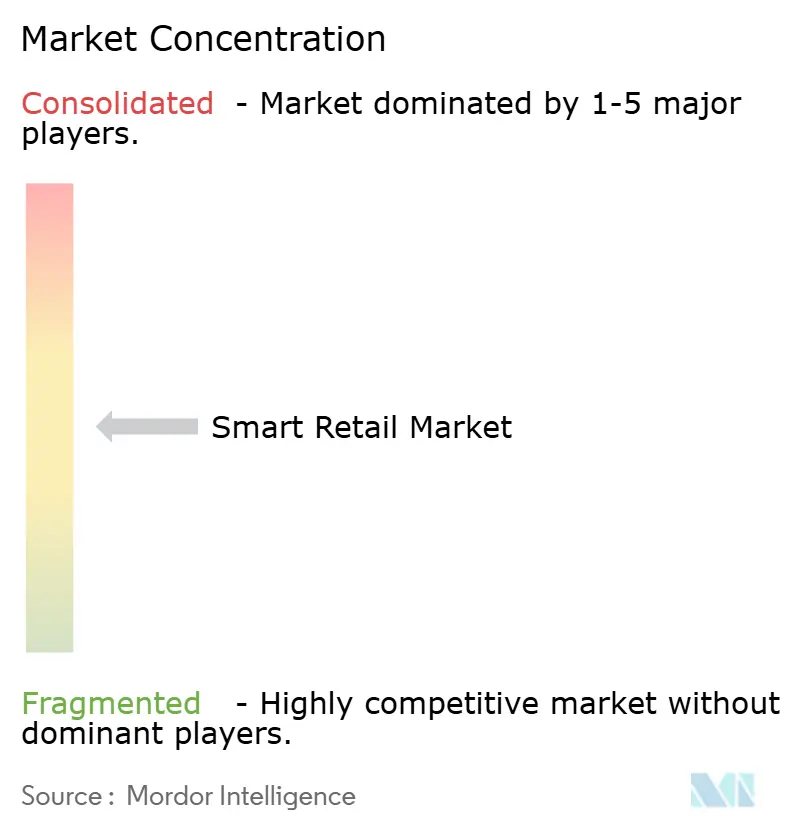
| Market Concentration | Medium |
Major Players *Disclaimer: Major Players sorted in no particular order Image © Mordor Intelligence. Reuse requires attribution under CC BY 4.0. | |
Smart Retail Market Analysis by Mordor Intelligence
The smart retail market size is expected to grow from USD 52.1 billion in 2025 to USD 63.12 billion in 2026 and is forecast to reach USD 164.79 billion by 2031 at 21.15% CAGR over 2026-2031. Growth stems from retailers’ urgency to remove manual frictions, compress operating costs, and monetize in-store data as cashierless checkout, edge AI, and retail media screens graduate from pilot scale to network rollouts. North American chains maintained the momentum by deploying more than 750,000 robots across fulfillment hubs, while the Asia-Pacific region’s convenience and unmanned-cabinet formats accelerated adoption on the back of mobile-first shoppers and state digitalization incentives. Hardware still accounts for the largest revenue slice; however, services are rising fastest as managed IoT and subscription analytics overtake one-off device sales. Competitive pressure remains moderate because hyperscalers can bundle cloud, AI, and payments, yet specialized firms thrive by focusing on narrow pain points, such as computer vision checkout or electronic shelf labels.
Key Report Takeaways
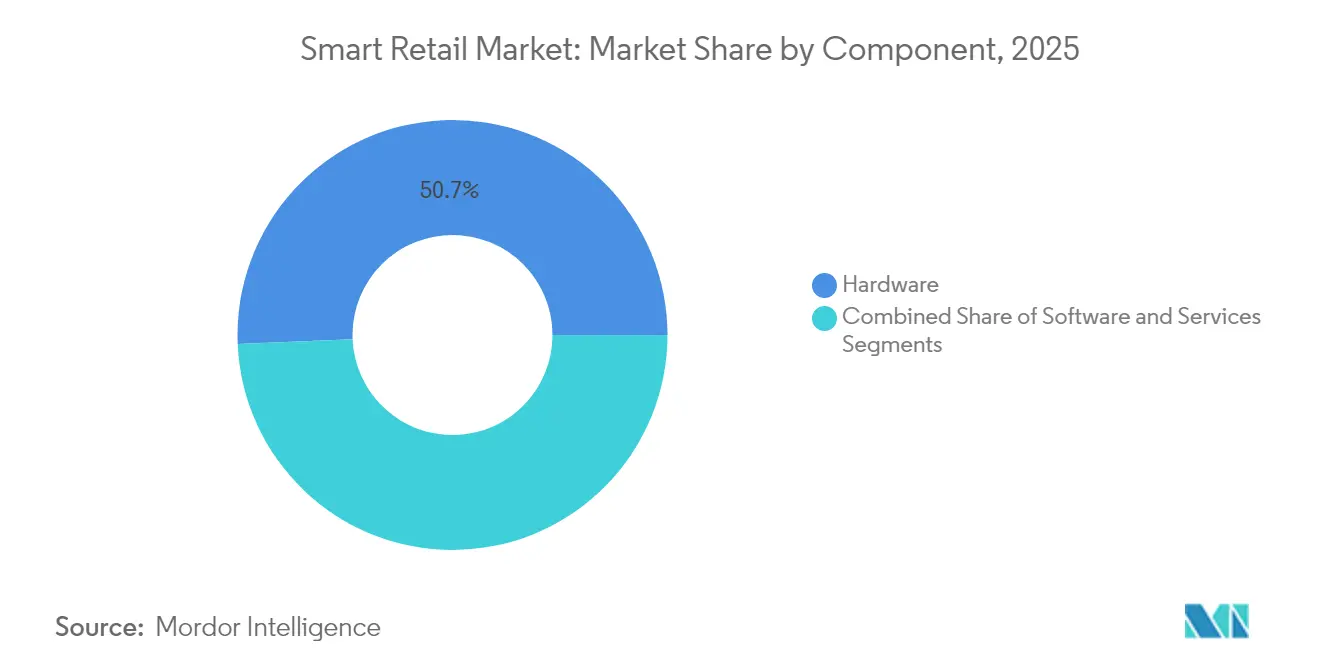
- By component, hardware accounted for 50.67% of the smart retail market share in 2025, while the services segment is expanding rapidly with a 28.32% CAGR projected through 2031.
- By application, foot-traffic monitoring led the market with 22.14% in 2025; predictive equipment maintenance is set to grow the fastest at a 24.69% CAGR through 2031.
- By technology, AI and machine learning contributed 33.25% of market revenue in 2025, while robotics and automation is the fastest-growing segment at a 29.85% CAGR through 2031.
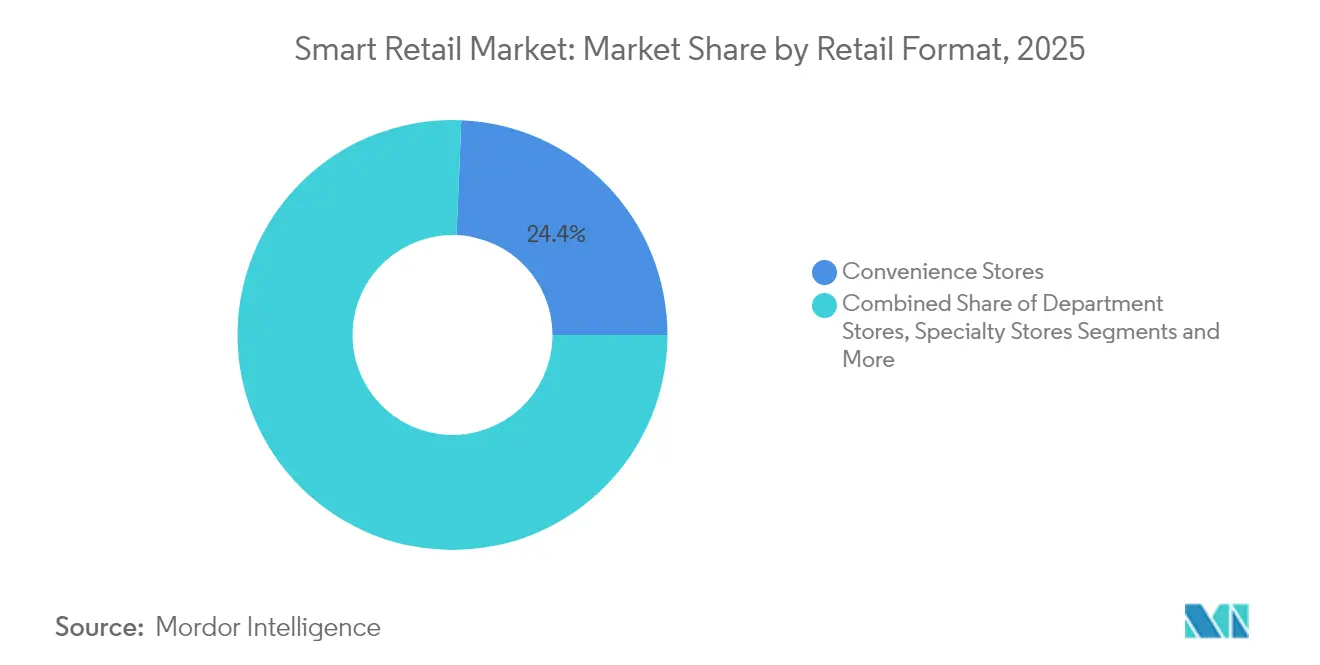
- By retail format, convenience stores held 24.35% of the market in 2025, with e-commerce fulfilment centres forecasted to rise at a 23.22% CAGR by 2031.
- By deployment mode, cloud-based solutions dominated the market with a 37.62% market share in 2025 and are projected to grow at a 26.91% CAGR by 2031.
- By geography, North America led with 31.35% of the market share in 2025, while Asia-Pacific is set to witness the fastest growth at a 24.78% CAGR through 2031.
Note: Market size and forecast figures in this report are generated using Mordor Intelligence’s proprietary estimation framework, updated with the latest available data and insights as of 2026.
Global Smart Retail Market Trends and Insights
Drivers Impact Analysis*
| Driver | (~) % Impact on CAGR Forecast | Geographic Relevance | Impact Timeline |
|---|---|---|---|
| Growing investments in retail chains and supermarkets | +3.2% | Global (North America and APAC focus) | Medium term (2–4 years) |
| Rising adoption of AI/IoT and advanced analytics | +4.1% | Global (developed markets lead) | Short term (≤ 2 years) |
| Surge in cashier-less / friction-less checkout roll-outs | +2.8% | North America and Europe, expanding to APAC | Medium term (2–4 years) |
| Retail-media networks unlocking in-store ad revenue | +2.3% | Primarily North America and Europe | Long term (≥ 4 years) |
| Edge-computing cost declines enabling real-time shelf monitoring | +3.5% | Global | Short term (≤ 2 years) |
| Government incentives for SMB digitalisation in emerging markets | +2.9% | APAC, Eastern Europe, Latin America | Long term (≥ 4 years) |
| Source: Mordor Intelligence | |||
Growing Investments in Retail Chains and Supermarkets
Retail chains direct larger shares of capex to smart-store infrastructure. Circle K’s API-driven “Information Superhighway” lets the group pilot new modules alongside legacy systems, and Sheetz now orchestrates 60 connected devices per site handling 1.81 million daily transactions. Chinese operator Meiyijia pairs Huawei Cloud with HarmonyOS so store managers access AI-driven planogram alerts and shrinkage dashboards. The result is tighter inventory turns, lower labour costs, and granular shopper analytics that feed loyalty programmes.[1]Circle K via CSP Daily News, “Technology in the C-Store,” cspdailynews.com
Rising Adoption of AI/IoT and Advanced Analytics
Eight in ten retailers expect to embed IoT by end-2024 after proving 23.4% efficiency lifts and 25.6% shrinkage reduction. Edge AI cameras cut average checkout time by 30%, while Microsoft’s partnerships with Coles and Unilever illustrate how cloud inferencing improves on-shelf availability and targeted promotions. Global edge-computing spend hit USD 232 billion in 2024, and three-quarters of enterprise data will originate outside data-centres by 2025, reshaping store-level analytics workflows.[2]Bank Info Security, “Edge Computing Breakout Year,” bankinfosecurity.com
Surge in Cashier-less / Friction-less Checkout Roll-outs
Autonomous checkout shifted from novelty to commercial scale: Walmart’s AI-enabled lanes trim inventory loss 15%, Sam’s Club Scan and Go lifts basket size 27%, and Kroger smart carts push transaction value 12%. Yet Amazon’s decision to retire Just Walk Out in Fresh supermarkets underscores format-specific friction. Smaller convenience units and specialty stores continue to register faster uptake thanks to fewer SKUs and simpler produce handling.
Retail-Media Networks Unlocking In-Store Ad Revenue
Retailers transform floor space into programmatic ad surfaces. CVS Media Exchange monetises end-caps and self-checkout screens, while Criteo’s platform now traces USD 1 trillion commerce transactions, projecting retail-media spend to surge past USD 204 billion by 2027. Digital screens and smart shelves serve dynamic campaigns based on dwell-time analytics, creating a parallel income stream without expanding square footage.
Restraints Impact Analysis*
| Restraint | (~) % Impact on CAGR Forecast | Geographic Relevance | Impact Timeline |
|---|---|---|---|
| Limited legacy infrastructure in developing nations | -2.1% | APAC, Africa, Latin America | Long term (≥ 4 years) |
| Data-security and privacy compliance hurdles | -1.8% | Europe and North America focus | Medium term (2–4 years) |
| Interoperability challenges across fragmented vendor stack | -1.4% | Global | Short term (≤ 2 years) |
| Rising energy costs for always-on IoT devices | -1.2% | Global | Medium term (2–4 years) |
| Source: Mordor Intelligence | |||
Limited Legacy Infrastructure in Developing Nations
Broadband gaps, unstable power, and scarce service ecosystems keep deployment costs elevated. Only 57% of small firms in Eastern Partner economies operate a website versus 84% of large peers, underscoring the readiness divide. Retailers often depend on cash registers and paper logs, raising migration complexity when shifting to RFID or edge AI.
Data-Security and Privacy Compliance Hurdles
After 12 September 2025, the EU Data Act lets consumers reclaim device-generated data, compelling retailers to engineer consent dashboards, encryption, and audit trails. GDPR, CCPA, and sector-specific mandates widen the compliance burden, particularly for SMBs lacking dedicated legal teams. Multinational chains respond by ring-fencing EU data within regional cloud zones and doubling cybersecurity budgets.
*Our forecasts treat driver/restraint impacts as directional, not additive. The impact forecasts reflect baseline growth, mix effects, and variable interactions.
Segment Analysis
By Component: Hardware Dominance Meets Services Acceleration
Hardware contributed 50.67% smart retail market revenue in 2025 as IoT sensors, smart displays, and edge gateways drive first-wave investment. The services arm, however, delivers a 28.32% CAGR because retailers are gravitating toward managed IoT subscriptions, analytics platforms, and 24/7 support that reduce internal IT load. Amazon’s 750,000-robot infrastructure demonstrates the scale of hardware, yet its AWS retail stack confirms the shift in margins toward services.


By Application: Foot-Traffic Monitoring Leads While Predictive Maintenance Surges
Foot-traffic monitoring led with 22.14% share in 2025, giving merchants real-time insights on dwell zones and staffing. Predictive maintenance is the fastest climber at 24.69% CAGR as robotics-heavy fulfilment centres depend on sensor-fed algorithms that flag component fatigue before breakdown.
By Technology: AI Leadership Challenged by Robotics Momentum
AI/ML remained the anchor at 33.25% share, underpinning demand forecasting and personalised offers. Robotics rises at 29.85% CAGR propelled by labour shortages and fulfilment speed targets; cobots dominate pallet moves while articulated arms handle single-sku picks.
By Retail Format: Convenience Stores Excel While E-commerce Centers Accelerate
Convenience outlets accounted for 24.35% revenue in 2025, leveraging compact layouts that simplify sensor grids and deliver clear ROI. Chinese stores adding AI remote monitoring increase takings by 400 yuan per day. Fulfillment centres outpace all others with a 23.22% CAGR, aligning with e-commerce parcel growth and tighter delivery windows.
By Deployment Mode: Cloud Dominance Accelerates
Cloud setups captured 37.62% revenue and compound at 26.91% on the back of pay-as-you-use economics and instant model updates. Hybrid architectures follow as chains place privacy-sensitive workloads on-premises while bursting peak analytics to the cloud.
Geography Analysis
North America retained 31.35% smart retail technology market revenue in 2025 thanks to multibillion-dollar automation budgets and high consumer tolerance for tech-aided shopping. Amazon alone invested USD 87.01 billion in R&D and now fields nine robotic families across fulfilment, shaving 25% off unit costs during peak seasons. Walmart, Kroger, and Target each push AI-checkout pilots that lower shrink and lift satisfaction scores, encouraged by venture ecosystems funding computer-vision specialists.
Asia-Pacific posts the swiftest 24.78% CAGR, spearheaded by China’s unmanned-cabinet sector on track for 2 trillion yuan turnover by 2025 and reach to 250 million consumers. Huawei Cloud and local integrators such as Cloudpick export turnkey AI-store kits abroad, while Society 5.0 and ASEAN Digital Masterplan grants widen funding for SME tech upgrades.
Europe balances opportunity with compliance cost. The EU Data Act and energy-price volatility spur demand for edge-processing that limits outbound data traffic and optimises refrigeration loads. Eastern European programmes co-fund IoT pilots for micro-retail yet physical infrastructure deficiencies still curb roll-outs relative to Western peers. Latin America and the Middle East and Africa witness rising proof-of-concepts fuelled by telecom 5G build-outs, but sustained capex will hinge on power-grid stability and harmonised privacy codes.

Competitive Landscape
Market concentration is moderate as cloud hyperscalers, large POS vendors, and emerging niche players coexist. Amazon extends from AWS SaaS modules to proprietary robotics, creating end-to-end propositions, whereas Microsoft underpins Coles and Unilever with Azure AI and synthetic-data pipelines that personalise promotions. Google’s Vertex AI and Cloud Retail Search appeal to omnichannel brands seeking incremental conversion gains.
Specialists fortify white-space niches: Grabango patents high-fidelity environmental maps for ceiling-mounted cameras, SES-imagotag pushes battery-free electronic shelf labels, and Sensei targets medium-box supermarkets with GDPR-compliant virtual baskets. Partnerships flourish as payment acquirers bundle POS IoT, while telcos bundle edge compute to tame interoperability pain points. Patent filings cluster around RFID, smart-shelf load cells, and real-time vision inference, indicating sustained innovation and potential IP litigation as adoption scales.
Smart Retail Industry Leaders
Google LLC
Intel Corporation
IBM Corporation
Cisco Systems, Inc.
Amazon.com, Inc.
- *Disclaimer: Major Players sorted in no particular order

Recent Industry Developments
- May 2025: Amazon opened its fourth robotic fulfilment centre in Virginia, a 3.1-million-sq-ft site that cuts order cycle time 25% and lowers peak-season unit service cost 25%.
- April 2025: Axis Communications’ Partner Summit 2025 showcased IoT-enabled video analytics tailored for retail, reinforcing its Latin America go-to-market.
- April 2025: Flagship, Vypr, and Markmi raised a combined USD 9 million to scale visual-merchandising SaaS, shopper-insight platforms, and AI markdown solutions.
- March 2025: Amazon Robotics deployed eight robot families at Shreveport, logging 25% productivity uplift via AI-directed task orchestration.


Research Methodology Framework and Report Scope
Market Definitions and Key Coverage
Our study tracks global revenue generated when brick-and-mortar retailers deploy hardware, software, or managed services that embed IoT sensors, AI/ML analytics, computer-vision cameras, RFID, or edge-to-cloud platforms for tasks such as inventory sensing, cashier-less checkout, dynamic pricing, and in-store media; all figures are expressed in current-year USD.
Scope exclusion: Pure-play e-commerce platforms and back-office ERP tools that are not tethered to in-store processes are kept outside the smart retail universe.
Segmentation Overview
- By Component
- Hardware
- Software
- Services
- By Application
- Inventory Management
- Brand Protection
- Foot-Traffic Monitoring
- Customer Loyalty and Payments
- Predictive Equipment Maintenance
- Smart Shelves / Planogram Compliance
- Augmented-Reality Assisted Shopping
- Others
- By Technology
- Internet of Things (IoT)
- Artificial Intelligence and Machine Learning
- Robotics and Automation
- Augmented / Virtual Reality
- Cloud and Edge Computing
- Big-Data and Analytics
- By Retail Format
- Hypermarkets and Supermarkets
- Convenience Stores
- Department Stores
- Specialty Stores
- E-commerce Fulfilment Centres
- By Deployment Mode
- On-Premises
- Cloud
- Hybrid
- By Geography
- North America
- United States
- Canada
- Mexico
- South America
- Brazil
- Argentina
- Rest of South America
- Europe
- United Kingdom
- Germany
- France
- Italy
- Spain
- Russia
- Rest of Europe
- Asia-Pacific
- China
- India
- Japan
- South Korea
- Australia and New Zealand
- Southeast Asia
- Rest of Asia-Pacific
- Middle East and Africa
- Middle East
- GCC
- Turkey
- Rest of Middle East
- Africa
- South Africa
- Nigeria
- Rest of Africa
- Middle East
- North America
Detailed Research Methodology and Data Validation
Primary Research
Mordor analysts interviewed store-operations heads, systems integrators, and retail-tech product managers across North America, Europe, Asia-Pacific, and the Gulf. Conversations validated unit economics for smart shelves, clarified realistic deployment lead times, and pressure-tested model assumptions on service attach rates and support contracts.
Desk Research
We begin with structured reviews of freely available tier-1 repositories such as UN Comtrade trade codes for RFID modules, International Telecommunication Union statistics on connected-device density, Eurostat retail turnover dashboards, US Census Monthly Retail Trade data, and white papers from bodies such as GS1, the National Retail Federation, and the OECD digital-tax reports. Corporate 10-Ks, investor decks, and patent analytics harvested via Questel enrich the technology adoption timeline.
Subscription databases including Dow Jones Factiva for deal flow and D&B Hoovers for vendor financials help us map competitive footprints and filter anecdotal press claims. This list is illustrative, not exhaustive; many other open data sets underpin the desk analysis.
Market-Sizing & Forecasting
A top-down reconstruction starts with regional modern-retail sales, aligns them to smart-retail addressable footprints using penetration ratios for connected PoS lanes, ESL-equipped aisles, and AI camera deployments, and is then cross-checked with sampled bottom-up estimates (supplier roll-ups and average selling price x installed-base slices).
Key variables include: 1) average smart-device spend per square meter of store area, 2) share of stores adopting computer-vision checkout, 3) cloud-edge bandwidth pricing curves, 4) regional labor-cost inflation influencing automation ROIs, and 5) regulatory shifts such as EU Data Act compliance costs.
Multivariate regression with scenario overlays models the 2025-2030 trajectory. Where bottom-up gaps surface, interim ratios are interpolated from primary-research guardrails.
Data Validation & Update Cycle
Outputs pass anomaly scans against import records, quarterly earnings mentions, and funding rounds. A senior analyst review precedes sign-off. Reports refresh yearly, with mid-cycle sweeps when material events, large M&A or mandate changes, occur.
Why Mordor's Smart Retail Baseline Earns Decision-Maker Trust
Published figures often diverge because firms anchor on different solution mixes, apply static currency rates, or refresh datasets sporadically.
By locking our scope to store-linked technologies, applying live exchange rates, and revisiting key variables annually, we curb both overstatement and understatement.
Benchmark comparison
| Market Size | Anonymized source | Primary gap driver |
|---|---|---|
| USD 52.10 B (2025) | Mordor Intelligence | - |
| USD 54.27 B (2025) | Global Consultancy A | Tracks only hardware plus select software, with limited expert validation |
| USD 62.50 B (2025) | Industry Publisher B | Blends omnichannel digital-commerce spend and fixes FX at prior-year averages |
In summary, our disciplined variable selection, frequent refresh cadence, and dual-layer validation give clients a balanced, transparent baseline that can be traced to observable data points and replicated with straightforward steps.


Key Questions Answered in the Report
What is the current size of the smart retail technology market?
The smart retail technology market is valued at USD 63.12 billion in 2026.
What compound annual growth rate (CAGR) is forecast for the smart retail technology market through 2031?
Market revenue is projected to expand at a 21.15% CAGR from 2026 to 2031.
Which region is expected to record the fastest growth?
Asia-Pacific leads with a forecast 24.78% CAGR, driven by unmanned-cabinet roll-outs, mobile-first shoppers, and government digitalisation incentives.
Which technology segment is set to grow the quickest?
Robotics and automation are expected to register the highest growth, advancing at a 29.85% CAGR as retailers automate fulfilment and shelf-replenishment tasks.
Why is the services segment growing faster than hardware?
Retailers increasingly favor subscription-based managed IoT and cloud analytics solutions, pushing the services segment to a 28.32% CAGR while hardware spending moderates.
What are the primary barriers to wider adoption of smart retail technologies?
Legacy infrastructure gaps in developing markets and rising data-privacy compliance costs—particularly under the EU Data Act—remain the key constraints.
Page last updated on:


