Market Overview
| Study Period | 2020 - 2031 |
|---|---|
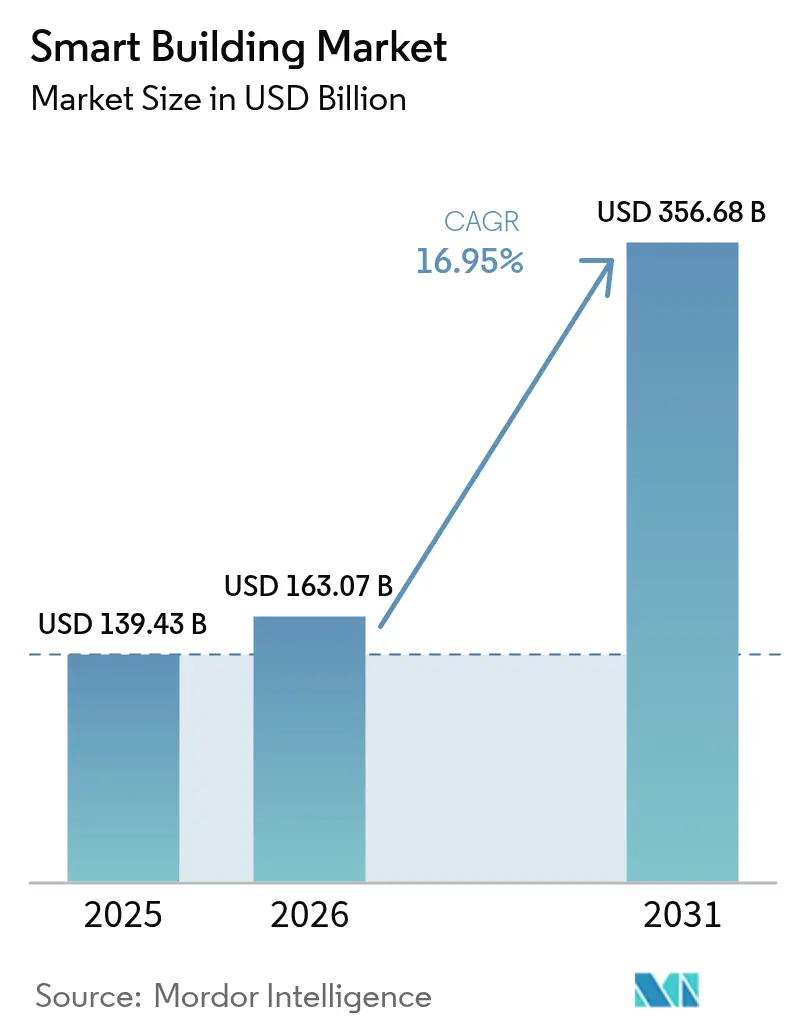
| Market Size (2026) | USD 163.07 Billion |
| Market Size (2031) | USD 356.68 Billion |
| Growth Rate (2026 - 2031) | 16.95% CAGR |
| Fastest Growing Market | Asia Pacific |
| Largest Market | Asia Pacific |
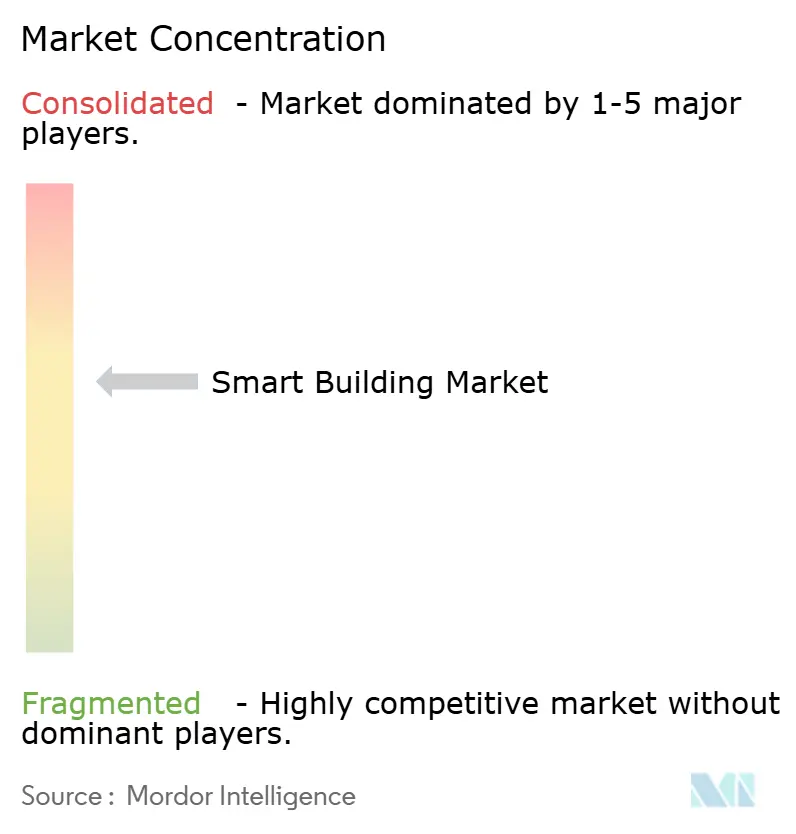
| Market Concentration | Medium |
Major Players*Disclaimer: Major Players sorted in no particular order Image © Mordor Intelligence. Reuse requires attribution under CC BY 4.0. | |
Smart Building Market Analysis by Mordor Intelligence
The smart building market size in 2026 is estimated at USD 163.07 billion, growing from 2025 value of USD 139.43 billion with 2031 projections showing USD 356.68 billion, growing at 16.95% CAGR over 2026-2031. Enhanced integration of operational technology and information technology, combined with real-time analytics, is converting buildings from passive assets into active energy nodes. Cyber-secure, open architectures are being selected ahead of proprietary systems as owners seek to unify lighting, HVAC, security, and energy management on a single platform.[1]Stromquist & Company, “Integrated Building Automation: 2025 Outlook,” stromquist.com Retrofit demand is climbing because commercial real-estate portfolios must align with net-zero pathways, while utilities are rewarding buildings that automate demand response with new tariff structures.[2]U.S. Department of Energy, “Better Buildings Initiative Progress Update 2025,” energy.gov Asia Pacific leads adoption as China and India scale national smart-city programs that mandate connected building infrastructure.
Key Report Takeaways
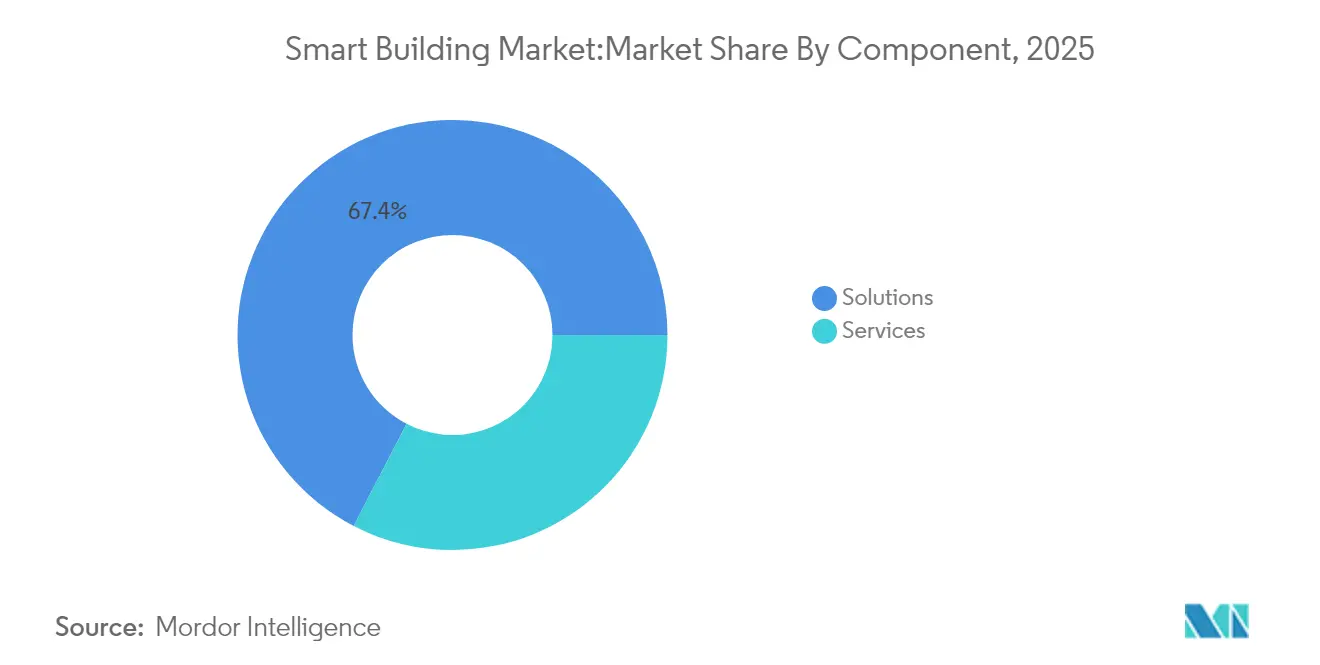
- By component, Solutions held 67.40% of revenue in 2025, while Services is forecast to record a 17.20% CAGR through 2031.
- By connectivity technology, wired infrastructure retained 54.75% market share in 2025; wireless platforms are projected to expand at an 18.35% CAGR to 2031.
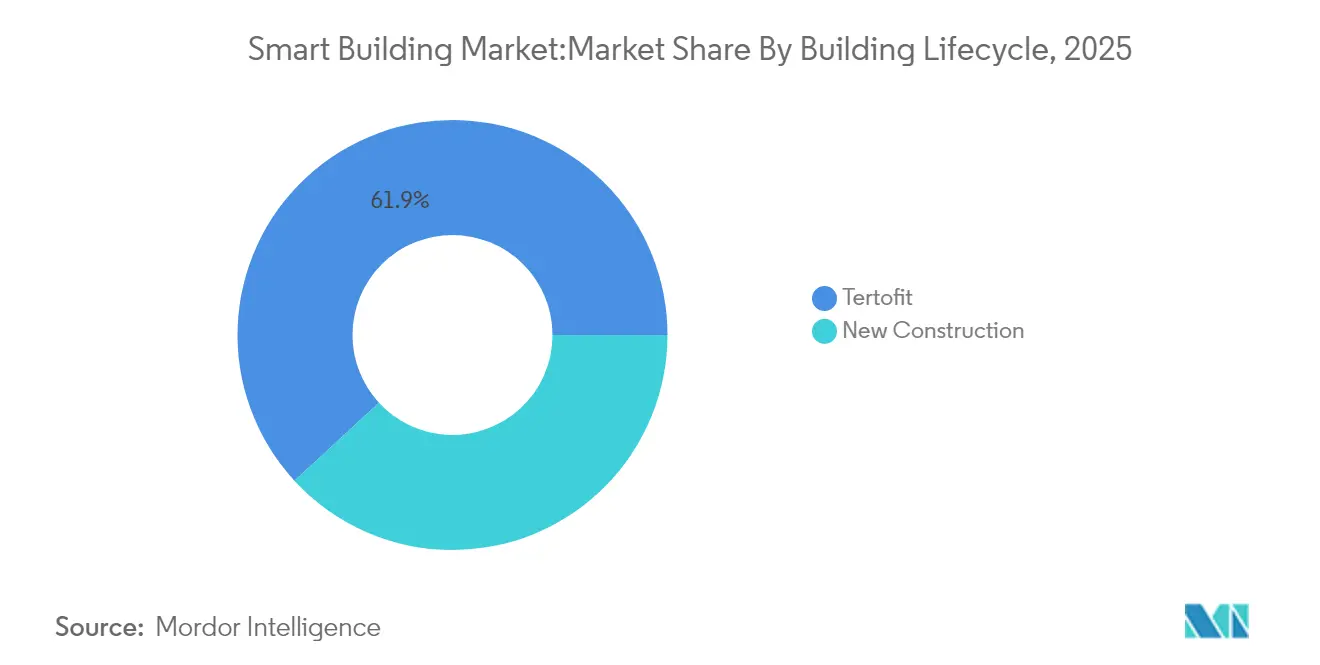
- By building lifecycle, retrofit projects captured 61.85% of the smart building market size in 2025, whereas new-construction deployments are set to grow at 17.15% CAGR between 2026 and 2031.
- By building type, commercial facilities led with 59.65% revenue share in 2025; residential buildings are anticipated to achieve the fastest 17.72% CAGR through 2031.
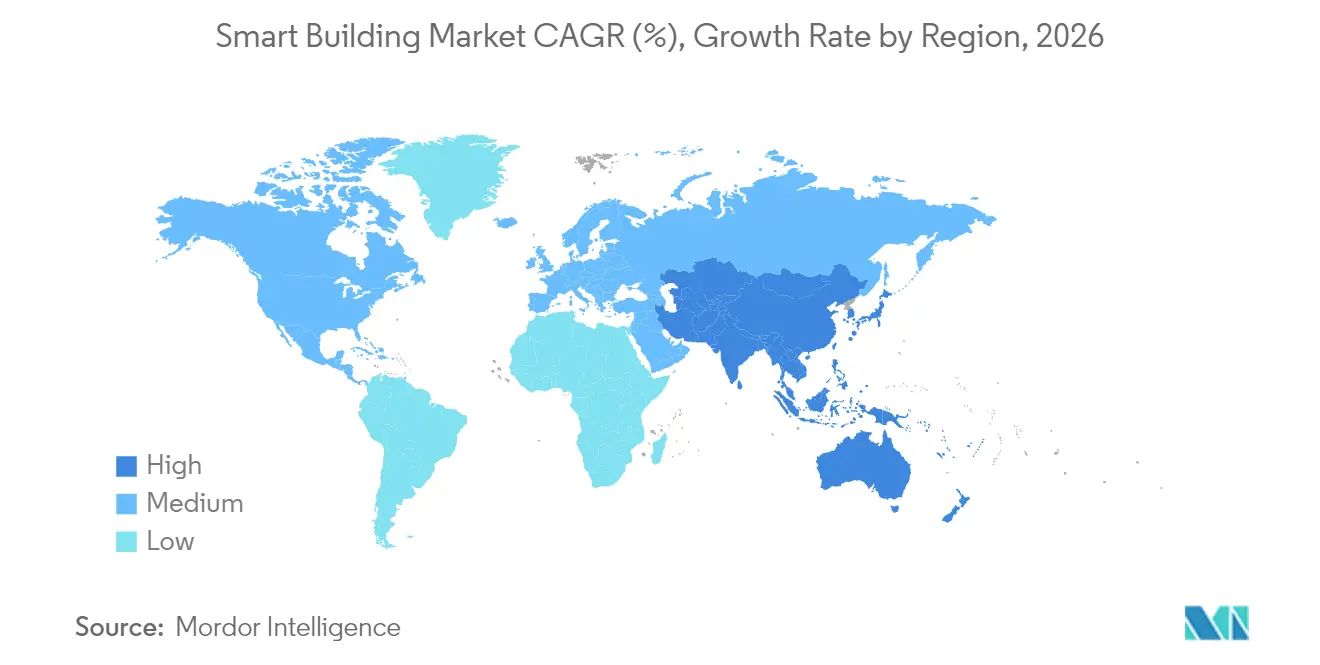
- By region, Asia Pacific commanded 31.55% of global revenue in 2025 and is expected to advance at a 19.85% CAGR to 2031.
- Siemens, Honeywell, Johnson Controls, and Schneider Electric collectively delivered more than 40% of multi-site smart building deployments completed in 2024.
Note: Market size and forecast figures in this report are generated using Mordor Intelligence’s proprietary estimation framework, updated with the latest available data and insights as of 2026.
Global Smart Building Market Trends and Insights
Drivers Impact Analysis*
| Driver | (~) % Impact on CAGR Forecast | Geographic Relevance | Impact Timeline |
|---|---|---|---|
| Escalating net-zero carbon mandates | +3.2% | EU, North America, global spill-over | Medium term (2–4 years) |
| IoT sensor proliferation | +2.8% | North America, Europe, developed APAC | Short term (≤ 2 years) |
| OT-IT cybersecurity convergence | +2.1% | North America, Europe, developed APAC | Medium term (2–4 years) |
| Utility demand-response incentives | +1.7% | North America, early Europe | Short term (≤ 2 years) |
| Campus digital-twin roll-outs | +2.4% | APAC core, MEA spill-over | Medium term (2–4 years) |
| EU Taxonomy aligned finance | +1.9% | Europe, influencing global norms | Medium term (2–4 years) |
| Source: Mordor Intelligence | |||


Escalating Net-Zero Carbon Mandates Driving Comprehensive Building Retrofits
Net-zero regulations require deep energy refurbishment because buildings generate 40% of global emissions. Mandates covering whole portfolios are pushing owners to install high-efficiency HVAC, electrify heat, and layer analytics that verify performance. ABB estimates the retrofit opportunity could reach USD 3.9 trillion by 2050 as decarbonization deadlines shorten.[3]ABB Group, “Global Building Retrofit Pathways,” abb.com Regional differences in definitions are accelerating local innovation, with many city codes surpassing national targets.
IoT Sensor Proliferation Enabling Real-Time Building Intelligence
An expanding sensor base is giving operators granular visibility into occupancy, equipment health, and indoor-air quality. China hosts 31 million smart buildings, while the United States has 16 million as of 2025. Platforms such as Johnson Controls’ OpenBlue have documented 10%–12% energy savings by turning raw data into prescriptive controls. Demand for low-power wireless sensors is rising as industrial sensor revenue approaches USD 29.9 billion in 2025.
OT-IT Cybersecurity Convergence Enabling Integrated Building Platforms
Secure connectivity is foundational now that buildings must exchange data with utilities and vehicle chargers. The U.S. Energy Modernization Cybersecurity Implementation Plan endorses standardized encryption for Building Energy Management Systems, facilitating grid-interactive buildings without raising cyber-risk. The International Energy Agency adds that digital controls can automate up to 10% demand flexibility in commercial stock.
Utility Demand-Response Programs Accelerating Smart Building Adoption
Dynamic tariffs reward buildings that lower load during peak periods. U.S. demand-response capacity surpassed 33 GW in 2023 and is set for double-digit growth, making automated load-shedding financially attractive. AI-driven controls allow facilities to participate without sacrificing occupant comfort, unlocking new revenue streams
Restraints Impact Analysis*
| Restraint | (~) % Impact on CAGR Forecast | Geographic Relevance | Impact Timeline |
|---|---|---|---|
| Legacy BMS protocol fragmentation | −1.8% | Mature markets with ageing stock | Medium term (2–4 years) |
| Semiconductor device cost inflation | −1.3% | Price-sensitive emerging regions | Short term (≤ 2 years) |
| Data-privacy restrictions on cloud analytics | −0.9% | Europe + privacy-focused markets | Medium term (2–4 years) |
| Skills gap in AI-enabled facility management | −1.1% | APAC, MEA, Latin America | Long term (≥ 4 years) |
| Source: Mordor Intelligence | |||
Legacy BMS Protocol Fragmentation Impeding System Integration
Older Building Management Systems use proprietary protocols that complicate retrofits. A 2024 MDPI review identified this fragmentation as a top barrier, often forcing owners to deploy middleware or replace entire subsystems.[4]MDPI, “Barriers to Smart Building Deployment: A Review,” mdpi.com Integration delays raise project costs and can erode the business case for advanced analytics.
Capex Inflation for Semiconductor-Intensive Devices Post-2024 Shortage
Post-2024, rising Capex costs due to semiconductor shortages are creating structural challenges for smart building deployments, particularly in sensor-heavy systems like HVAC, access control, and energy management. Elevated wafer fab investments through 2032, combined with fluctuating foundry Capex, have kept advanced node and power/analog chip prices above pre-shortage levels, limiting OEM discounts on devices such as smart meters, controllers, and edge gateways. As a result, building owners face higher upfront costs and longer payback periods, slowing adoption in cost-sensitive commercial and mid-tier segments of the global smart building market.
*Our forecasts treat driver/restraint impacts as directional, not additive. The impact forecasts reflect baseline growth, mix effects, and variable interactions.
Segment Analysis
By Component: Solutions Dominate While Services Accelerate
Solutions generated 67.40% of 2025 revenue, reflecting their central role in lighting control, security integration, and energy management. Cloud-native Building Management Systems are replacing on-premise servers, cutting upgrade downtime and enabling faster feature deployment. Services hold a smaller share but are growing at 17.20% CAGR as owners outsource analytics, cybersecurity monitoring, and lifecycle maintenance. This shift is easing internal skill shortages while creating recurring revenue streams for vendors.Wider availability of open APIs is driving partnerships between solution providers and specialist service firms. The smart building market is seeing managed-service contracts bundled with outcome-based guarantees that commit vendors to energy-saving thresholds. As artificial-intelligence modules become embedded, demand for continuous tuning and model retraining rises, reinforcing service growth.


By Connectivity Technology: Wireless Growth Outpaces Wired Infrastructure
Wired Ethernet, BACnet MS/TP, and power-over-Ethernet still connect 54.75% of smart devices, but wireless installations are expanding at an 18.35% CAGR. Radio protocols offer install flexibility for heritage buildings where core drilling is impractical. Wi-Fi 6/6E enhances bandwidth for video analytics, while Zigbee and Thread handle low-power sensors. DECT NR+ introduces sub-GHz coverage for dense device clusters, a standard now backed by Siemens and Schneider Electric.Growing device density is shifting designs toward multi-protocol access points that coordinate Bluetooth beacons, LoRaWAN meters, and 5G gateways on a converged backbone. Cyber-hardened mesh architectures allow edge devices to negotiate credentials autonomously, cutting commissioning time.
By Building Lifecycle: Retrofit Market Dominates with Compelling ROI
Retrofits captured 61.85% of smart building market share in 2025 because energy savings deliver payback in under five years for many office portfolios. Financial penalties for exceeding carbon caps, such as Local Law 97 in New York, make upgrades unavoidable. Owners prioritize wireless sensors, variable-frequency drives, and cloud analytics because these solutions minimize tenant disruption.New construction represents 38.15% but is expanding faster at 17.15% CAGR, reflecting a design-for-digital ethos in flagship projects. Developers embed fiber, edge servers, and renewable microgrids during construction, avoiding later retrofit costs. Building Information Modeling data feeds directly into digital-twin platforms that optimize handover and operation.
By Building Type: Commercial Leads While Residential Accelerates
Commercial buildings contributed 59.65% of 2025 revenue because large floorplates amplify efficiency gains. Airports and mixed-use campuses deploy integrated command centers that blend security, HVAC, and lighting dashboards. The residential segment is smaller yet rising at 17.72% CAGR as smart thermostats and unified applications move into mid-market apartments. Bundled energy-management services are being marketed alongside broadband packages, increasing penetration.Institutional facilities such as hospitals and universities are adopting fault-detection analytics to control maintenance budgets and enhance occupant comfort. Industrial properties integrate environmental monitoring with production schedules, linking facility metrics to corporate sustainability targets.
Geography Analysis
Asia Pacific led the smart building market with a 31.55% share in 2025 and will maintain the fastest 19.85% CAGR through 2031. National smart-city programs in China, South Korea, and Singapore mandate connected building systems that feed city-wide digital twins. India’s Grade-A commercial real estate expansion is also embedding intelligent lighting, air-quality sensors, and renewable microgrids.North America follows closely, propelled by utility demand-response programs and mandatory carbon-performance disclosure. The U.S. Better Buildings Initiative has already logged USD 22 billion in savings, validating the financial case for analytics retrofits. Canada’s national building code now references smart-meter-compatible controls, nudging regional adoption.Europe shows strong policy alignment via the EU Taxonomy, Energy Performance of Buildings Directive, and Renovation Wave strategy. Data-sovereignty rules encourage edge computing, so vendors supply on-site AI inference engines coupled with cloud dashboards. Scandinavia is pioneering district heating integration, while Germany expands smart-meter gateways that communicate secure load data to grid operators.

Competitive Landscape
Top Companies in Smart Building Market
The smart building market features concentrated leadership yet remains open to disruptors. Honeywell, Siemens, Johnson Controls, and Schneider Electric supply end-to-end platforms that bundle sensors, controllers, and analytics. Johnson Controls has deployed OpenBlue across financial and healthcare campuses, reporting double-digit energy savings for marquee clients. Siemens’ Building X suite integrates lighting, security, and microgrid management under a common user interface.
Technology firms are entering through software layers. Cisco positions its Catalyst switches as converged building networks, while IBM pairs Maximo asset management with Watson AI for predictive maintenance. Partnerships are forming to overcome interoperability limits; Nordic Semiconductor allied with Legrand and Schneider Electric to advance DECT NR+ as a multi-vendor wireless framework.
Investment is flowing into edge-AI startups offering specialized analytics for air quality, occupancy, and equipment health. Established players respond by acquiring or partnering with these firms rather than developing niche algorithms internally, accelerating innovation while protecting installed base revenues.
Smart Building Industry Leaders
Honeywell International Inc.
Siemens AG
Schneider Electric SE
IBM Corporation
ABB Ltd
- *Disclaimer: Major Players sorted in no particular order

Recent Industry Developments
- May 2025: Siemens Smart Infrastructure showcased wireless plug-and-play automation bundles and the Connect Box IoT hub at ISH 2025, emphasizing cybersecurity and emissions reduction.
- April 2025: Johnson Controls’ Sustainability Report detailed 10%–12% energy reductions delivered by its OpenBlue digital platform at client sites.
- February 2025: Nordic Semiconductor joined Legrand, Schneider Electric, and Siemens to promote the non-cellular 5G DECT NR+ standard for smart buildings.
- February 2025: ASHB launched its 2025 Smart Buildings Trends & Technology Adoption Research initiative, backed by Honeywell and Siemens.


Global Smart Building Market Report Scope
Smart buildings automate processes that control lighting, infrastructure, heating, security systems, ventilation, and air conditioning. Smart buildings integrate technology into basic building infrastructure and other equipment, components, and structures to make buildings safer, more efficient, and sustainable and reduce costs. The smart building solutions investigated are part of the rising IoT and connected sensor ecosystem. Smart buildings use automation to optimize all or some of the processes inside the building: heating and cooling, ventilation, security, lighting, water usage, and more. Some benefits include reduced environmental impact, proactive maintenance of equipment, and reduced energy use and costs.
The Smart Building Market is segmented by Component (Solutions (Building Energy Management Systems, Infrastructure Management Systems, Intelligent Security Systems), Services), by Application (Residential, Commercial), and by Geography (North America, Europe, Asia-Pacific, Latin America, and Middle East & Africa). The market sizes and forecasts are provided in terms of value in USD for all the above segments.
By Component
| Solutions | Building Energy Management Systems |
| Infrastructure Management Systems | |
| Intelligent Security Systems | |
| Lighting Control Systems | |
| HVAC Control Systems | |
| Other Solutions | |
| Services | Professional Services |
| Managed Services |
By Connectivity Technology
| Wired | |
| Wireless | Wi-Fi |
| ZigBee / Z-Wave | |
| Bluetooth Low Energy | |
| 6LoWPAN and Others |
By Building Lifecycle
| New Construction |
| Retrofit |
By Building Type
| Residential | |
| Commercial | Office |
| Retail | |
| Hospitality | |
| Airports and Transportation Hubs | |
| Industrial and Logistics | |
| Institutional (Healthcare, Education, Government) |
By Geography
| North America | United States |
| Canada | |
| Mexico | |
| South America | Brazil |
| Argentina | |
| Rest of South America | |
| Europe | Germany |
| United Kingdom | |
| France | |
| Italy | |
| Spain | |
| Rest of Europe | |
| Middle East | Saudi Arabia |
| United Arab Emirates | |
| Turkey | |
| Rest of Middle East | |
| Africa | South Africa |
| Nigeria | |
| Kenya | |
| Rest of Africa | |
| Asia Pacific | China |
| India | |
| Japan | |
| South Korea | |
| ASEAN | |
| Rest of Asia Pacific |
| By Component | Solutions | Building Energy Management Systems |
| Infrastructure Management Systems | ||
| Intelligent Security Systems | ||
| Lighting Control Systems | ||
| HVAC Control Systems | ||
| Other Solutions | ||
| Services | Professional Services | |
| Managed Services | ||
| By Connectivity Technology | Wired | |
| Wireless | Wi-Fi | |
| ZigBee / Z-Wave | ||
| Bluetooth Low Energy | ||
| 6LoWPAN and Others | ||
| By Building Lifecycle | New Construction | |
| Retrofit | ||
| By Building Type | Residential | |
| Commercial | Office | |
| Retail | ||
| Hospitality | ||
| Airports and Transportation Hubs | ||
| Industrial and Logistics | ||
| Institutional (Healthcare, Education, Government) | ||
| By Geography | North America | United States |
| Canada | ||
| Mexico | ||
| South America | Brazil | |
| Argentina | ||
| Rest of South America | ||
| Europe | Germany | |
| United Kingdom | ||
| France | ||
| Italy | ||
| Spain | ||
| Rest of Europe | ||
| Middle East | Saudi Arabia | |
| United Arab Emirates | ||
| Turkey | ||
| Rest of Middle East | ||
| Africa | South Africa | |
| Nigeria | ||
| Kenya | ||
| Rest of Africa | ||
| Asia Pacific | China | |
| India | ||
| Japan | ||
| South Korea | ||
| ASEAN | ||
| Rest of Asia Pacific | ||


Key Questions Answered in the Report
What is the current size of the smart building market?
The smart building market is valued at USD 163.07 billion in 2026 and is projected to reach USD 356.68 billion by 2031.
Which region is growing fastest for smart buildings?
Asia Pacific is forecast to register a 19.85% CAGR through 2031, driven by national smart-city programs and large-scale commercial developments.
Which is the fastest growing region in Smart Building Market?
Asia Pacific is estimated to grow at the highest CAGR over the forecast period (2026-2031).
Why are retrofit projects dominating the smart building market?
Existing buildings account for most floor space; retrofits deliver quick payback and help owners comply with tightening carbon regulations, giving them 61.85% market share in 2025.
How are demand-response incentives influencing adoption?
Utilities pay buildings that automatically reduce load during peak periods; U.S. programs already total more than 33 GW of flexible capacity, incentivizing investments in smart controls.
Which companies lead the competitive landscape?
Honeywell, Siemens, Johnson Controls, and Schneider Electric head the field with integrated platforms that combine hardware, software, and managed services.
Page last updated on:


