Smart Motors Market Size and Share
Market Overview
| Study Period | 2020 - 2031 |
|---|---|
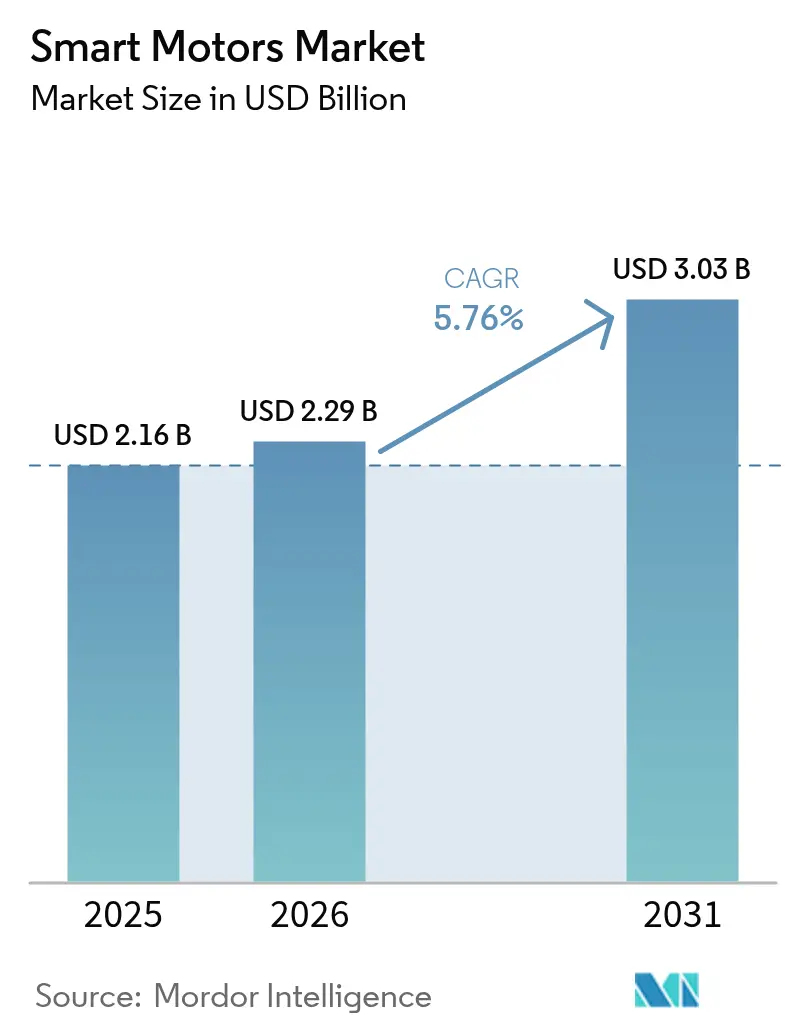
| Market Size (2026) | USD 2.29 Billion |
| Market Size (2031) | USD 3.03 Billion |
| Growth Rate (2026 - 2031) | 5.76% CAGR |
| Fastest Growing Market | Middle East |
| Largest Market | Asia Pacific |
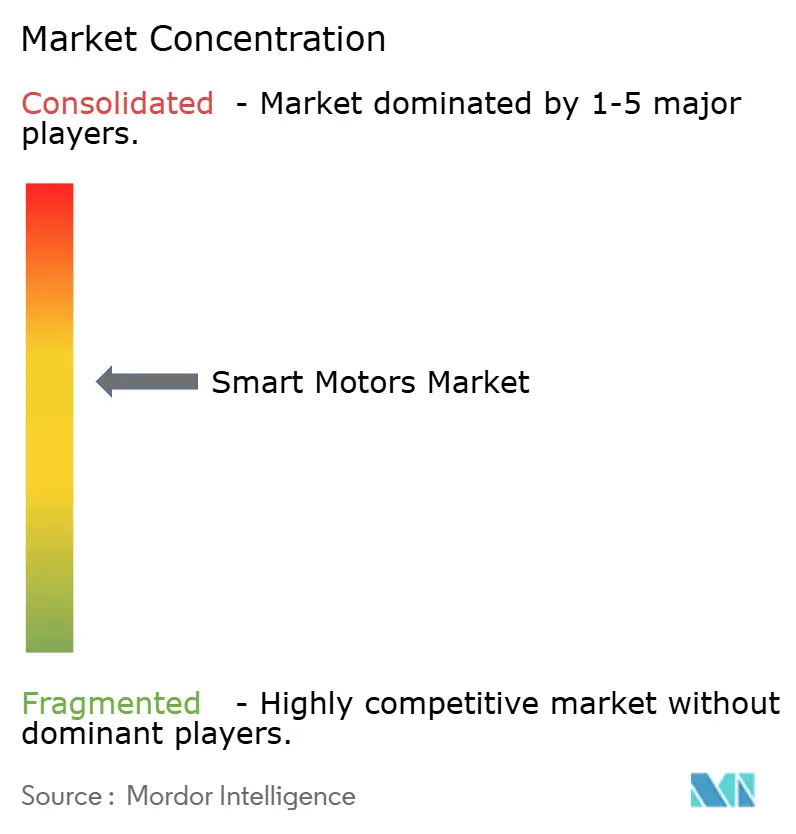
| Market Concentration | Medium |
Major Players *Disclaimer: Major Players sorted in no particular order Image © Mordor Intelligence. Reuse requires attribution under CC BY 4.0. | |
Smart Motors Market Analysis by Mordor Intelligence
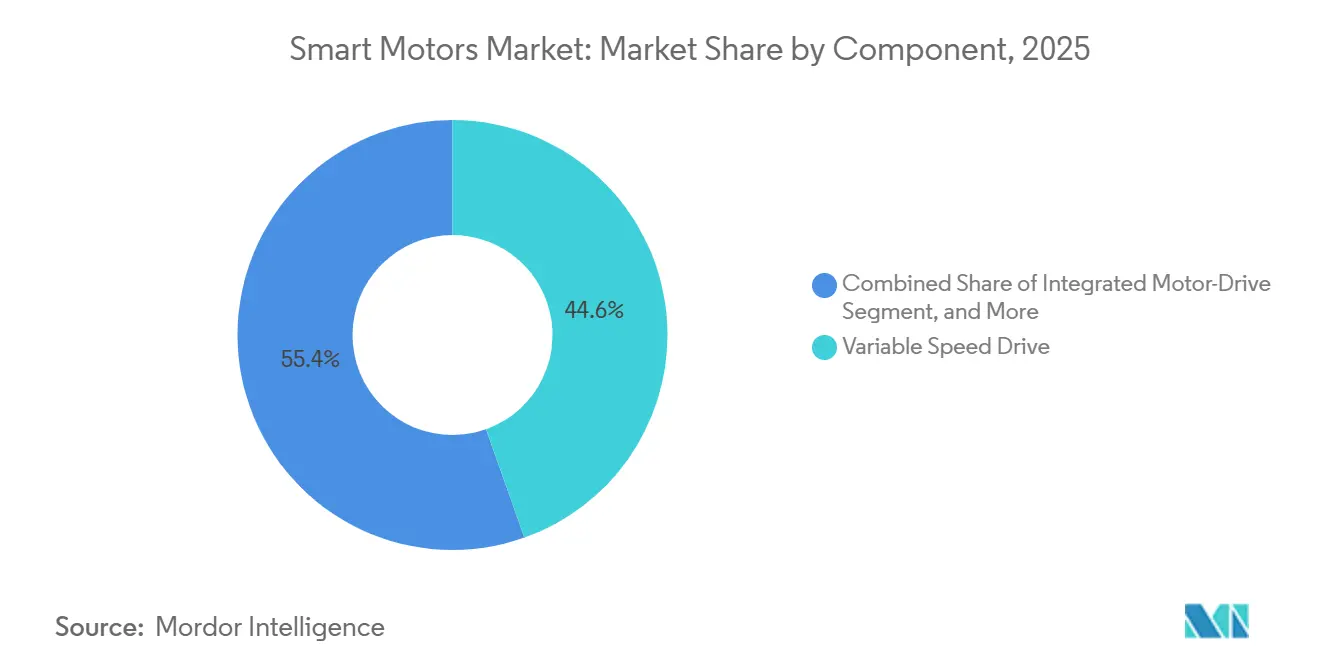
The smart motors market size was valued at USD 2.16 billion in 2025 and estimated to grow from USD 2.29 billion in 2026 to reach USD 3.03 billion by 2031, at a CAGR of 5.76% during the forecast period (2026-2031). This steady climb reflects progressive migration from fixed-speed motors to networked, sensor-rich systems that fine-tune energy use in real time. Variable-speed drives still accounted for 44.56% of 2025 revenue, yet factory-calibrated integrated motor-drive packages are advancing by 6.31% each year as end users seek simpler commissioning and lower lifetime costs. Demand is concentrated in the 1-10 kilowatt band, which accounted for 38.72% of 2025 shipments for pumps, fans, and conveyors, while sub-1 kilowatt designs are outpacing at 6.34% because autonomous mobile robots and smart building actuators require compact, battery-friendly solutions. Regionally, Asia-Pacific accounted for 39.74% of spending in 2025, whereas the Middle East led growth at 6.71% as energy-efficiency mandates accompany large industrial projects.
Key Report Takeaways
- By component, variable-speed drives led with a 44.56% revenue share in 2025, while integrated motor-drive packages are forecast to expand at a 6.31% CAGR through 2031.
- By power rating, the 1-10 kilowatt segment held 38.72% of the smart motors market share in 2025, whereas sub-1 kilowatt units are projected to grow the quickest at 6.34% CAGR to 2031.
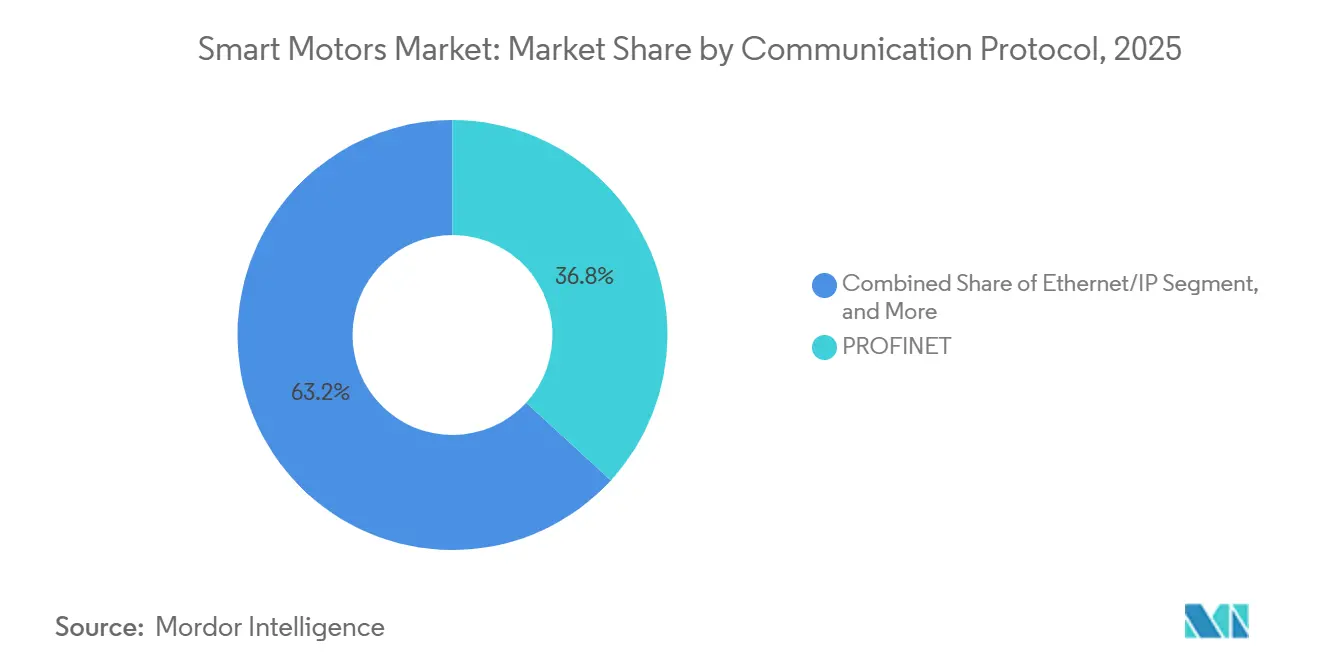
- By communication protocol, PROFINET commanded 36.82% of 2025 installations, and Ethernet/IP is expected to post the fastest 6.51% CAGR over the same horizon.
- By application, industrial uses accounted for 42.79% of the smart motors market share in 2025, but commercial deployments are set to rise at a 6.56% CAGR as data-center and HVAC upgrades accelerate.
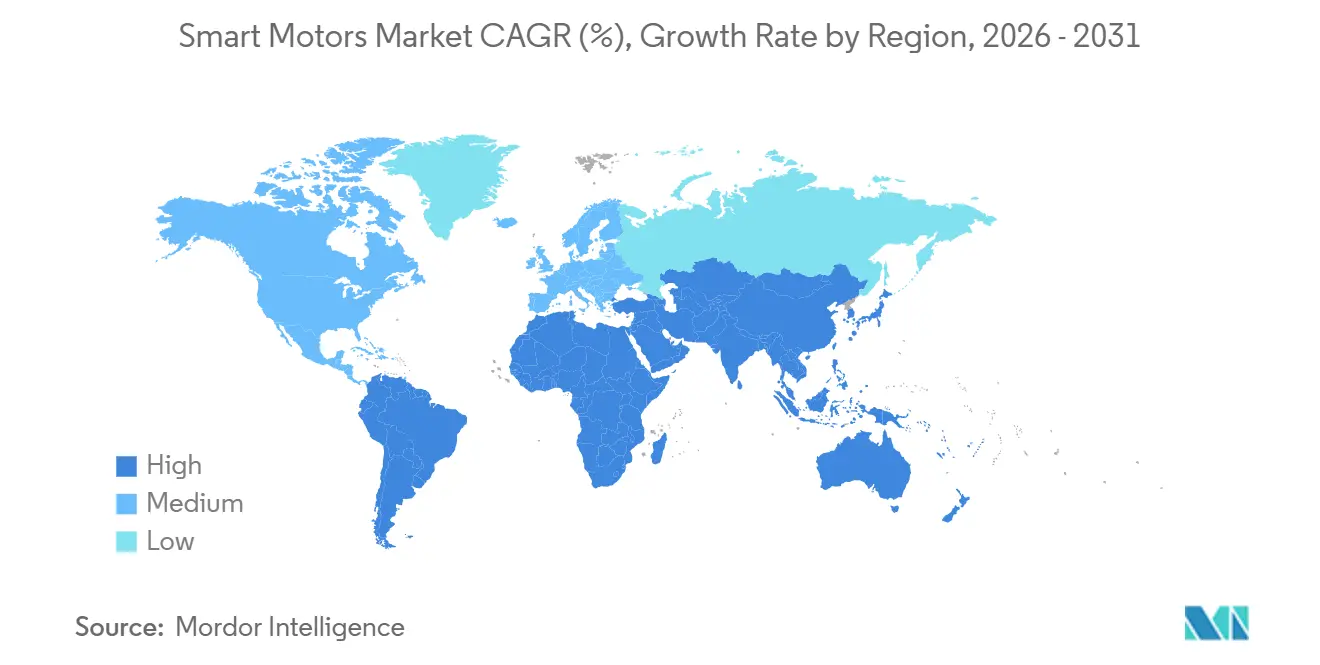
- By geography, Asia-Pacific captured 39.74% of 2025 demand, while the Middle East is on track for the highest 6.71% CAGR through 2031.
Note: Market size and forecast figures in this report are generated using Mordor Intelligence’s proprietary estimation framework, updated with the latest available data and insights as of 2026.
Global Smart Motors Market Trends and Insights
Drivers Impact Analysis*
| Driver | (~) % Impact on CAGR Forecast | Geographic Relevance | Impact Timeline |
|---|---|---|---|
| Declining Cost of Integrated Motor-Drive Packages Due to SiC/GaN Power Devices | +1.2% | Global, early adoption in North America and Europe | Medium term (2-4 years) |
| Mandates on Industrial Energy Efficiency Standards in Europe and China | +1.1% | Europe and China, spillover to ASEAN and Latin America | Short term (≤ 2 years) |
| Convergence of Smart Motor Controls with Edge AI for On-Device Optimization | +0.9% | Global, concentrated in industrial automation hubs | Medium term (2-4 years) |
| Rapid Electrification of HVAC Systems in Commercial Buildings | +0.8% | North America, Europe, and Middle East | Short term (≤ 2 years) |
| Increasing Adoption in Autonomous Mobile Robots and AGVs | +0.7% | Asia-Pacific core, expanding to North America and Europe | Medium term (2-4 years) |
| Rising Deployment in Offshore Wind Turbine Pitch and Yaw Systems | +0.5% | Europe and Asia-Pacific coastal regions | Long term (≥ 4 years) |
| Source: Mordor Intelligence | |||
Declining Cost of Integrated Motor-Drive Packages Due to SiC/GaN Power Devices
Wide-bandgap silicon carbide and gallium nitride transistors are reducing material costs by nearly one-fifth, enabling suppliers to house the motor, inverter, and feedback sensor in one enclosure without a premium.[1]IEEE Power Electronics Society, “Wide Bandgap Power Devices,” ieee.org Switching frequencies above 100 kHz reduces passive component size by 40%, making integrated units lighter and easier to mount in collaborative robots and electric-vehicle coolant loops. Conduction losses fall by 30-35%, a critical gain for battery-powered mobile robots that must extend runtime between charges. Global wafer output for 200 mm SiC increased in 2025, driving module prices down from USD 85 to USD 62 and making integrated packages feasible for mid-range industrial drives. Adoption is fastest in North America and Europe, while Chinese fabs remain 12-18 months behind in yield and reliability benchmarks.
Mandates on Industrial Energy Efficiency Standards in Europe and China
The European Union extended IE4 requirements to motors below 0.75 kilowatts in July 2025, and China barred IE2 motors from new projects in January 2024, converging global rules around IE3-plus efficiency. A 75-kilowatt IE4 motor with a drive consumes 8-12% less power, recouping the USD 1,800 premium within 18 months at industrial electricity tariffs.[2]International Electrotechnical Commission, “IEC 60034-30-1 Energy Efficiency Standard,” iec.ch Metals, cement, and pulp producers are thus retiring motors ahead of failure, favoring turnkey integrated units that ship with verified efficiency curves. Thailand drafted an IE3 mandate for 2027, and Vietnam is consulting on IE4 targets, signaling spillover across ASEAN. Accelerated replacement cycles underpin rising demand despite macroeconomic headwinds.
Convergence of Smart Motor Controls with Edge AI for On-Device Optimization
Microcontrollers running TinyML models identify bearing wear, insulation degradation, and load imbalance with up to 96% accuracy while eliminating cloud latency. In 2025, Siemens Gamesa equipped 180 offshore turbines with AI-enabled pitch-control drives, reducing unplanned call-outs by 28%.[3]Siemens Gamesa Renewable Energy, “Hollandse Kust Zuid Deployment,” siemensgamesa.com Autonomous mobile robots now adjust torque on the fly based on floor friction and payload, extending battery life by 12-15%. Water-treatment pumps preload speed profiles based on historical demand, reducing inrush energy by more than one-fifth. The cost of adding an AI-ready controller has fallen below USD 15, making predictive maintenance mainstream for mid-range drives.
Rapid Electrification of HVAC Systems in Commercial Buildings
Variable-speed electronically commutated motors deliver airflow in 1% increments, slicing HVAC energy by up to 30% in data centers and office towers. California’s Title 24 and the European Energy Performance directive require demand-controlled ventilation, pushing building owners toward smart motors with BACnet or Modbus interfaces. Microsoft’s Iowa data center achieved a 1.12 PUE in 2025 using liquid-cooling loops regulated by smart pumps that throttle flow to server thermal load. Global heat-pump installations rose 18% in 2025, each unit containing two to four smart compressors and fan motors. Middle East commercial projects are gaining momentum as ISO 50001 certification is now mandatory for new government facilities.
Restraints Impact Analysis*
| Restraint | (~) % Impact on CAGR Forecast | Geographic Relevance | Impact Timeline |
|---|---|---|---|
| Cybersecurity Vulnerabilities in Networked Motor Systems | -0.6% | Global, acute in critical infrastructure sectors | Short term (≤ 2 years) |
| Fragmented Communication Protocol Ecosystem Limiting Interoperability | -0.5% | Global, severe in multi-vendor brownfield sites | Medium term (2-4 years) |
| Prolonged Supply Chain Constraints for Power Electronics Components | -0.4% | Global, centered on Asia-Pacific fabs | Short term (≤ 2 years) |
| Skills Gap in Condition-Based Maintenance Analytics | -0.3% | North America and Europe, emerging in Asia-Pacific | Long term (≥ 4 years) |
| Source: Mordor Intelligence | |||
Cybersecurity Vulnerabilities in Networked Motor Systems
Fourteen firmware flaws exposed in 2025 enabled unauthenticated Modbus-TCP writes that could cause smart drives to turn off emergency stops. Only 38% of 2025 shipments met SL2 of IEC 62443, and fewer than 12% reached SL3, which mandates encryption and role-based access controls. Water utilities and refineries face the greatest risk after a 2024 breach at a European treatment plant via an unpatched PROFINET drive. Hardening steps, network segmentation, signed firmware, and intrusion detection add USD 300-800 per motor and require dual-skilled OT-security engineers, a resource that 64% of operators lack.
Fragmented Communication Protocol Ecosystem Limiting Interoperability
More than 42% of discrete manufacturers ran three or more fieldbus or Ethernet protocols in 2025, forcing gateways to introduce up to 15 ms of latency and complicating time-critical motion. Only 29% of new smart motors shipped with native OPC UA servers, keeping multivendor plants dependent on USD 450-900 external converters. Vendor tool-chain lock-in inflates lifecycle costs by 12-18% when users mix PROFINET, EtherNet/IP, and EtherCAT lines. Until IEEE 802.1 Time-Sensitive Networking reaches scale, interoperability issues will slow the broad convergence of OT and IT networks.
*Our forecasts treat driver/restraint impacts as directional, not additive. The impact forecasts reflect baseline growth, mix effects, and variable interactions.
Segment Analysis
By Component: Integrated Units Gain as Commissioning Complexity Drives Consolidation
Integrated motor-drive packages are growing faster than the overall smart motors market, with a 6.31% CAGR, capturing users who value 30-40% shorter installation times and reduced electromagnetic interference troubleshooting. Standalone variable-speed drives still accounted for the largest 44.56% of revenue in 2025 because retrofit projects often only replace the controller, not the motor. Yet integrated designs are penetrating mobile robots and wash-down food lines, where single-housing IP69K units avoid the cost of stainless-steel enclosures.
The shift aligns with distributed control trends; a packaging machine needing 40 servo axes can free an entire cabinet row by mounting integrated drives on each motor shaft. Asia-Pacific retains an appetite for standalone drives, as capital budgets favor incremental upgrades, but China’s subsidy programs are tipping state enterprises in heavy industries toward integrated platforms above 500 kilowatts. Modular architectures persist, allowing operators to replace either the motor or the drive independently after a fault.


By Power Rating: Sub-Kilowatt Segment Accelerates on Robotics and Building Automation
Sub-1 kilowatt motors are advancing 6.34% each year as e-commerce warehouses deploy autonomous mobile robots that carry four to six 0.2-0.5 kilowatt wheel drives per unit. In contrast, the 1-10 kilowatt class retained 38.72% of 2025 revenue and constitutes the backbone of industrial pumps and conveyors. Integrated 0.5-kilowatt packages fell to USD 180-240 per unit in 2025, enabling smart control of applications that once used fixed-speed induction motors.
Above 10 kilowatts, growth trails the market average because oil, gas, and metals plants prioritize ruggedness over energy savings, opting for predictive maintenance upgrades rather than full motor replacement. Building automation adds volume at the low end: a mid-size office may contain 100 variable-air-volume boxes, each with a 0.1-0.3 kilowatt smart actuator. Consequently, the smart motors market size for sub-kilowatt solutions is poised to close the gap with mid-power units over the forecast period.
By Communication Protocol: Ethernet/IP Gains as North America Converges OT and IT Networks
PROFINET anchored 36.82% of 2025 protocol deployments in European auto and pharma plants, but Ethernet/IP is expected to outpace all peers with a 6.51% CAGR to 2031. North American manufacturers migrating from DeviceNet favor Ethernet/IP because it meshes with existing enterprise data infrastructures. Modbus TCP endures in water and building systems for its simplicity, while EtherCAT, POWERLINK, and CC-Link IE split regional and niche share.
A 2025 Cisco survey found that 68% of plants plan to adopt converged Ethernet by 2028, boosting demand for multi-protocol drives that switch between standards via firmware updates. Time-Sensitive Networking features in IEEE 802.1 close deterministic gaps relative to PROFINET, leveling performance between the two. As a result, the smart motors market share held by fieldbus protocols dropped to 17% in 2025, down from 34% in 2020, indicating accelerating Ethernet dominance.
By Application: Commercial Segment Outpaces as Data Centers and HVAC Drive Demand
In 2025, industrial applications dominated shipments, making up 42.79% across sectors like oil, gas, metals, and water. This highlights the continued reliance on industrial operations for key resources and infrastructure. However, commercial projects are projected to grow at a 6.56% CAGR, fueled by the electrification of HVAC systems and the increasing cooling demands of data centers. These trends are driven by the growing need for energy efficiency and sustainability in commercial operations. To achieve PUE targets under 1.2, a typical 10-megawatt data center now incorporates 200-300 smart motors into its air handlers and cooling-tower fans, showcasing the integration of advanced technologies to optimize performance and reduce energy consumption.
Oil and gas operators install variable-frequency drives on electric submersible pumps, extending well life by 8-12%. Mining conveyors use regenerative drives, saving USD 40,000-80,000 in annual energy per kilometer. Municipal water plants, where power costs account for 30-40% of budgets, save USD 15,000-25,000 annually after upgrading high-service pumps. Meanwhile, commercial office retrofits comply with the 2024 International Energy Conservation Code, which mandates variable-speed fans for large air handlers.
Geography Analysis
Asia-Pacific held the highest smart motors market share of 39.74% in 2025, supported by China’s CNY 300 billion (USD 42 billion) energy-efficiency fund that upgraded 1.8 million motors during the year. India’s Production Linked Incentive program for white goods and air conditioners added 1.2 million units of annual capacity in 2025, while Japan and South Korea pushed servo-motor output for robotics and semiconductor fabs. Regional demand is reinforced by local suppliers that tailor integrated motor-drive packages to national standards, shortening approval cycles for government projects. As supply chains diversify away from single-source components, multinational original-equipment manufacturers are co-locating electronics and motor assembly lines in Vietnam, Thailand, and Indonesia to contain logistics risk. Such investments keep the region firmly positioned as the volume anchor of global shipments.
The smart motors market size in the Middle East is projected to expand at a 6.71% CAGR between 2026 and 2031, the fastest worldwide, as Saudi Arabia’s Public Investment Fund channels USD 20 billion into the NEOM industrial city, where IE4 motors and ISO 50001 certification are mandatory. The UAE’s Dubai Electricity and Water Authority introduced time-of-use tariffs that cut off-peak power prices by 18%, persuading factories to retrofit variable-speed drives for compressors, pumps, and fan arrays. Qatar’s USD 13 billion petrochemical expansion specifies explosion-proof smart motors up to 500 kilowatts, while Oman’s desalination projects favor corrosion-resistant integrated units for high-salinity pumps. Collectively, these initiatives convert large-scale infrastructure spending into durable equipment orders.
North America accounted for roughly 24% of 2025 revenue, energized by the Inflation Reduction Act tax credits that reimburse 30% of plant upgrades, including motor replacements in battery, semiconductor, and pharmaceutical facilities. Europe followed with a 22% share, anchored by strict Ecodesign rules and more than 4 gigawatts of annual offshore wind additions that demand pitch- and yaw-control drives. South America and Africa together made up 14% of spending, led by Brazilian mining conveyors and South African water-treatment pumps, both of which benefit from regenerative drive technology that reduces operating costs. Cross-border trade agreements and rising local-content rules are prompting suppliers to license assembly to regional partners, ensuring service coverage and shorter lead times.

Competitive Landscape
The competitive field remains moderately concentrated, with ABB, Siemens, Rockwell Automation, Nidec, and Schneider Electric commanding about 45% of global revenue in 2025. These leaders bundle hardware, firmware, and analytics into subscription contracts that stabilize margins even as component prices fall. Their combined scale allows preferred access to scarce silicon-carbide modules, giving them delivery advantages over smaller rivals during supply constraints.
Mid-tier manufacturers such as WEG, Yaskawa, and Emerson focus on regional strength or niche power bands, often undercutting global brands by 10-15% while meeting local certification needs. Strategic moves underscore this divergence: ABB’s USD 280 million stake in Shanghai Moons’ Electric expanded its sub-5-kilowatt catalog, and Siemens opened a USD 165 million Erlangen plant that automates winding and testing to cut cycle time by 35%. Nidec’s partnership with Microsoft integrates Azure IoT Edge functions into M-FORCE servos, eliminating the need for separate gateways for predictive analytics. Each initiative seeks to lock customers into proprietary ecosystems where switching costs rise over time.
Emerging disruptors cultivate white-space opportunities. Turntide Technologies markets switched-reluctance motors that eliminate rare-earth magnets and cut material costs by up to 40%, appealing to buyers exposed to volatile neodymium prices. Beckhoff and SEW-Eurodrive promote cabinet-free architectures, placing IP69K integrated drives at the machine frame and reclaiming valuable floor space in packaging and food lines. At the high-power end, Moog and Bosch Rexroth court aerospace, defense, and marine users who demand custom-engineered 1-megawatt solutions with 98% efficiency and MIL-STD-810 qualification. With no single player exceeding 20% share, the smart motors arena remains competitive enough for both incremental innovation and radical design alternatives.
Smart Motors Industry Leaders
ABB Ltd
Siemens AG
Schneider Electric SE
Rockwell Automation Inc.
Nidec Corporation
- *Disclaimer: Major Players sorted in no particular order

Recent Industry Developments
- January 2026: Siemens announced a EUR 150 million (USD 165 million) smart-motor plant in Erlangen, Germany, adding 800,000 integrated units of annual capacity targeting automotive and logistics users.
- December 2025: ABB acquired a 60% stake in Shanghai Moons’ Electric for USD 280 million to broaden its sub-5 kilowatt range for building automation.
- November 2025: Rockwell Automation launched the Allen-Bradley PowerFlex 6000T medium-voltage drive series with SiC modules, reaching 96.5% efficiency for motors above 1,000 kilowatts.
- October 2025: Nidec partnered with Microsoft to embed Azure IoT edge computing in M-FORCE servos, enabling predictive maintenance where data-sovereignty rules bar cloud transfer.


Global Smart Motors Market Report Scope
The Smart Motors Market Report is Segmented by Component (Variable Speed Drive, Motor, Integrated Motor-Drive), Power Rating (Below 1 kW, 1-10 kW, Above 10 kW), Communication Protocol (Ethernet/IP, PROFINET, Modbus TCP, Other Communication Protocols), Application (Industrial, Commercial, Automotive, Aerospace and Defense), and Geography (North America, South America, Europe, Asia-Pacific, Middle East and Africa). The Market Forecasts are Provided in Terms of Value (USD).
| Variable Speed Drive |
| Motor |
| Integrated Motor-Drive |
| Below 1 kW |
| 1-10 kW |
| Above 10 kW |
| Ethernet/IP |
| PROFINET |
| Modbus TCP |
| Other Communication Protocols |
| Industrial | Oil and Gas |
| Metal and Mining | |
| Water and Wastewater | |
| Food and Beverage | |
| Chemicals | |
| Commercial | HVAC and Building Automation |
| Data Centers | |
| Automotive | |
| Aerospace and Defense |
| North America | United States | |
| Canada | ||
| Mexico | ||
| South America | Brazil | |
| Argentina | ||
| Rest of South America | ||
| Europe | United Kingdom | |
| Germany | ||
| France | ||
| Italy | ||
| Rest of Europe | ||
| Asia Pacific | China | |
| Japan | ||
| India | ||
| South Korea | ||
| Rest of Asia Pacific | ||
| Middle East and Africa | Middle East | United Arab Emirates |
| Saudi Arabia | ||
| Rest of Middle East | ||
| Africa | South Africa | |
| Egypt | ||
| Rest of Africa | ||
| By Component | Variable Speed Drive | ||
| Motor | |||
| Integrated Motor-Drive | |||
| By Power Rating | Below 1 kW | ||
| 1-10 kW | |||
| Above 10 kW | |||
| By Communication Protocol | Ethernet/IP | ||
| PROFINET | |||
| Modbus TCP | |||
| Other Communication Protocols | |||
| By Application | Industrial | Oil and Gas | |
| Metal and Mining | |||
| Water and Wastewater | |||
| Food and Beverage | |||
| Chemicals | |||
| Commercial | HVAC and Building Automation | ||
| Data Centers | |||
| Automotive | |||
| Aerospace and Defense | |||
| By Geography | North America | United States | |
| Canada | |||
| Mexico | |||
| South America | Brazil | ||
| Argentina | |||
| Rest of South America | |||
| Europe | United Kingdom | ||
| Germany | |||
| France | |||
| Italy | |||
| Rest of Europe | |||
| Asia Pacific | China | ||
| Japan | |||
| India | |||
| South Korea | |||
| Rest of Asia Pacific | |||
| Middle East and Africa | Middle East | United Arab Emirates | |
| Saudi Arabia | |||
| Rest of Middle East | |||
| Africa | South Africa | ||
| Egypt | |||
| Rest of Africa | |||


Key Questions Answered in the Report
What is the projected value of the smart motors market by 2031?
It is forecast to reach USD 3.03 billion by 2031, reflecting a 5.76% CAGR from 2026.
Which component segment is expanding the fastest?
Integrated motor-drive packages, growing at a 6.31% CAGR through 2031 as users prefer factory-calibrated units.
Why are sub-1 kilowatt smart motors in high demand?
Autonomous mobile robots and building-automation actuators require compact, efficient drives, pushing this band to a 6.34% CAGR.
Which region shows the highest growth momentum?
The Middle East leads with a 6.71% CAGR, driven by large industrial-city and energy-efficiency projects.
How are energy-efficiency mandates affecting adoption?
European and Chinese IE4 regulations shorten payback periods, prompting early motor replacement and boosting sales of high-efficiency designs.
What major cybersecurity risk impacts smart motor uptake?
Firmware vulnerabilities that allow unauthorized control over networked drives, compelling operators to invest in certified secure devices.
Page last updated on:


