Market Overview
| Study Period | 2021 - 2031 |
|---|---|
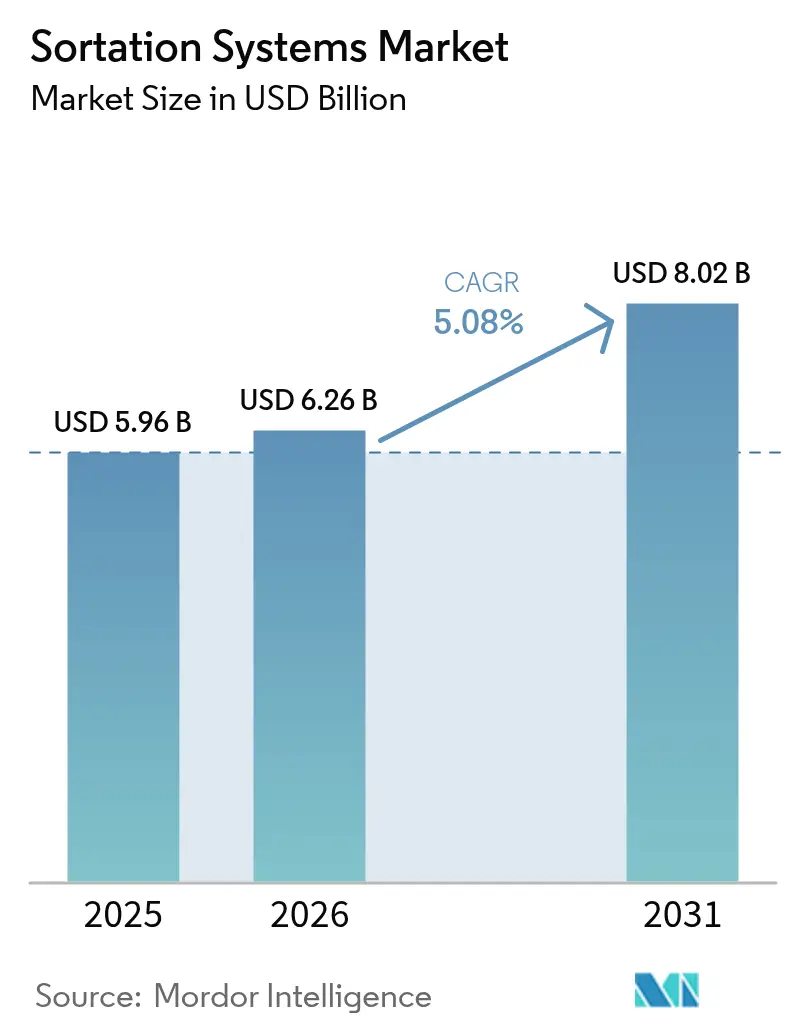
| Market Size (2026) | USD 6.26 Billion |
| Market Size (2031) | USD 8.02 Billion |
| Growth Rate (2026 - 2031) | 5.08% CAGR |
| Fastest Growing Market | Asia Pacific |
| Largest Market | Asia Pacific |
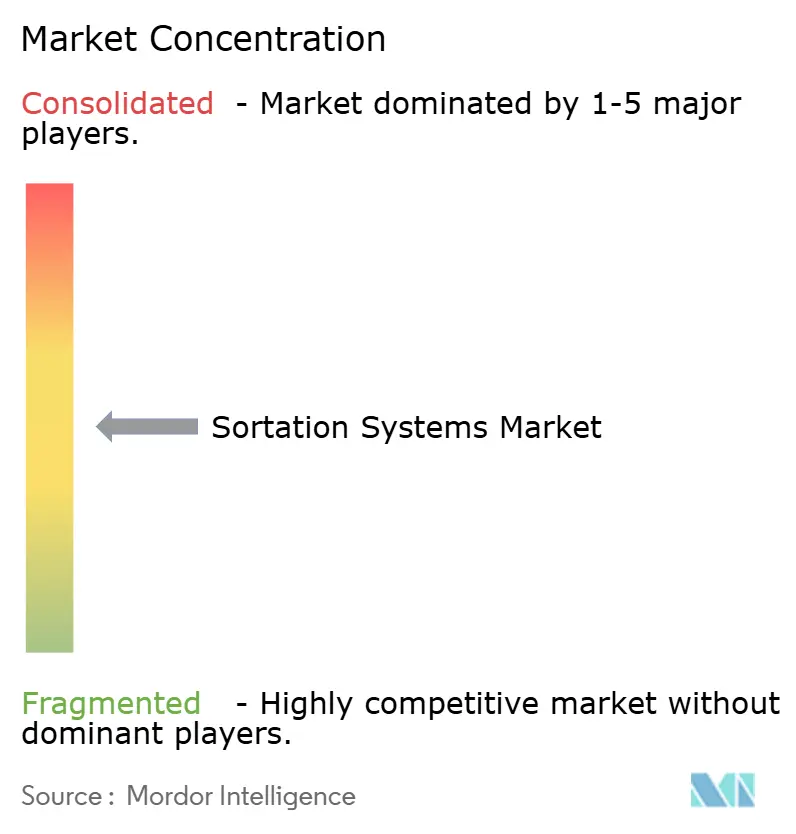
| Market Concentration | Medium |
Major Players
*Disclaimer: Major Players sorted in no particular order Image © Mordor Intelligence. Reuse requires attribution under CC BY 4.0. |
|
Sortation Systems Market Analysis by Mordor Intelligence
The sortation systems market size is expected to grow from USD 5.96 billion in 2025 to USD 6.26 billion in 2026 and is forecast to reach USD 8.02 billion by 2031 at 5.08% CAGR over 2026-2031. Moderate but steady expansion shows the field is transitioning from novel automation toward core infrastructure. Cross-belt equipment is also the fastest-expanding sorter platform, confirming a shift from premium niche toward de-facto standard. The convergence of dominant position and accelerated expansion signals cross-belt technology's evolution from premium solution to industry standard, driven by its superior handling of diverse package geometries and weights. E-commerce and omnichannel operators dominate demand, illustrating that parcel automation remains in a long runway. Hardware continues to account for majority of sales, yet the shift toward software-centric value creation reflects industry recognition that competitive differentiation increasingly depends on algorithmic efficiency rather than mechanical speed alone. Geographically, APAC leads highest share in 2024, fuelled by Chinese cross-border e-commerce and Indian automation investments exemplified by Daifuku’s 2025 plant launch
Key Report Takeaways
- By sorter type, cross-belt technology led with 37.60% of sortation systems market share in 2025 and is expanding at 7.52% CAGR through 2031.
- By end-user, e-commerce and omnichannel retail held 40.70% revenue in 2025; airports represent the fastest-growing institutional segment at 6.66% CAGR through 2031.
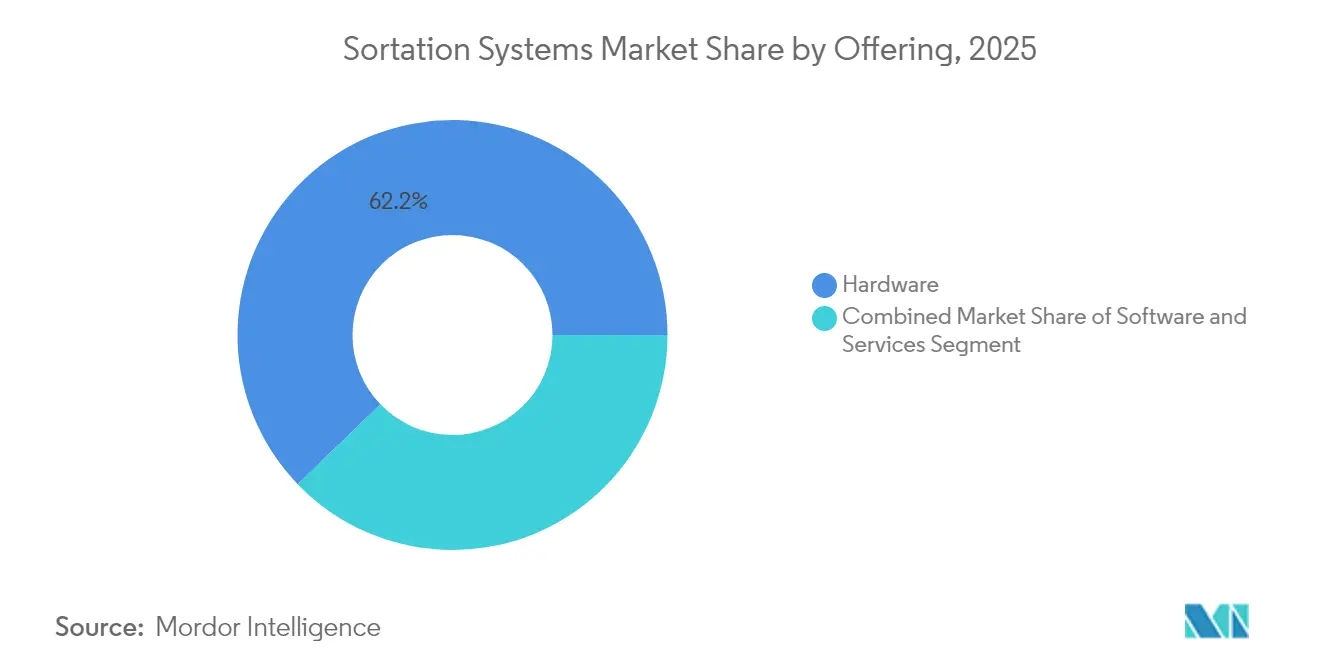
- By offering, hardware commanded 62.20% share of the sortation systems market size in 2025, while software is climbing at 7.01% CAGR to 2031.
- By throughput, high-speed installations (10,000-25,000 pph) represented 45.60% of 2025 deployments; ultra-high-speed solutions are growing 6.31% annually.
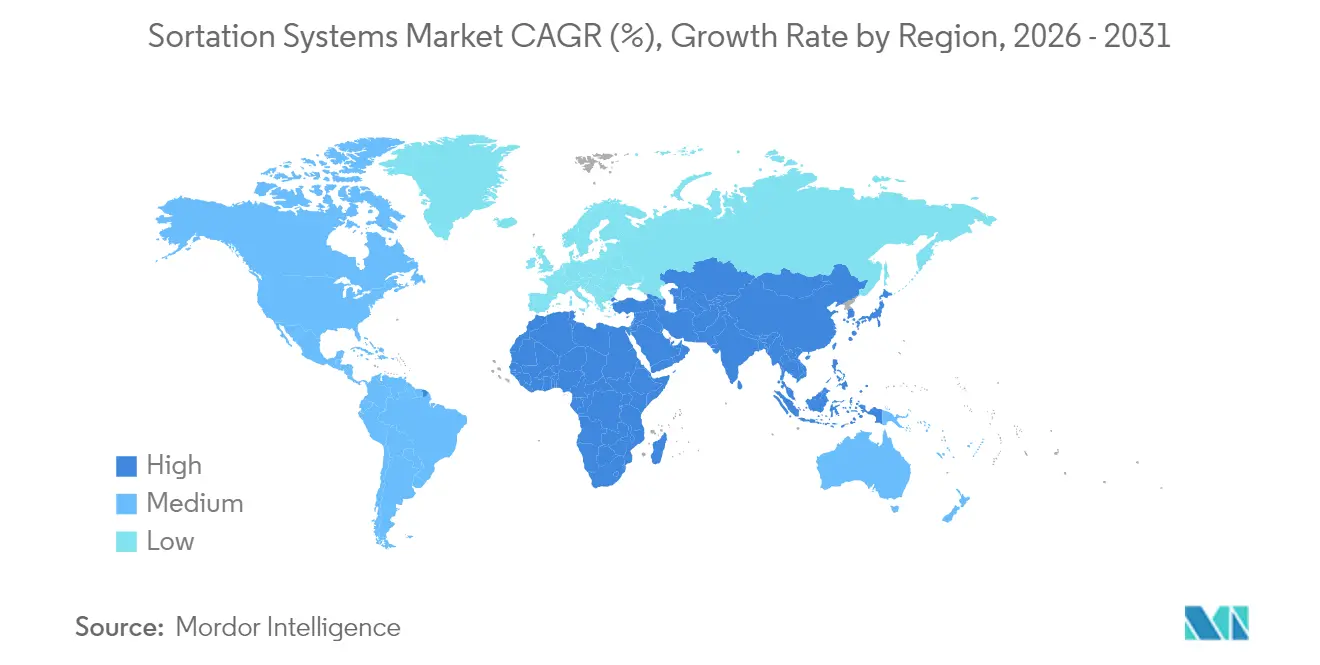
- By region, APAC held 35.90% revenue in 2025, and the region is accelerating at 8.25% CAGR to 2031.
Note: Market size and forecast figures in this report are generated using Mordor Intelligence’s proprietary estimation framework, updated with the latest available data and insights as of 2026.
Global Sortation Systems Market Trends and Insights
Drivers Impact Analysis*
| Driver | (~) % Impact on CAGR Forecast | Geographic Relevance | Impact Timeline |
|---|---|---|---|
| E-commerce parcel surge | +1.8% | Global with APAC volume leadership | Medium term (2-4 years) |
| Labor-cost escalation and scarcity | +1.2% | North America and EU core; spreading in APAC | Short term (≤ 2 years) |
| SKU proliferation demanding accuracy | +0.9% | Global high-density e-commerce zones | Long term (≥ 4 years) |
| Airport baggage-handling upgrades | +0.7% | Global hub modernisation focus | Medium term (2-4 years) |
| AI-vision powered dynamic sorters | +0.6% | North America and EU early adoption | Long term (≥ 4 years) |
| Sustainability-driven energy savings | +0.4% | EU regulatory leadership | Long term (≥ 4 years) |
| Source: Mordor Intelligence | |||
E-commerce parcel surge
Parcel growth reshapes capacity planning. United States annual parcel flow is forecast to hit 28 billion by 2028, a 5% yearly increase. Chinese cross-border sellers accelerate digitalisation and employ generative AI to improve demand forecasting, allowing facilities to move from reactive peaks to predictive load balancing.[1]FreightWaves, "Study: US annual parcel shipping volumes to grow 5% through 2028.", freightwaves.comSorters that self-adjust to volume spikes and shift routing rules on the fly now underpin peak-season resilience.
Labor-cost escalation & scarcity
Warehouse payroll inflation and technician shortages compress deployment timelines. A 63% majority of operators cite skilled labour gaps as the top obstacle, while 770,000 supply-chain technician vacancies are expected by mid-decade.[2]DC Velocity, "Getting around the warehouse tech labor crunch.", dcvelocity.com Procurement criteria now weigh remote diagnostics and simplified maintenance as heavily as nominal throughput.
SKU proliferation demands accuracy
Rising product variety turns accuracy into customer retention metric. Advanced vision suites now recognise more than 30 material types and orientations, delivering 99.9% order fulfilment precision. Machine-learning models refine settings continuously, important for pharmaceuticals and food lines that mandate strict handling scripts.
Airport baggage-handling upgrades
Airports consolidate legacy layouts into single, high-speed networks to trim transfer times and energy usage. Seattle-Tacoma’s 8,200-bag per hour rebuild and Salt Lake City’s 3,540-bag energy-efficient project illustrate integrated overhauls superseding piecemeal add-ons. Baggage projects often specify cross-belt or tilt-tray modules fitted with RFID and permanent-magnet drives to cut idle power draw.
AI-vision powered dynamic sorters
Vision sensors linked to deep-learning cores adapt routing rules in milliseconds, allowing belt speeds to vary by parcel type and destination. Early adopters in North America and Europe report 20-30% productivity up-lifts due to reduced manual exception handling.[3]Siemens Logistics, “Siemens Logistics Newsroom,” siemens-logistics.com
Sustainability-driven energy savings
EU environmental directives drive operators to audit energy usage and cut emissions. Conveyors using regenerative braking and variable-frequency drives lower energy draw by 15-20%, creating a measurable compliance benefit. [4]MDPI Sustainability, "An Evaluation of the Environmental Impact of Logistics Activities: A Case Study of a Logistics Centre.", mdpi.com
Restraints Impact Analysis*
| Restraint | (~) % Impact on CAGR Forecast | Geographic Relevance | Impact Timeline |
|---|---|---|---|
| High capex and ROI uncertainty | -1.1% | Global, mid-market adopters most affected | Short term (≤ 2 years) |
| Skilled-technician shortage | -0.8% | North America and EU acute; emerging in APAC | Medium term (2-4 years) |
| Source: Mordor Intelligence | |||
High capex & ROI uncertainty
Full-scale sorters require multimillion-dollar outlays plus facility remodelling. Operators demanding 18-24-month payback often delay adoption, favouring modular add-ons that can stretch ROI but impair long-term efficiency. Quantifying soft returns such as reduced churn and customer loyalty remains challenging.
Skilled-technician shortage
Advanced equipment cuts unplanned downtime by up to 90% when predictive maintenance is active, yet many plants cannot recruit the specialised staff needed to run these programmes. Vendors now offer subscription maintenance and cloud analytics, but dependence on stable connectivity introduces new risk vectors during peak events.
*Our forecasts treat driver/restraint impacts as directional, not additive. The impact forecasts reflect baseline growth, mix effects, and variable interactions.
Segment Analysis
By Sorter Type: Cross-belt adaptability cements leadership
Cross-belt units generated 37.60% revenue in 2025 and are set to rise 7.52% annually, giving the sorter class the largest and fastest path within the sortation systems market. Facilities prefer its capability to handle irregular packages without speed loss. Tilt-tray and sliding-shoe equipment stay relevant where either fragile goods or uniform cartons dominate. Narrow-belt installations persist in legacy buildings with limited floor plates. Pop-up wheel and diverter systems continue to fade as operators pursue higher flexibility and uptime.
The sortation systems market size for cross-belt platforms is projected to exceed USD 3.15 billion by 2031, reflecting entrenched migration from niche to mainstream. Meanwhile, sliding-shoe products hold a mid-single-digit sortation systems market share and show low-single-digit expansion as they retain fit in apparel and parcel hubs demanding gentle flow control.


By End-User Industry: E-commerce strength endures
E-commerce and omnichannel retailers captured 40.70% of 2025 turnover and are increasing 7.18% annually. Post-and-parcel operators remain the second-largest cohort, yet margin pressure converts automation into a cost-containment lever rather than growth catalyst. Airports contribute stable, project-based opportunities as hubs modernise baggage loops. Food, beverage and pharma lines embrace high-accuracy sorting to honour compliance, fuelling adoption of sensor-laden cross-belt and high-speed tray units.
By 2031, the e-commerce segment is expected to command more than USD 3.27 billion of the sortation systems market size. Airport programmes, though lumpy, could achieve mid-single-digit CAGR on the back of combined passenger and cargo investments.
By Offering: Software ascends in value hierarchy
Hardware still delivers 62.20% 2025 revenue, but software modules grow 7.01% annually as warehouses seek real-time orchestration. Platforms like Hai Robotics’ HaiQ process 10,000 concurrent events and integrate with WMS, enabling predictive order release and dynamic batching. Services covering system design, maintenance and continuous improvement hold the fastest momentum, reflecting buyer preference to outsource specialist know-how.
The sortation systems market share held by software could reach 41.35% by 2031 as analytics and machine learning drive headline efficiency gains. Hardware differentiation will likely pivot toward energy-management and modularity while leaving optimisation logic to cloud-native stacks.
By Throughput Rate: Ultra high-speed accelerates
High-speed lines (10,000-25,000 pph) account for 45.60% deployments, aligning with typical parcel-centre volumes. Ultra high-speed (>25,000 pph) is climbing at 6.31% CAGR, driven by consolidation of fulfillment hubs and peak-season burst requirements. New Zealand Post’s Auckland hub now processes more than 30,000 parcels hourly, underscoring the business case for top-tier capacity.
Medium-speed machines retain relevance in regional facilities, while low-speed systems shift toward specialist applications such as fragile goods kitting. Investment appetite is trending toward scalable architectures capable of toggling between high and ultra-high throughput via software throttling rather than mechanical change-outs.
Geography Analysis
APAC dominated the sortation systems market with 35.90% 2025 share and is expanding at 8.25% CAGR. China’s logistics sector uses AI to lift collection efficiency 30% and delivery 35%, spurring further adoption of intelligent sorters. India’s automation drive is illustrated by Daifuku’s 2025 manufacturing complex designed to localise production and lower lead times. Southeast Asian e-commerce growth also channels investment into flexible sorting in urban micro-fulfilment nodes.
North America remains a core revenue pillar through airport baggage rebuilds and ongoing parcel-centre upgrades. Growth moderates to a mid-4% rate as many first-wave facilities are already automated, causing spend to pivot towards retrofits, software, and sustainability upgrades. Europe balances green mandates with performance. Operators favour energy-efficient motors and recyclable belt materials to align with EU circularity targets.
Middle East and Africa present nascent but rising demand as Gulf airports invest in hub capability and African e-commerce leapfrogs conventional retail. South America exhibits selective uptake in metropolitan corridors where parcel volumes and labour inflation justify capital outlays. Policymakers in Brazil and Chile have signalled intent to streamline customs processes, indirectly supporting sorter adoption in export-oriented logistics parks.

Competitive Landscape
The sector shows moderate concentration. Vanderlande, Honeywell Intelligrated, Siemens Logistics, Daifuku and Beumer remain top-tier. Vanderlande’s EUR 300 million (USD 325 million) takeover of Siemens Logistics in 2024, and its ownership by Toyota Industries, highlight a tilt toward scale and full-suite capability. Large peers are coupling hardware depth with AI optimisation layers, while smaller entrants push modular, software-first propositions.
Technological advantage centres on predictive maintenance and machine-vision routing. Siemens Logistics systems can decode damaged bag tags in seconds, cutting delays 75%. Amazon’s patented container-chute design enabling 2,100 units per hour for 45kg items underlines how in-house innovations still shape competitive benchmarks. Patent filings cluster around vision, sensor fusion and motor efficiency.
Price competition remains present but secondary to lifecycle value. Vendor lock-in risks and cybersecurity have come to the foreground, prompting operators to request open APIs and third-party service rights. The emergence of subscription-based RaaS (Robotics-as-a-Service) models may reshape revenue recognition and balance-sheet optics over the next five years.
Sortation Systems Industry Leaders
-
Daifuku Co. Ltd
-
Interroll Holding AG
-
Viastore Systems Gmbh
-
Bastian Solutions Inc.
-
Dematic Corp.
- *Disclaimer: Major Players sorted in no particular order

Recent Industry Developments
- April 2025: Daifuku launched a plant in India, pursuing localisation and shorter lead times to capture fast-growing regional demand.
- February 2025: Actemium automated E.Leclerc’s fresh-food network for 97 markets, signalling uptake of specialised sortation in temperature-controlled chains.
- January 2025: AutoStore deployed an ASRS at Master Electronics, lifting productivity 233% and trimming training curves, illustrating synergies between goods-to-person and downstream sorting.
- December 2024: Wincanton introduced the VersaTile modular system, boosting pick rates fivefold to serve surge e-fulfilment.
- November 2024: Vanderlande closed the Siemens Logistics acquisition for EUR 300 million (USD 325 million), deepening airport baggage and cargo coverage.


Research Methodology Framework and Report Scope
Market Definitions and Key Coverage
Our study defines the global sortation systems market as all newly installed automated hardware that identifies, merges, routes, and conveys cartons, parcels, totes, or baggage to preset destinations within warehouses, distribution centers, parcel hubs, and airports. Systems assessed include loop and linear configurations such as cross-belt, tilt-tray, shoe, and push-tray sorters operating from roughly 1,000 to more than 25,000 pieces per hour.
Scope exclusion: standalone conveyors that only transport items without destination-specific divert actions are not counted.
Segmentation Overview
-
By Sorter Type
- Cross-belt Sorters
- Tilt-tray Sorters
- Sliding-shoe Sorters
- Narrow-belt Sorters
- Push-tray / Split-tray Sorters
- Pop-up Wheel & Diverter Sorters
-
By End-user Industry
- Post & Parcel Operators
- E-commerce & Omnichannel Retail
- Airports (Baggage Handling)
- Food & Beverages
- Pharmaceuticals & Healthcare
- 3PL & Contract Logistics
- Automotive & Industrial Manufacturing
-
By Offering
- Hardware
- Software
- Services (Installation, MRO)
-
By Throughput Rate
- Low-speed (<3k)
- Medium-speed (3k-10k)
- High-speed (10k-25k)
- Ultra High-speed (>25k)
-
By Geography
-
North America
- United States
- Canada
- Mexico
-
South America
- Brazil
- Argentina
- Rest of South America
-
Europe
- Germany
- United Kingdom
- France
- Italy
- Spain
- Netherlands
- Rest of Europe
-
APAC
- China
- Japan
- India
- South Korea
- Australia & New Zealand
- Southeast Asia
- Rest of APAC
-
Middle East & Africa
- GCC (ex-Saudi)
- Saudi Arabia
- Turkey
- South Africa
- Israel
- Rest of Middle East & Africa
-
North America
Detailed Research Methodology and Data Validation
Primary Research
Interviews with warehouse engineers, parcel-network planners, 3PL operations heads, and sorter-OEM product managers across North America, Europe, and Asia let us test throughput assumptions, refurbishment discounts, and installation lead times before locking our model.
Desk Research
We began by mapping demand fundamentals with public datasets from the Universal Postal Union, IATA baggage statistics, Eurostat industrial output, and U.S. Census e-commerce sales. Trade association briefs from the Material Handling Institute and the International Federation of Robotics clarified penetration curves, while company 10-Ks, IPO filings, and import-export records sharpened typical selling prices and regional mix. Paid feeds such as D&B Hoovers and Dow Jones Factiva helped our team size vendor revenue pools and backlog trends. The sources listed are illustrative; many other publications were consulted to cross-verify figures and assumptions.
Market-Sizing & Forecasting
A top-down build anchored in parcel volumes, airport baggage counts, and new warehouse footprints set the demand pool, which we then reconciled with selective bottom-up snapshots of supplier shipments and channel checks. Core variables include e-commerce parcel growth, average sorter lane capacity, price erosion per lane, automation penetration in new fulfillment space, and capex ratios at postal operators. Five-year forecasts were generated through multivariate regression blended with scenario analysis to capture macro swings and project delays.
Data Validation & Update Cycle
Outputs pass a two-step peer review; variance thresholds of ±5 percent trigger reruns, and material press releases or M&A moves prompt mid-cycle tweaks. Mordor refreshes the full model annually, and a lead analyst revisits every assumption before publication.
Why Mordor's Sortation Systems Baseline Commands Trust
Published estimates often diverge because firms vary equipment scope, resale treatment, and currency conversions. For example, a global consultancy values 2025 sales at USD 7.65 billion, whereas a trade journal focused only on parcel hubs quotes USD 2.4 billion for the same year. Our disciplined definition, yearly refresh, and cross-checks with field data keep Mordor's figure grounded yet current.
Benchmark comparison
| Market Size | Anonymized source | Primary gap driver |
|---|---|---|
| USD 5.96 B (2025) | Mordor Intelligence | - |
| USD 7.65 B (2025) | Global Consultancy A | Combines conveyor revenue and applies a uniform 8 % CAGR without primary validation |
| USD 2.40 B (2025) | Trade Journal B | Counts only parcel sorters, excluding airport baggage and industrial lines |
These contrasts show that Mordor's balanced scope and variable-level triangulation deliver a dependable baseline that strategy, capex, and procurement teams can trust.


Key Questions Answered in the Report
What is the projected value of the sortation systems market by 2031?
The market is forecast to reach USD 8.02 billion by 2031, expanding at a 5.08% CAGR.
Which sorter technology commands the largest share today?
Cross-belt systems hold 37.60% 2025 revenue and are also the fastest-growing platform at a 7.52% CAGR.
Why is software gaining importance in sortation projects?
Software enables real-time optimisation and predictive routing, driving a 7.01% CAGR that outpaces hardware growth.
Which region offers the highest growth opportunity for suppliers?
APAC combines 35.90% current share with an 8.25% CAGR due to Chinese and Indian logistics investments.
How is airline baggage handling influencing sorter demand?
Global hub upgrades, such as Seattle-Tacoma and Salt Lake City, require high-speed, RFID-enabled cross-belt solutions to cut transfer times and energy use.
What strategic moves signal consolidation in the sector?
Vanderlande’s EUR 300 million purchase of Siemens Logistics and Toyota Industries’ ownership illustrate a pivot toward integrated, full-suite service capability.
Page last updated on:


