Market Overview
| Study Period | 2020 - 2031 |
|---|---|
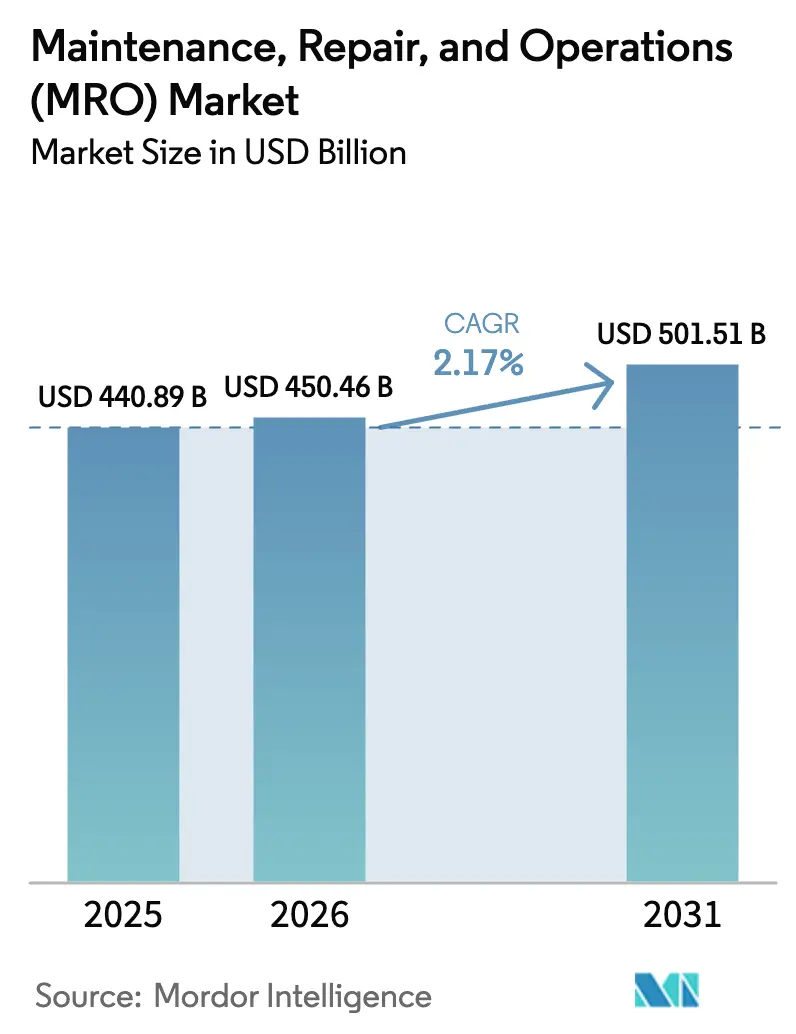
| Market Size (2026) | USD 450.46 Billion |
| Market Size (2031) | USD 501.51 Billion |
| Growth Rate (2026 - 2031) | 2.17% CAGR |
| Fastest Growing Market | Asia Pacific |
| Largest Market | North America |
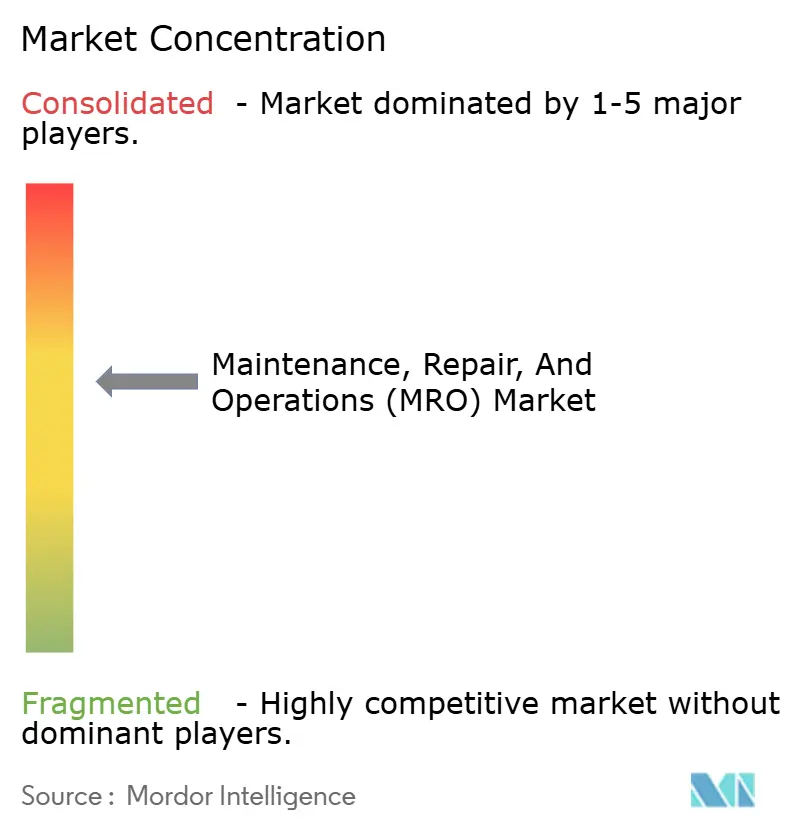
| Market Concentration | Medium |
Major Players *Disclaimer: Major Players sorted in no particular order Image © Mordor Intelligence. Reuse requires attribution under CC BY 4.0. | |
Maintenance, Repair, And Operations (MRO) Market Analysis by Mordor Intelligence
The Maintenance, Repair, And Operations Market size is projected to be USD 440.89 billion in 2025, USD 450.46 billion in 2026, and reach USD 501.51 billion by 2031, growing at a CAGR of 2.17% from 2026 to 2031. The growth profile is modest because the sector is mature; however, digital work orders, condition-based monitoring, and digital procurement are steadily reshaping cost structures and service models. Industrial MRO held the largest revenue share in 2025, while the electrical category is expanding at the fastest rate as utilities and heavy-industry operators replace aging transformers and switchgear. End-user spending is focusing on predictive maintenance tools that reduce downtime and labor hours, while procurement teams are transitioning toward integrated supply contracts that shift inventory risk to distributors. At the same time, regional re-shoring programs in North America and Europe and accelerated capital spending on renewable energy in the Asia Pacific are creating new addressable volumes for distributors that can combine technical support with rapid fulfillment.
Key Report Takeaways
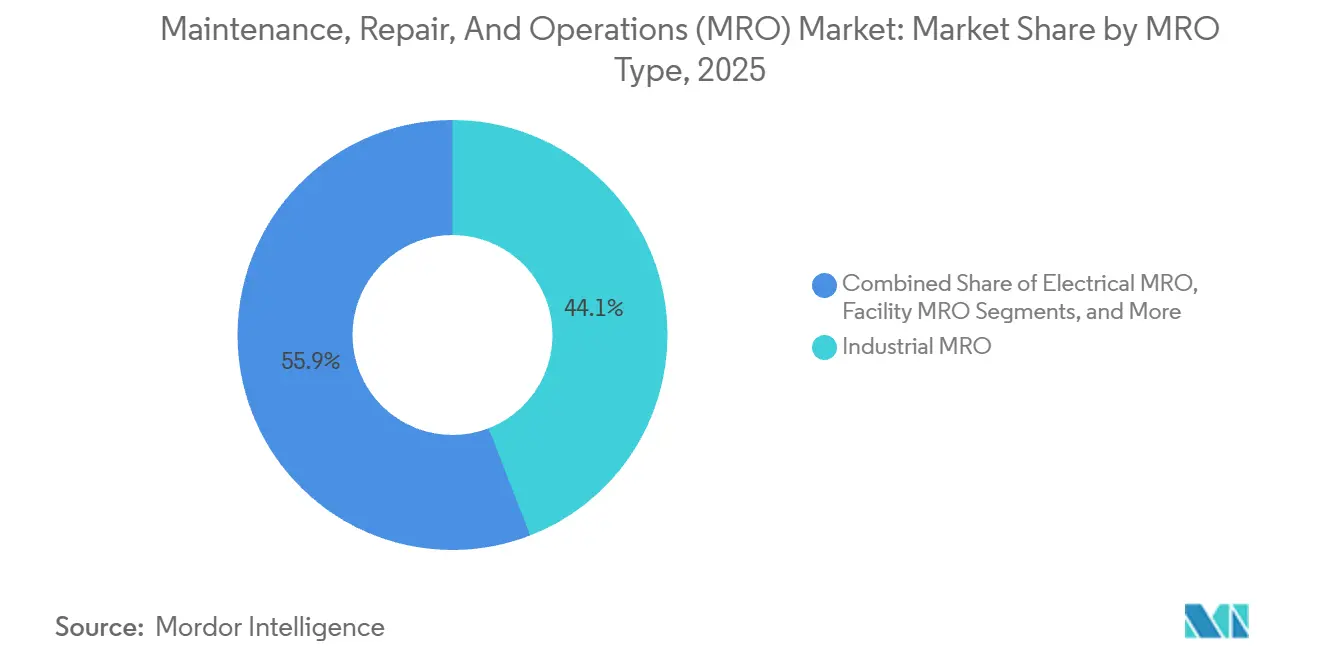
- By MRO type, industrial components led with 44.12% of the maintenance, repair, and operations market share in 2025, while electrical parts are forecast to expand at a 3.91% CAGR through 2031.
- By end-use, manufacturing accounted for 31.28% of revenue in 2025, whereas healthcare demand is advancing at a 4.73% CAGR to 2031.
- By sourcing model, in-house programs retained 57.48% share in 2025, yet integrated supply contracts are growing at a 3.12% CAGR.
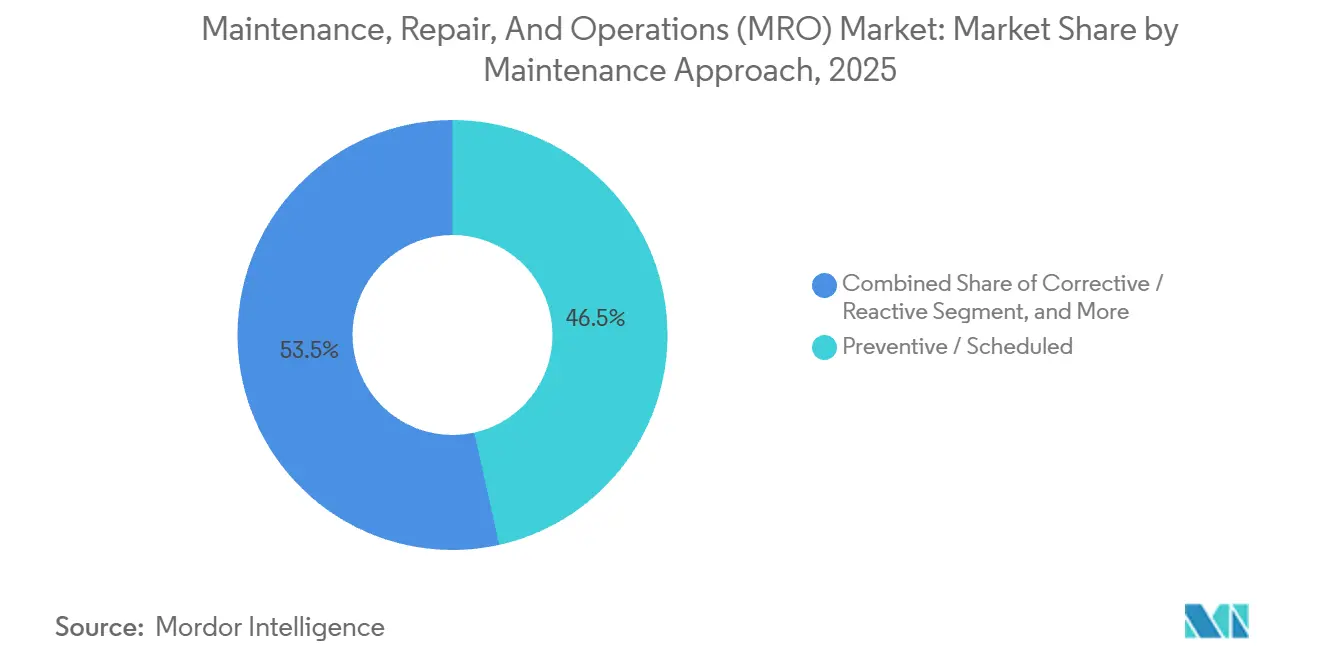
- By maintenance approach, preventive routines captured 46.51% share in 2025 and predictive strategies are rising at a 4.57% CAGR.
- By distribution channel, offline branches generated 62.12% of 2025 revenue, while online platforms are expanding at a 3.48% CAGR.
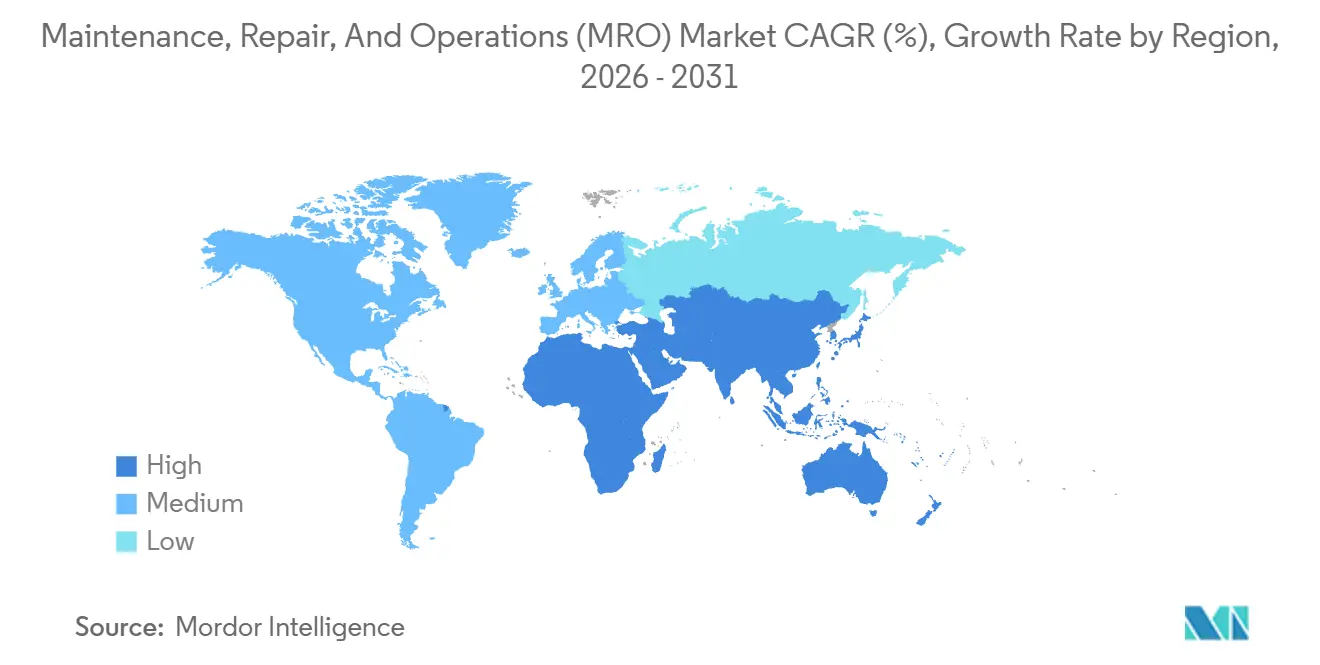
- By geography, North America held 34.86% of 2025 sales, but Asia Pacific is scaling at a 5.86% CAGR through 2031.
Note: Market size and forecast figures in this report are generated using Mordor Intelligence’s proprietary estimation framework, updated with the latest available data and insights as of January 2026.
Global Maintenance, Repair, And Operations (MRO) Market Trends and Insights
Drivers Impact Analysis*
| Driver | (~) % Impact on CAGR Forecast | Geographic Relevance | Impact Timeline |
|---|---|---|---|
| Rising Adoption of Industry 4.0-Enabled Smart Factories | +0.6% | Global – strong in Germany, United States, Japan, South Korea | Medium term (2-4 years) |
| Supply-Chain Resiliency Programs Boosting MRO Stocking | +0.4% | North America and Europe, spillover to Asia Pacific | Short term (≤ 2 years) |
| Shift Toward Predictive Maintenance and IIoT Sensors | +0.5% | Global – early adoption in manufacturing and energy | Medium term (2-4 years) |
| E-Commerce Penetration in B2B MRO Distribution | +0.3% | North America, Western Europe, urban Asia Pacific | Short term (≤ 2 years) |
| Near-Shoring of Manufacturing in North America and Europe | +0.3% | United States, Mexico, Central Europe | Long term (≥ 4 years) |
| Surge in Energy-Efficiency Retrofits of Aging Facilities | +0.2% | North America and Europe, selective Middle East adoption | Medium term (2-4 years) |
| Source: Mordor Intelligence | |||


Rising Adoption of Industry 4.0-Enabled Smart Factories
Automated production lines now integrate sensors, edge gateways, and cloud analytics that trigger maintenance work orders without human intervention. A 2025 survey revealed that 62% of discrete manufacturers in North America and Europe have at least one predictive-maintenance deployment, with a median payback period of 14 months.[1]International Society of Automation, “Predictive Maintenance Adoption Survey,” ISA.ORG Automotive and semiconductor facilities view downtime as incurring an hourly cost of USD 500,000 to USD 2 million, resulting in a rising demand for vibration sensors, thermal cameras, and advanced analytics. Siemens reported 1.2 million connected assets on its MindSphere platform in 2025, cutting mean time to repair by 18% across user sites. These dynamics raise the technical requirements for distributors, who must provide integration support in addition to commodity parts. As sensor density climbs, the maintenance, repair, and operations market gains a steady tailwind from recurring replacement and calibration needs.
Supply-Chain Resiliency Programs Boosting MRO Stocking
Post-pandemic procurement strategies emphasize higher safety-stock levels and multisource contracts for critical spares. The Institute for Supply Management reported that 58% of North American manufacturers lifted on-site inventories by 20-40% in 2024. Distributors with vendor-managed inventory platforms consequently grew contract counts and average order values as clients shifted carrying costs off the balance sheet. W.W. Grainger’s KeepStock program expanded its customer base 12% in 2025, underscoring the linkage between resiliency mandates and service-based models. Local stocking and faster fulfillment also insulate plants from geopolitical shocks, reinforcing client preference for suppliers that blend branch density with digital forecasting tools.
Shift Toward Predictive Maintenance and IIoT Sensors
Field trials by the National Institute of Standards and Technology demonstrated that neural-network models predict bearing failures with 92% accuracy up to two weeks in advance. Energy utilities and process plants value this foresight because a single turbine trip can translate into multi-million-dollar penalties. General Electric stated that its Asset Performance Management software now oversees 400,000 industrial assets, extending average equipment life 11% and trimming spare-parts consumption 8%. The resulting virtuous cycle of more sensors, richer data, and sharper algorithms reinforces recurring demand for IIoT hardware and sensor-grade cabling, strengthening the growth outlook for the maintenance, repair, and operations market.
E-Commerce Penetration in B2B MRO Distribution
Online buying accelerates because procurement teams prefer real-time inventory visibility, parametric search, and one-click reordering. Amazon Business recorded a 22% year-over-year rise in MRO category sales to 6 million corporate customers in 2025. Fastenal’s digital channels crossed the 50% revenue threshold, with average ticket values 14% higher than branch sales thanks to cross-sell algorithms. Distributors are therefore investing in predictive search, API connectivity with enterprise resource planning systems, and next-day delivery logistics. This digital migration pressures branch-centric incumbents but unlocks growth for suppliers that combine e-commerce storefronts with technical field support.
Restraints Impact Analysis*
| Restraint | (~) % Impact on CAGR Forecast | Geographic Relevance | Impact Timeline |
|---|---|---|---|
| Persistent Skilled-Technician Shortages | -0.3% | Global – acute in North America and Western Europe | Long term (≥ 4 years) |
| Fragmented SKU Universe Inflating Inventory Costs | -0.2% | Global – burdensome for mid-sized distributors | Medium term (2-4 years) |
| Cyber-Security Risks in Connected Maintenance Systems | -0.1% | Global – concentrated in high OT-connectivity sectors | Short term (≤ 2 years) |
| Inflation-Driven Price Volatility of Industrial Inputs | -0.3% | Global – severe in commodity-intensive categories | Short term (≤ 2 years) |
| Source: Mordor Intelligence | |||
Persistent Skilled-Technician Shortages
The U.S. Bureau of Labor Statistics found that 28% of industrial maintenance workers were 55 years or older in 2025, while fewer than 12% were under 25.[2]U.S. Bureau of Labor Statistics, “Producer Price Index – Industrial Supplies,” BLS.GOV Median wages for technicians rose 8% year-over-year, outpacing broader pay trends and eroding maintenance budgets. Unfilled roles often force plants to defer preventive tasks, exposing them to expensive reactive repairs and making it harder to capitalize on predictive-maintenance platforms. Training pipelines for PLC, VFD, and IIoT competencies remain constrained, extending this restraint into the long-term horizon.
Inflation-Driven Price Volatility of Industrial Inputs
Steel, copper, and polymer resins registered Producer Price Index increases of 4.2% in 2024 and 3.1% in 2025, raising acquisition costs for bearings, motors, and electrical components. Copper averaged USD 9,200 per metric ton in 2025, up 11% from 2023. Volatile inputs squeeze distributor margins and complicate plant-level budgeting, often prompting fixed-price contracts that reduce flexibility when spot prices fall. Inventory exposure rises as well, because holding high-value spares during inflationary periods ties up more working capital.
*Our forecasts treat driver/restraint impacts as directional, not additive. The impact forecasts reflect baseline growth, mix effects, and variable interactions.
Segment Analysis
By MRO Type: Industrial Breadth, Electrical Momentum
Industrial components generated 44.12% of 2025 revenue, cementing their role as the backbone of the maintenance, repair, and operations market. Bearings, pumps, gearboxes, and hydraulics span every heavy-industrial vertical, so base-load demand remains sticky even during economic slowdowns. Aftermarket pump rebuilds and conveyor-chain replacements drove repeat sales, while localized supply agreements with mining and cement producers created high-margin service annuities. Distributors built specialized repair shops, enabling in-house machining and balancing that anchor customer relationships beyond simple parts sales. Meanwhile, electrical parts are growing at a 3.91% CAGR as grid operators and industrial campuses modernize their switchgear, transformers, and motor control centers. The U.S. Department of Energy noted that 70% of domestic power transformers were over 25 years old in 2024, thereby elevating the failure risk and triggering accelerated replacement cycles.[3]U.S. Department of Energy, “Transformer Age Profile,” ENERGY.GOV Renewable-energy integration further lifts demand for arc-flash-rated gear, inverter-grade cabling, and condition-monitoring relays.
Facility MRO filters, lighting, and janitorial supplies play an indispensable but slower-growing role, as spending can be postponed during downturns without jeopardizing production uptime. Safety and personal-protective equipment benefit from stricter occupational rules, including new National Emphasis Program guidelines that mandate heat-hazard mitigation plans. Distributors increasingly bundle multi-category kits, such as vibration-sensor packages paired with alignment tools and specialty lubricants, to lift basket size and minimize procurement complexity.


By End-Use Industry: Manufacturing Dominates, Healthcare Accelerates
Manufacturing absorbed 31.28% of 2025 consumption thanks to round-the-clock operations in automotive, food and beverage, and aerospace lines. Robotics additions and higher automation densities result in larger spare-part inventories for servomotors, vision systems, and robot gearboxes. Healthcare spending, however, is climbing at a 4.73% CAGR. Hospital expansions and outpatient surgery centers require new HVAC, filtration, and sterilization systems that comply with recent infection control standards. Aging facilities built before 2000 are retrofitting their air-handling units, incorporating HEPA filtration, and installing UV-C lighting, which raises recurring service intervals for filters and belts.
Energy and utilities purchasing remains steady as turbine overhauls and substation refurbishments are nondiscretionary. Aerospace and defense aftermarket demand is buoyant because military fleets are extending airframe life through heavy structural repairs, whereas commercial airlines are cycling older narrow-body aircraft through cabin refresh programs. Construction companies, riding infrastructure stimulus, rely on rapid turnaround for hydraulic-hose kits and cutting tools, which offline branches often assemble on site.
By Sourcing Model: Integrated Supply Gains Ground
In-house storerooms controlled 57.48% of 2025 spend because many large plants value direct oversight of critical spares. Even so, integrated supply contracts are advancing at a 3.12% CAGR as finance teams seek inventory reduction and transactional efficiency. Under these agreements, distributors own the inventory, guarantee fill rates above 97%, and staff on-site personnel who manage crib access and automated dispensing. Average line-item counts shrink from tens of thousands to low thousands, cutting purchase-order volumes by as much as 80%.
Outsourced models appeal to mid-sized manufacturers aiming to reallocate buyer headcount to core production analysis. Adoption levels vary regionally, trending highest in North America and Western Europe, where service ecosystems are mature, and ISO 55000 asset-management standards are widely referenced.
By Maintenance Approach: Predictive Methods Advance
Preventive schedules still dominate with 46.51% share, reflecting decades-old “calendar or meter” philosophies that emphasize simplicity. Yet predictive and condition-based routines are growing at 4.57% CAGR as sensor retrofits fall below USD 100 per channel, pushing return-on-investment periods under 18 months. Field data show maintenance labor hours drop nearly 20% when vibration and oil-analysis alerts replace fixed intervals, while spare-parts draws fall in tandem because components are changed only when trending out of tolerance.
Corrective approaches remain relevant for low-criticality assets, but emergency purchases often carry steep premiums, typically 20-30% above contract pricing. Failure mode and effects analysis, as outlined in IEC 60812, helps plants stratify asset criticality and justify sensor budgets.
By Distribution Channel: Online Platforms Expand
Branch networks accounted for 62.12% of 2025 purchases, as machinists continue to value counter support and immediate pickup for break-fix situations. However, online channels are scaling at a 3.48% CAGR. MSC Industrial reported that digital orders accounted for 58% of revenue in 2025, with predictive-search tools helping to reduce maverick spend. Commodity categories, including fasteners, abrasives, and safety gear, are shifting fastest to e-commerce, where buyers can benchmark prices across thousands of SKUs in seconds.
Distributors counterbalance online competition by embedding vending machines and vendor-managed inventory lockers at client sites; Fastenal reached 108,000 active units in 2025. Original equipment manufacturers continue to serve captive markets that require proprietary parts and traceability, particularly in the aerospace and medical device industries.
Geography Analysis
North America held 34.86% of global revenue in 2025, anchored by a diversified industrial base, robust energy infrastructure, and branch density that offers same-day delivery to most plants. The CHIPS and Science Act plus the Inflation Reduction Act unleashed more than USD 420 billion in semiconductor and clean-energy investments, driving fresh demand for construction MRO during plant builds and electrical spares once production ramps up.[4]U.S. Department of Commerce, “CHIPS for America – Samsung Electronics,” COMMERCE.GOV Skilled-labor scarcity, however, is acute, forcing wage premiums and sparking investment in automation-supported maintenance tools.
Europe accounted for approximately 28% of 2025 spending, led by Germany, France, and the United Kingdom. The Corporate Sustainability Reporting Directive rules oblige firms to quantify their energy and Scope 1-3 emissions, prompting accelerated retrofits of motors, lighting, and HVAC systems. Sanctions after 2022 redirected supply routes away from Russia, increasing demand for localized inventories in Turkey and the Middle East. Eastern Europe, including Poland and Romania, is attracting new automotive and electronics plants, boosting regional MRO distributors.
Asia Pacific is the fastest-growing cluster with a 5.86% CAGR. China’s Ministry of Industry and Information Technology logged 420,000 semiconductor-equipment installations in 2025, fueling purchases of ultrapure-water membranes, cleanroom filters, and chemical-delivery hoses. India’s USD 1.4 trillion National Infrastructure Pipeline keeps heavy machinery fleets running, and Southeast Asia benefits from electronics assembly migrating from higher-cost geographies. High automation adoption in Japan and South Korea sustains condition-monitoring markets, while Australia’s mining sector relies on heavy-duty hydraulic and power-transmission parts.
The Middle East and Africa remain smaller in absolute terms but deliver attractive margins due to limited local supply. Saudi Arabia’s Public Investment Fund budgeted USD 100 billion for industrial diversification, generating pull-through for process-pump and electrical-gear spares. South Africa’s underground mining creates steady demand for abrasion-resistant valves and conveyor rollers, whereas Kenya’s infrastructure backlog fuels rapid sales of concrete-batch-plant spares. Latin America’s volumes are modest but volatile, tied to commodity cycles and currency fluctuations; Brazilian distributors often hedge inventory with U.S.-dollar contracts to mitigate depreciation risk.

Competitive Landscape
The maintenance, repair, and operations market remains moderately fragmented: the top five distributors, W.W. Grainger, Wurth Group, MSC Industrial, Motion Industries, and Fastenal, combined for roughly 25-30% of 2025 global revenue. Grainger operated 591 branches and stocked 1.7 million SKUs, offering next-day service to 95% of U.S. manufacturing sites. Wurth leverages a 33,000-person sales force that delivers bin replenishment and technical guidance onsite, a service premium that enhances retention. Fastenal’s vending-machine fleet generated USD 2.1 billion in sales in 2025 and provides granular usage data that feeds automated reordering algorithms.
Digital challengers, such as Amazon Business and VEVOR, capture commodity categories by combining transparent pricing with fast shipping, nudging incumbents to accelerate their web-store upgrades. MSC Industrial announced a USD 150 million warehouse automation plan that deploys autonomous mobile robots and AI-driven inventory software across 12 distribution centers, aiming to reduce order-to-ship cycle times by 30%. WESCO International integrated Anixter’s communications-cable portfolio, unlocking USD 250 million in annual synergies and cross-selling electrical gear to data-center builders.
Niche opportunities proliferate in regulated verticals. Pharmaceutical cleanrooms require ISO-class consumables, semiconductor fabs demand fluoropolymer fluid-handling parts, and offshore wind farms need corrosion-resistant fasteners. Distributors that pair application engineers with specialized inventory often command double-digit operating margins. Cybersecurity accreditation under IEC 62443 is emerging as a differentiator for suppliers serving critical-infrastructure utilities.
Maintenance, Repair, And Operations (MRO) Industry Leaders
W.W. Grainger Inc.
Würth Group
MSC Industrial Direct Co. Inc.
Motion Industries (Genuine Parts Co.)
RS Group plc (RS Components)
- *Disclaimer: Major Players sorted in no particular order

Recent Industry Developments
- December 2025: W.W. Grainger agreed to acquire a European industrial-supply distributor operating in Germany, France, and Poland, adding 12 distribution centers and 2,400 employees.
- October 2025: Fastenal deployed 6,200 additional vending machines, bringing the fleet to 108,000 units, and partnered with an IIoT platform provider to tie reordering triggers to equipment-health data.
- September 2025: WESCO International completed Anixter integration, securing USD 250 million in annual cost synergies and consolidating 47 distribution centers.
- July 2025: MSC Industrial earmarked USD 150 million for warehouse robotics and inventory-optimization software across its fulfillment network.


Research Methodology Framework and Report Scope
Market Definitions and Key Coverage
Our study treats the maintenance, repair, and operations (MRO) market as the yearly spend on consumables, spare parts, service tools, and outsourced maintenance activities that keep production equipment, buildings, and basic utilities running across manufacturing, energy, construction, healthcare, aerospace, and other facilities. The numbers are expressed in USD, report year 2025, and cover all sourcing models, maintenance approaches, and distribution channels tracked in the Table of Contents.
Scope exclusion: single-shot capital purchases of brand-new production lines or green-field plants are kept outside our baseline.
Segmentation Overview
- By MRO Type
- Industrial MRO
- Electrical MRO
- Facility MRO
- Other MRO Types
- By End-Use Industry
- Manufacturing
- Energy and Utilities
- Aerospace and Defense
- Construction
- Healthcare
- Other End-Use Industries
- By Sourcing Model
- In-House
- Outsourced (3rd-Party / IFM)
- Integrated Supply (VMI / Integrated-MRO)
- By Maintenance Approach
- Preventive / Scheduled
- Corrective / Reactive
- Predictive / Condition-Based
- By Distribution Channel
- Offline Distributors
- Online / E-Commerce
- Direct from OEM
- By Geography
- North America
- United States
- Canada
- Mexico
- South America
- Brazil
- Argentina
- Rest of South America
- Europe
- Germany
- United Kingdom
- France
- Italy
- Spain
- Russia
- Rest of Europe
- Asia Pacific
- China
- Japan
- South Korea
- India
- Australia
- New Zealand
- Rest of Asia Pacific
- Middle East
- United Arab Emirates
- Saudi Arabia
- Turkey
- Rest of Middle East
- Africa
- South Africa
- Nigeria
- Kenya
- Rest of Africa
- North America
Detailed Research Methodology and Data Validation
Primary Research
After secondary collection, Mordor Intelligence analysts interviewed maintenance planners at large process plants, sourcing managers at tier-one distributors, and regional service integrators across North America, Europe, and Asia. These conversations refined our assumptions on typical contract sizes, spares wear-out rates, and the shift toward predictive maintenance platforms, ensuring the model reflects on-ground realities rather than desk-only signals.
Desk Research
We gathered foundational evidence from public repositories such as UN Comtrade shipment codes, the US Bureau of Labor Statistics Producer Price Index for maintenance supplies, Eurostat Prodcom tables, and India's MOSPI Annual Survey of Industries, which signal volume, pricing, and plant counts. Trade association portals like the National Association of Manufacturers, International Facility Management Association, and the International Trade Union Confederation helped us gauge labor hours and compliance costs. Company 10-Ks, investor decks, and major press releases enriched spend patterns, while D&B Hoovers and Dow Jones Factiva provided screened financials for key service contractors and distributors. These sources illustrate our desk work and are not an exhaustive list of materials referenced by Mordor analysts.
Market-Sizing & Forecasting
A top-down demand pool was first built from industrial GDP, fixed-asset stock, and facility floor-space statistics, which are then multiplied by historical MRO intensity ratios. Supplier roll-ups and sampled average selling price multiplied by volume checks supplied selective bottom-up anchors that helped us tune totals. Key market fingerprints inside the model include average frequency of scheduled shutdowns, e-commerce share of indirect spend, inflation-adjusted tool prices, and adoption curves for condition-monitoring sensors. A multivariate regression, validated through scenario analysis, projects each driver to 2030 and feeds the CAGR. Gaps in regional distributor revenues were bridged by applying weighted channel mark-ups sourced from primary respondents.
Data Validation & Update Cycle
Outputs pass two analyst reviews, variance checks against historical series, and a senior sign-off. We refresh every twelve months, with interim updates if currency shocks, regulation changes, or major plant shutdowns materially alter any driver. Before release, an analyst reruns the model so clients receive a current snapshot.
Why Mordor's MRO Baseline Commands Reliability
Published estimates often differ because firms pick unique scopes, pricing references, and refresh cadences. Our disciplined definition, driver set, and annual update rhythm anchor a steady baseline clients can replay.
Key gap drivers include whether indirect consumables are bundled with capital spares, the breadth of end-use industries covered, conversion-rate timing, and the use of list versus transacted prices.
Benchmark comparison
| Market Size | Anonymized source | Primary gap driver |
|---|---|---|
| USD 440.8 B (2025) | Mordor Intelligence | - |
| USD 700.8 B (2025) | Global Consultancy A | Includes wholesale spare-parts resale and catalogs only three maintenance approaches |
| USD 711.5 B (2025) | Industry Journal B | Applies list prices and omits distributor margin compression factors |
| USD 692.1 B (2025) | Regional Consultancy C | Uses 2024 plant census without adjusting for closures or new capacity additions |
The comparison shows that results swing widely when scope and price bases shift. By centering on clearly stated inclusions, verified utilization ratios, and repeatable adjustments, Mordor Intelligence delivers a balanced, transparent figure that decision-makers can trust.


Key Questions Answered in the Report
How large is the maintenance, repair, and operations market in 2026?
The maintenance, repair, and operations market size is USD 450.46 billion in 2026 and is projected to reach USD 501.51 billion by 2031 at a 2.17% CAGR.
Which MRO product category is growing fastest?
Electrical MRO parts, covering transformers, switchgear, and sensors, are forecast to expand at a 3.91% CAGR through 2031 as utilities modernize aging grids.
Why are integrated supply contracts gaining traction?
Integrated supply models shift inventory ownership to distributors, cut purchase-order volumes, and deliver guaranteed fill rates, which appeals to finance teams aiming to reduce working capital.
What is driving predictive maintenance adoption?
Falling sensor costs, cloud analytics accuracy, and documented reductions in downtime and spare-parts usage are pushing plants to transition from time-based routines to condition-based strategies.
Which region is expected to see the fastest MRO growth?
Asia Pacific is projected to advance at a 5.86% CAGR, propelled by semiconductor capacity additions in China and large-scale infrastructure projects in India and Southeast Asia.
How concentrated is the competitive landscape?
The top five distributors hold roughly 25-30% of global revenue, indicating moderate consolidation with significant share still available to regional and digital specialists.
Page last updated on:


