Market Overview
| Study Period | 2020 - 2031 |
|---|---|
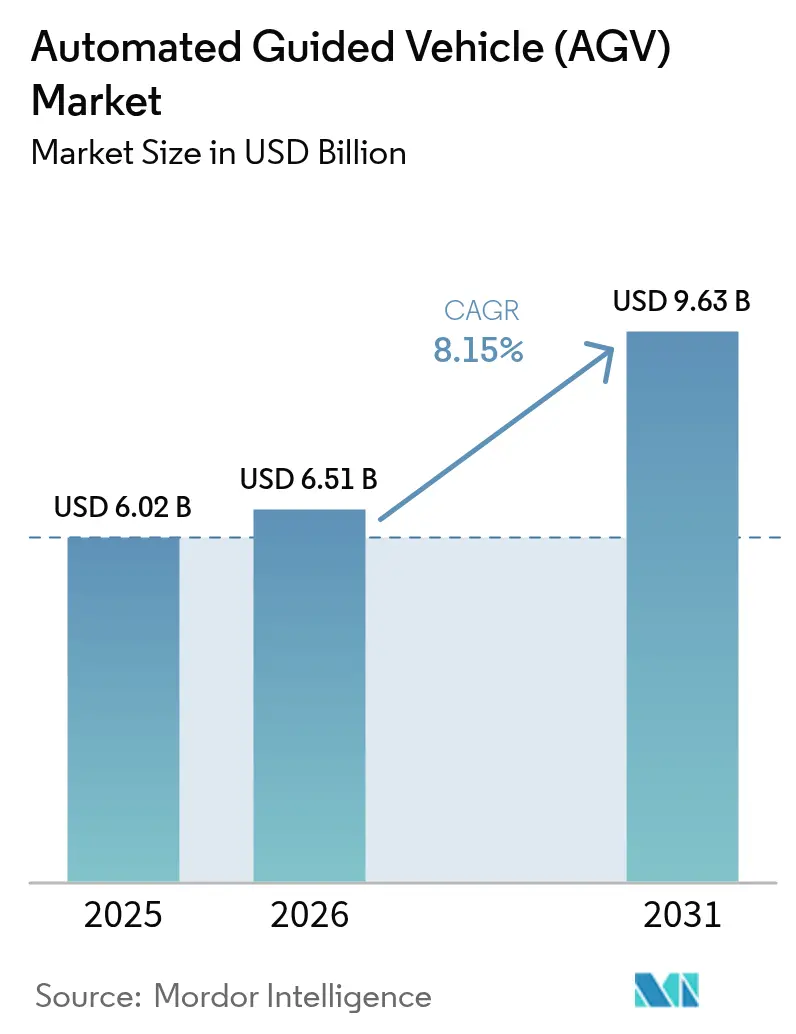
| Market Size (2026) | USD 6.51 Billion |
| Market Size (2031) | USD 9.63 Billion |
| Growth Rate (2026 - 2031) | 8.15% CAGR |
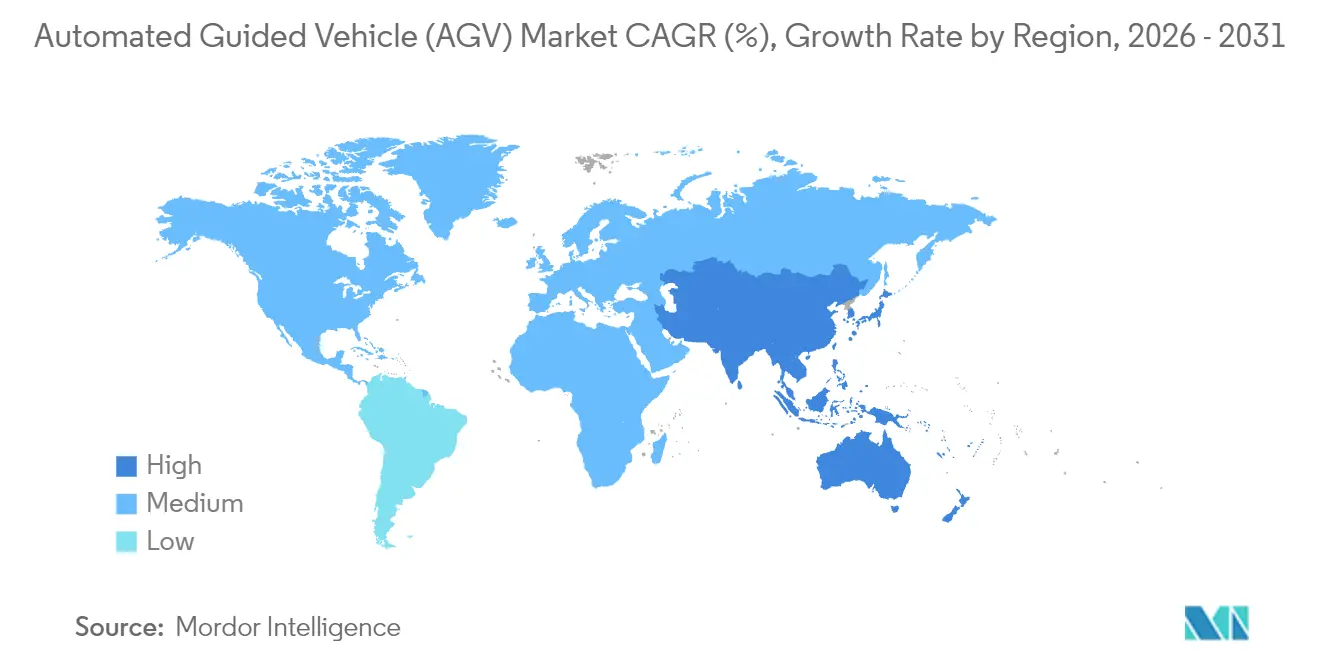
| Fastest Growing Market | Asia Pacific |
| Largest Market | North America |
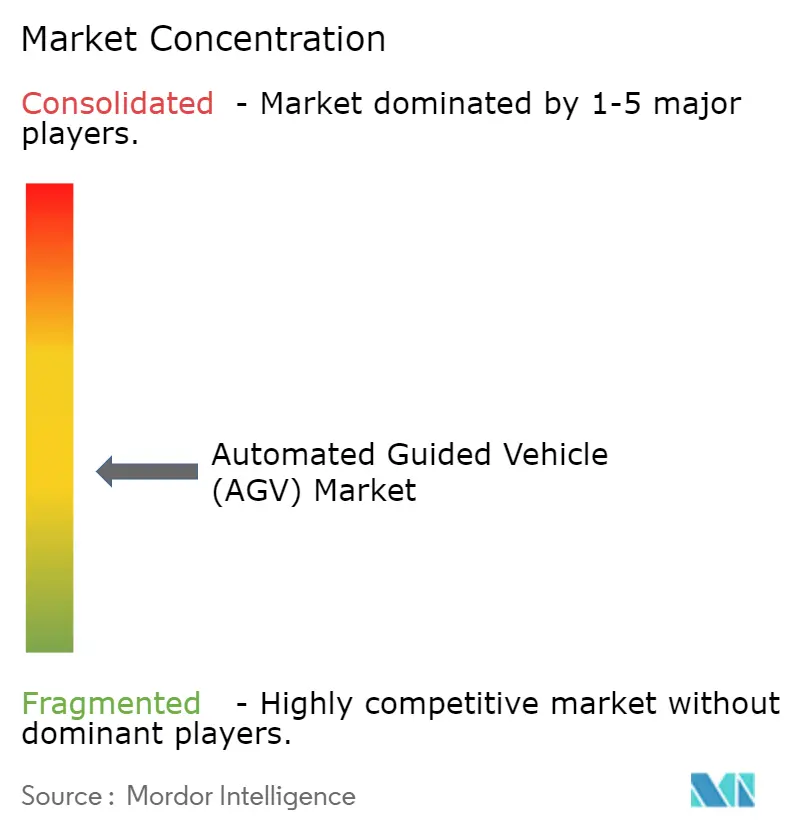
| Market Concentration | Medium |
Major Players *Disclaimer: Major Players sorted in no particular order Image © Mordor Intelligence. Reuse requires attribution under CC BY 4.0. | |
Automated Guided Vehicle (AGV) Market Analysis by Mordor Intelligence
The Automated Guided Vehicle market size is expected to grow from USD 6.02 billion in 2025 to USD 6.51 billion in 2026 and is forecast to reach USD 9.63 billion by 2031 at 8.15% CAGR over 2026-2031.
Intensifying e-commerce order spikes, persistent labor shortages, and the need for round-the-clock, error-free material handling are underpinning this trajectory. Operators are turning to autonomous mobile fleets because peak-season order volumes can climb 300-400%, a level traditional manual processes cannot sustain.[1]Locus Robotics, “How to Handle Warehouse Labor Challenges with Automation,” locusrobotics.com Private 5G networks now provide the deterministic connectivity AGVs require, delivering 20% productivity gains and 15% lower capex than Wi-Fi in early rollouts.[2]Ericsson, “5G Private Networks for Industry Productivity,” ericsson.com AI-enabled navigation, most notably Visual SLAM, cuts commissioning time by 20% and allows layout re-configuration without physical guides.[3]ABB, “ABB Unveils Innovative Mobile Robot with Visual SLAM AI-technology,” abb.com Heightened cybersecurity focus and looming rare-earth supply constraints temper enthusiasm, yet neither risk has slowed procurement to date.
Key Report Takeaways
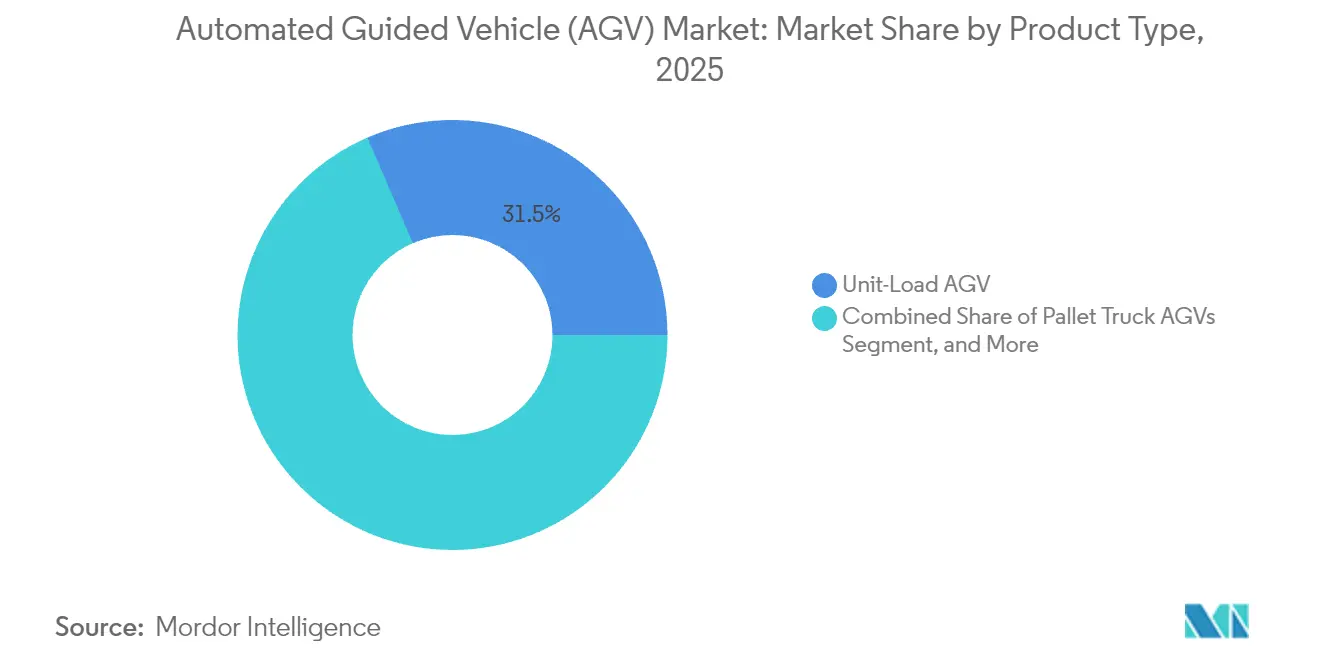
- By product type, Unit-Load AGVs held 31.48% of the automated guided vehicle market share in 2025; Automated Forklift AGVs are projected to register an 8.54% CAGR through 2031.
- By end-user industry, automotive accounted for 34.63% of 2025 revenue, while retail and e-commerce are expected to advance at an 8.18% CAGR to 2031.
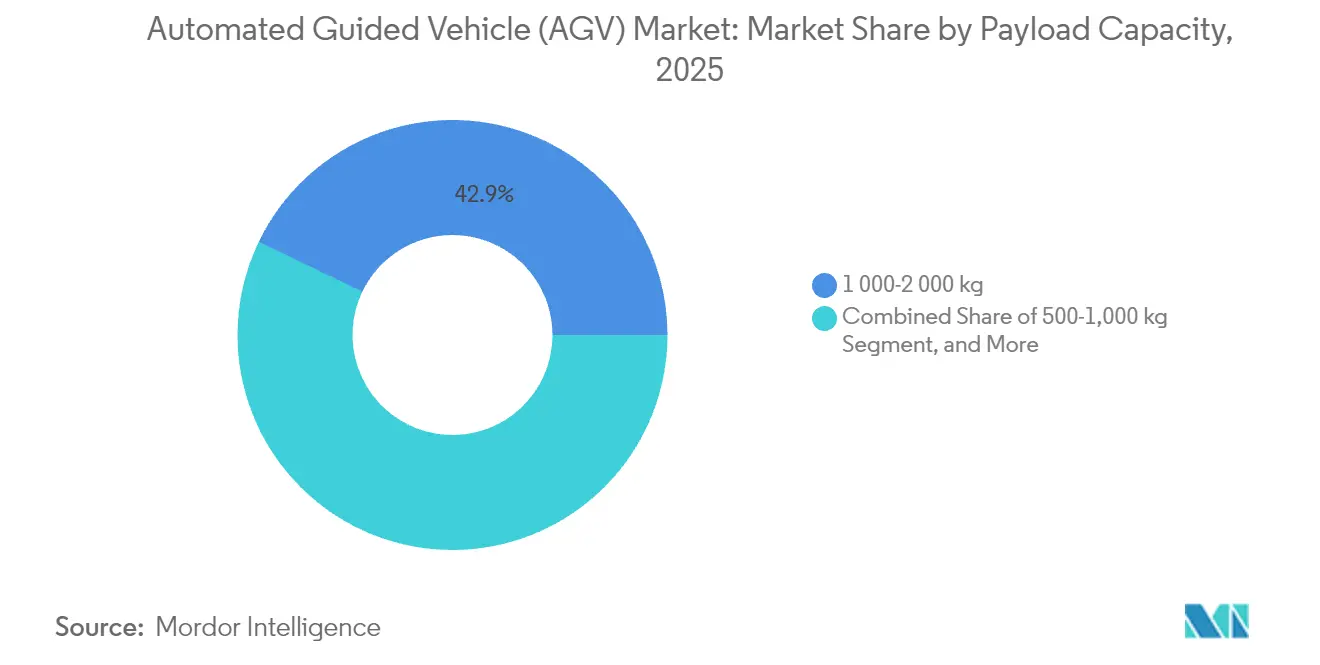
- By payload capacity, the 1,000-2,000 kg class captured 42.86% in 2025; sub-500 kg vehicles are set for 8.94% CAGR expansion to 2031.
- By application, material handling and transportation represented 35.28% of 2025 sales; order-picking and sortation should climb at an 8.75% CAGR through 2031.
- By geography, North America led with 37.07% revenue share in 2025, whereas Asia Pacific is poised for the fastest 8.36% CAGR to 2031.
Note: Market size and forecast figures in this report are generated using Mordor Intelligence’s proprietary estimation framework, updated with the latest available data and insights as of 2026.
Global Automated Guided Vehicle (AGV) Market Trends and Insights
Drivers Impact Analysis*
| Driver | (~) % Impact on CAGR Forecast | Geographic Relevance | Impact Timeline |
|---|---|---|---|
| Rapid growth of e-commerce fulfillment automation | +2.1% | Global, with concentration in North America and EU | Medium term (2-4 years) |
| Escalating labor costs and workforce scarcity | +1.8% | Global, particularly acute in developed markets | Short term (≤ 2 years) |
| Advancements in AI-enabled navigation and sensor suites | +1.5% | Global, led by technology adoption in Asia Pacific | Medium term (2-4 years) |
| Surge in "dark warehouse" adoption among SMEs | +1.2% | Asia Pacific core, spill-over to North America | Long term (≥ 4 years) |
| Integration with private 5G networks for deterministic control | +0.9% | Advanced markets: North America, EU, Japan, South Korea | Medium term (2-4 years) |
| ESG-driven automation incentives in developed markets | +0.7% | EU, North America, with selective Asia Pacific adoption | Long term (≥ 4 years) |
| Source: Mordor Intelligence | |||
Rapid Growth of E-commerce Fulfillment Automation
Omnichannel retail has pushed the automated guided vehicle market beyond efficiency gains and into business-continuity territory. Picking functions absorb roughly 55% of warehousing costs, prompting Kroger, Ocado and other large retailers to quadruple their fleets of goods-to-person robots to keep same-day-delivery promises. Real-time links between AGVs and warehouse-management software are trimming material-handling expenses by 70%. Urban micro-fulfillment sites, often below 1,000 m², have become viable thanks to slimmer AGV form factors that maneuver in tight corridors. Modular procurement models allow smaller merchants to add vehicles as order volumes escalate, insulating them from large upfront bets. Collectively, these changes ensure the automated guided vehicle market continues scaling on the back of e-commerce growth.
Escalating Labor Costs and Workforce Scarcity
Warehousing attrition routinely exceeds 75%, and a global shortfall of 85 million workers is expected by 2030.[4]Honeywell, “The Future of Warehouse Operations: Embracing a Hybrid Labor Management Approach,” honeywell.com In Japan, autonomous forklifts priced at 15 million yen still outcompete manual units because the labor pipeline is crumbling. Documented installations show payback in as little as eight months, strengthening the internal-rate-of-return case for AGVs. Round-the-clock operation without fatigue adds further value, while hybrid workforces pairing people with robots improve both throughput and job satisfaction. Labor scarcity therefore shifts AGV adoption from discretionary to mandatory in many distribution centers, powering growth across the automated guided vehicle market.
Advancements in AI-enabled Navigation and Sensor Suites
Infrastructure-free navigation marks a cost curve break. Visual SLAM eliminates magnetic tape and reflectors, shaving weeks off installation timelines. LiDAR and optical fusion raise detection accuracy, allowing AGVs to mingle safely with workers at higher speeds. Edge computing pushes sub-millisecond decision-making to the vehicle, essential for higher payload classes. Predictive routing algorithms have lifted productivity by 35%, proving that software sophistication, not chassis hardware, now anchors competitive differentiation. These gains lower total cost of ownership, enabling mid-tier facilities to join the automated guided vehicle market earlier in their growth cycles.
Surge in “Dark Warehouse” Adoption Among SMEs
China’s 81,000 m² lights-out smartphone factory produces 10 million units annually with no on-floor labor, illustrating how SMEs can leapfrog incremental automation steps Global warehouse-automation spending is projected to hit USD 55 billion by 2030, with SMEs the primary growth engine. Time-savings above 50% in order processing have been captured when robotic-process-automation platforms link with AGVs. Government digital-innovation grants, Singapore’s Logistics Industry Digital Plan is a template, defray system costs and inject technical skills into the labor force. These incentives, plus low-risk leasing models, widen adoption and deepen the automated guided vehicle market penetration among smaller operators.
Restraints Impact Analysis*
| Restraint | (~) % Impact on CAGR Forecast | Geographic Relevance | Impact Timeline |
|---|---|---|---|
| High upfront capital expenditure for SMEs | -1.4% | Global, particularly acute in emerging markets | Short term (≤ 2 years) |
| Shortage of multi-disciplinary maintenance technicians | -0.9% | Global, with skills gap most pronounced in developed markets | Medium term (2-4 years) |
| Cyber-security liabilities in fleet management software | -0.6% | Global, with heightened concerns in North America and EU | Medium term (2-4 years) |
| Scarcity of rare-earth materials for high-torque AGV motors | -0.5% | Global, with supply chain dependencies on China | Long term (≥ 4 years) |
| Source: Mordor Intelligence | |||
High Upfront Capital Expenditure for SMEs
Initial deployments range from USD 50,000 to USD 500,000 and can strain thin margins, especially where borrowing costs run high. Documented labor-intensive use cases, however, hit breakeven in 8–18 months when IoT inventory control accompanies the AGV rollout. Robots-as-a-Service models slash capex and embed ongoing technical support, with vendors such as Agility Robotics spearheading full-service contracts. R&D tax credits worth up to 10% and accelerated depreciation schedules under clean-industry guidelines further lighten cash burdens in North America and the EU. Despite near-term friction, financing innovations help SMEs enter the automated guided vehicle market sooner than in earlier cycles.
Shortage of Multi-disciplinary Maintenance Technicians
AGVs combine mechanical, electrical, software and network subsystems, but workforce training has lagged. ABB’s Madrid academy targets this gap after a 35% jump in worldwide AMR sales signaled looming field-service constraints. Cloud-enabled remote diagnostics cut on-site visits, while IoT-based predictive maintenance improves component life and reduces unscheduled stoppages. OEMs now co-develop curricula with technical colleges, accelerating talent pipelines. These measures blunt but do not erase the skills shortage, which remains a drag on automated guided vehicle market scalability.
*Our forecasts treat driver/restraint impacts as directional, not additive. The impact forecasts reflect baseline growth, mix effects, and variable interactions.
Segment Analysis
By Product Type: Unit-Load Dominance Faces Forklift Disruption
Unit-Load platforms captured 31.48% of 2025 sales, anchoring the automated guided vehicle market with their ability to move pallets, containers and totes across multipurpose facilities. Automated Forklift models, though smaller at present, are projected for an 8.54% CAGR, reflecting demand for vertical-reach capability and compatibility with existing racking systems. Tow-tractor variants thrive in automotive plants where heavy framed components require sequential transfer, whereas assembly-line vehicles gain ground in electronics clean rooms that favor particle-free motion.
Demand is tilting toward forklift-style vehicles because multilevel warehouses proliferate in land-constrained cities and because dual-mode manual/autonomous operation eases change-management hurdles. Pallet-truck AGVs remain the first automation step for retailers handling inbound freight, while cart and small-load designs suit high-frequency e-commerce picks. Niche opportunities endure for explosion-proof and pharmaceutical-grade units. Collectively, these dynamics underpin sustained growth of the automated guided vehicle market across all product lines.


By End-User Industry: Automotive Leadership Challenged by E-commerce Surge
Automotive manufacturers owned 34.63% of 2025 turnover, using AGVs to feed just-in-time assembly and reduce work-in-process buffers. Yet retail and e-commerce distribution centers should outpace every other vertical at an 8.18% CAGR as same-day delivery becomes non-negotiable for consumers. Food-and-beverage operators extend AGV use into refrigerated zones to sidestep labor shortages in cold environments, while electronics producers exploit millimeter-level positioning for fragile sub-assemblies, reinforcing broader adoption in the automated guided vehicles market.
Pharmaceutical logistics increasingly turns to AGVs to comply with Good Distribution Practices, and third-party logistics firms report 42% labor-hour savings after installing robot fleets. Aerospace adopters demand tight tolerance handling for fuselage sections, spawning ultra-heavy-duty designs. These cross-industry shifts indicate a broadening customer base that strengthens the automated guided vehicle market without over-reliance on any single vertical.
By Payload Capacity: Mid-Range Dominance Yields to Lightweight Growth
The 1,000–2,000 kg bracket commanded 42.86% revenue in 2025, a reflection of standard pallet dimensions and forklift equivalents. Lightweight sub-500 kg robots are forecast to grow 8.94% annually as micro-fulfillment operations emphasize rapid movement of individual cartons rather than pallet loads. Vehicles in the 500-1,000 kg range furnish flexibility for mixed SKUs, while >2,000 kg machines remain vital in automotive and aerospace settings where engines and fuselage parts demand robust platforms.
Battery innovation stretches runtime across all classes, and LFP pack prices trending toward USD 100-120 per kWh by 2025 further compress total cost of ownership. Enhanced control software achieves 99.9% inventory accuracy, reinforcing the economic logic for wider adoption. As warehouses shift to smaller-batch, higher-frequency flows, payload distribution diversity will deepen across the automated guided vehicle market.
By Application: Material Handling Core Expands to Order Picking
Material handling and transport held 35.28% of 2025 revenue, demonstrating that pallet and container moves remain AGVs’ bread and butter. Order-picking and sortation, however, will climb at an 8.75% CAGR, propelled by SKU proliferation and the economics of goods-to-person workflows. Dockside trailer loading uses AGVs to synchronize yard management with internal flow, trimming truck dwell time. Packaging and palletizing lines tie AGVs to robotic arms, closing the loop from production to shipment.
Assembly cells leverage AGVs as movable carriers, enabling reconfigurable production for high-mix manufacturing. Cold-chain environments adopt sealed, insulated vehicles to preserve temperature integrity, while hazardous-materials handlers remove employees from explosive or toxic zones. Unified fleet-management platforms now dispatch vehicles across multiple task types, pushing asset utilization higher and strengthening the automated guided vehicle market size economics for operators deploying mixed-application fleets.
Geography Analysis
North America retained 37.07% revenue share in 2025 in the AVG market due to hourly warehouse wages exceeding USD 25 and deeply entrenched e-commerce networks that demand high fulfillment velocity. Anchor customers such as Amazon and Walmart validate large-scale robotic deployments, which in turn create downstream supplier ecosystems. U.S. fiscal incentive, R&D credits and bonus depreciation schedules, ensure continued capital inflows even as interest rates rise, while Canada favors AGVs for cold-storage and resource-sector logistics.
Asia Pacific will log the fastest 8.36% CAGR through 2031, led by China’s “dark factory” push and Japan’s acute demographic-driven labor crunch. The region boasts the bulk of the world’s 955 private 5G networks, a connectivity edge supporting latency-sensitive AGV controls. India’s production-linked incentive schemes and ASEAN supply-chain diversification add new greenfield sites primed for automation.
Europe presents a steady, sustainability-oriented profile. The European Commission’s Clean Industrial Transition guidelines extend accelerated depreciation to robotics, accelerating replacement of energy-intensive manual processes. Germany’s automotive and machinery sectors adopt holistic Industry 4.0 architectures with AGVs at the core, while the United Kingdom prioritizes logistics hubs ringing major metropolitan areas. The Middle East, Africa and South America remain nascent but attractive for applications in mining, ports and petrochemicals where safety benefits justify investment, expanding the global automated guided vehicle market footprint.

Competitive Landscape
Market concentration is moderate. Legacy automation vendors, KUKA, ABB, Daifuku, bundle AGVs with broader control suites, differentiating on software and integration depth rather than price cutting. KION, NVIDIA and Accenture have prototyped AI-enabled “warehouses of the future,” embedding computer-vision digital twins for dynamic slotting and predictive throughput management. Toyota’s alliance with Gideon underscores a pivot toward autonomous mobile robots that blend goods-to-person and forklift capabilities.
Emerging software natives supply fleet-management layers that orchestrate multi-brand vehicles, lowering customer lock-in. Rare-earth-free motor research aims to insulate supply chains from neodymium volatility, marrying sustainability with resilience. Cybersecurity hardening has become table stakes, with CISA guidelines shaping procurement checklists. Specialized niches-clean rooms, hazardous materials, outdoor yards-remain open for focused entrants, ensuring ongoing innovation across the automated guided vehicle market.
Automated Guided Vehicle (AGV) Industry Leaders
KUKA AG
Jungheinrich AG
SSI SCHÄFER Systems International DWC LLC
Murata Machinery, Ltd.
Daifuku Co., Ltd.
- *Disclaimer: Major Players sorted in no particular order

Recent Industry Developments
- July 2025: ABB expanded robotics operations in China through a strategic spin-off to capture fast-growing demand.
- May 2025: Hyundai opened its USD 7.6 billion Georgia EV factory featuring 300 track-free AGVs.
- March 2025: WeRide and Uber agreed to integrate autonomous vehicles on the Uber platform in Abu Dhabi.
- January 2025: Toyota Industries Corporation partnered with Gideon to advance autonomous mobile robots.


Global Automated Guided Vehicle (AGV) Market Report Scope
Automated guided vehicles (AGVs) are wholly automated transport systems that operate with unmanned vehicles. They offer many advantages, such as reduced operational costs, enhanced workforce safety, and decreased production time. The growing execution of mobile robots worldwide and measures to improve workplace safety and productivity are other factors leading to the adoption of AGVs.
The automated guided vehicle market is segmented by product type (automated forklift, automated tow/tractor/tugs, unit load, assembly line, and special purpose), end-user industry (food & beverage, automotive, retail, electronics & electrical, general manufacturing, pharmaceuticals, and other end-user industries), and geography (North America, Europe, Asia-Pacific, Latin America, and Middle East and Africa). The market sizes and forecasts are provided in terms of value (USD) for all the above segments.
By Product Type
| Automated Forklift AGVs |
| Tow / Tractor / Tug AGVs |
| Unit-Load AGVs |
| Assembly-Line AGVs |
| Pallet Truck AGVs |
| Cart and Small Load AGVs |
| Special-Purpose AGVs |
| Other Product Types |
By End-User Industry
| Automotive |
| Food and Beverage |
| Retail and E-Commerce |
| Electronics and Electrical |
| Pharmaceutical and Healthcare |
| Logistics and 3PL |
| Aerospace and Defense |
| General Manufacturing |
| Other End-User Industries |
By Payload Capacity
| Less than 500 kg |
| 500 - 1,000 kg |
| 1,000 - 2,000 kg |
| above 2,000 kg |
By Application
| Material Handling and Transportation |
| Order Picking and Sortation |
| Trailer Loading / Unloading |
| Packaging and Palletizing |
| Assembly Operations |
| Cold-Chain and Refrigerated Storage |
| Hazardous Materials Handling |
By Geography
| North America | United States | |
| Canada | ||
| South America | Brazil | |
| Argentina | ||
| Rest of South America | ||
| Europe | Germany | |
| United Kingdom | ||
| France | ||
| Italy | ||
| Spain | ||
| Russia | ||
| Rest of Europe | ||
| Asia Pacific | China | |
| Japan | ||
| South Korea | ||
| India | ||
| ASEAN | ||
| Rest of Asia Pacific | ||
| Middle East and Africa | Middle East | United Arab Emirates |
| Saudi Arabia | ||
| Turkey | ||
| Rest of Middle East | ||
| Africa | South Africa | |
| Egypt | ||
| Rest of Africa | ||
| By Product Type | Automated Forklift AGVs | ||
| Tow / Tractor / Tug AGVs | |||
| Unit-Load AGVs | |||
| Assembly-Line AGVs | |||
| Pallet Truck AGVs | |||
| Cart and Small Load AGVs | |||
| Special-Purpose AGVs | |||
| Other Product Types | |||
| By End-User Industry | Automotive | ||
| Food and Beverage | |||
| Retail and E-Commerce | |||
| Electronics and Electrical | |||
| Pharmaceutical and Healthcare | |||
| Logistics and 3PL | |||
| Aerospace and Defense | |||
| General Manufacturing | |||
| Other End-User Industries | |||
| By Payload Capacity | Less than 500 kg | ||
| 500 - 1,000 kg | |||
| 1,000 - 2,000 kg | |||
| above 2,000 kg | |||
| By Application | Material Handling and Transportation | ||
| Order Picking and Sortation | |||
| Trailer Loading / Unloading | |||
| Packaging and Palletizing | |||
| Assembly Operations | |||
| Cold-Chain and Refrigerated Storage | |||
| Hazardous Materials Handling | |||
| By Geography | North America | United States | |
| Canada | |||
| South America | Brazil | ||
| Argentina | |||
| Rest of South America | |||
| Europe | Germany | ||
| United Kingdom | |||
| France | |||
| Italy | |||
| Spain | |||
| Russia | |||
| Rest of Europe | |||
| Asia Pacific | China | ||
| Japan | |||
| South Korea | |||
| India | |||
| ASEAN | |||
| Rest of Asia Pacific | |||
| Middle East and Africa | Middle East | United Arab Emirates | |
| Saudi Arabia | |||
| Turkey | |||
| Rest of Middle East | |||
| Africa | South Africa | ||
| Egypt | |||
| Rest of Africa | |||


Key Questions Answered in the Report
How large is the automated guided vehicle market in 2026?
The automated guided vehicle market size stands at USD 6.51 billion in 2026 and is projected to reach USD 9.63 billion by 2031.
What is the forecast growth rate for AGVs through 2031?
The market is forecast to grow at an 8.15% CAGR over the 2026-2031 period.
Which region is expected to grow the fastest for AGV adoption?
Asia Pacific is projected to post the highest 8.36% CAGR through 2031, led by China and Japan.
Which is the fastest growing region in AGV Market?
Asia Pacific is estimated to grow at the highest CAGR over the forecast period (2026-2031).
Which AGV product category is expanding most rapidly?
Automated Forklift AGVs show the fastest growth trajectory with an expected 8.54% CAGR to 2031.
What is the primary driver of AGV deployment in warehouses?
E-commerce fulfillment automation, driven by the need to handle surging order volumes and labor shortages, is the leading catalyst.
Page last updated on:


