
Market Overview
| Study Period | 2020 - 2031 |
|---|---|
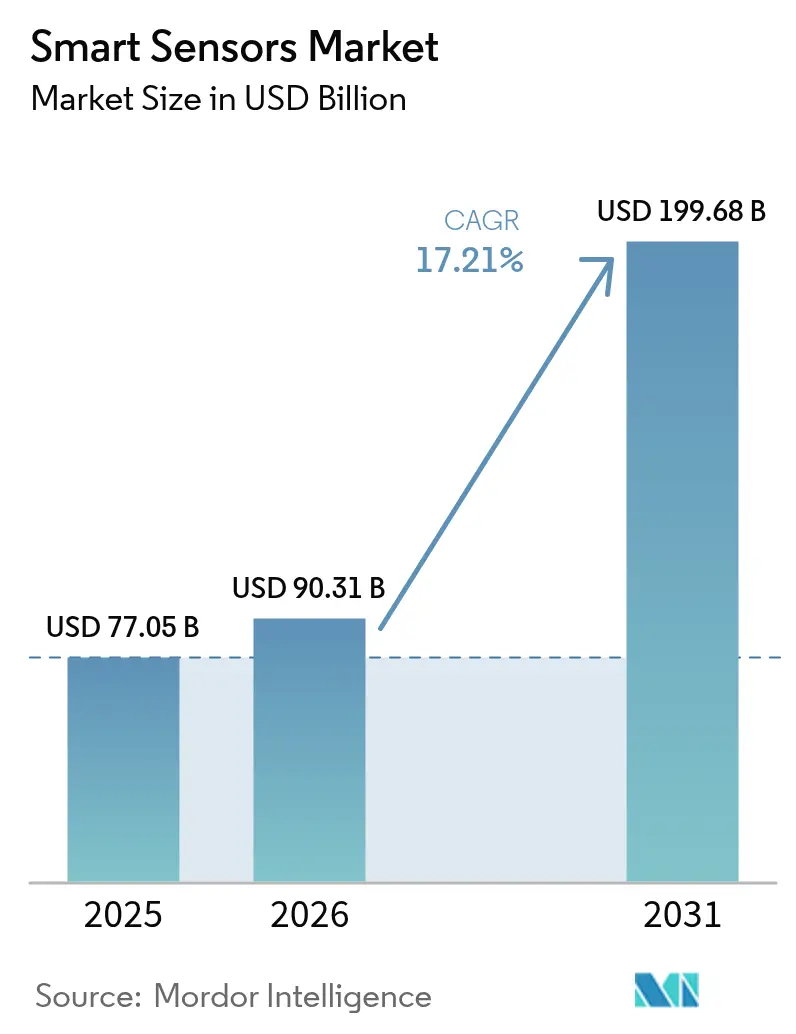
| Market Size (2026) | USD 90.31 Billion |
| Market Size (2031) | USD 199.68 Billion |
| Growth Rate (2026 - 2031) | 17.21 % |
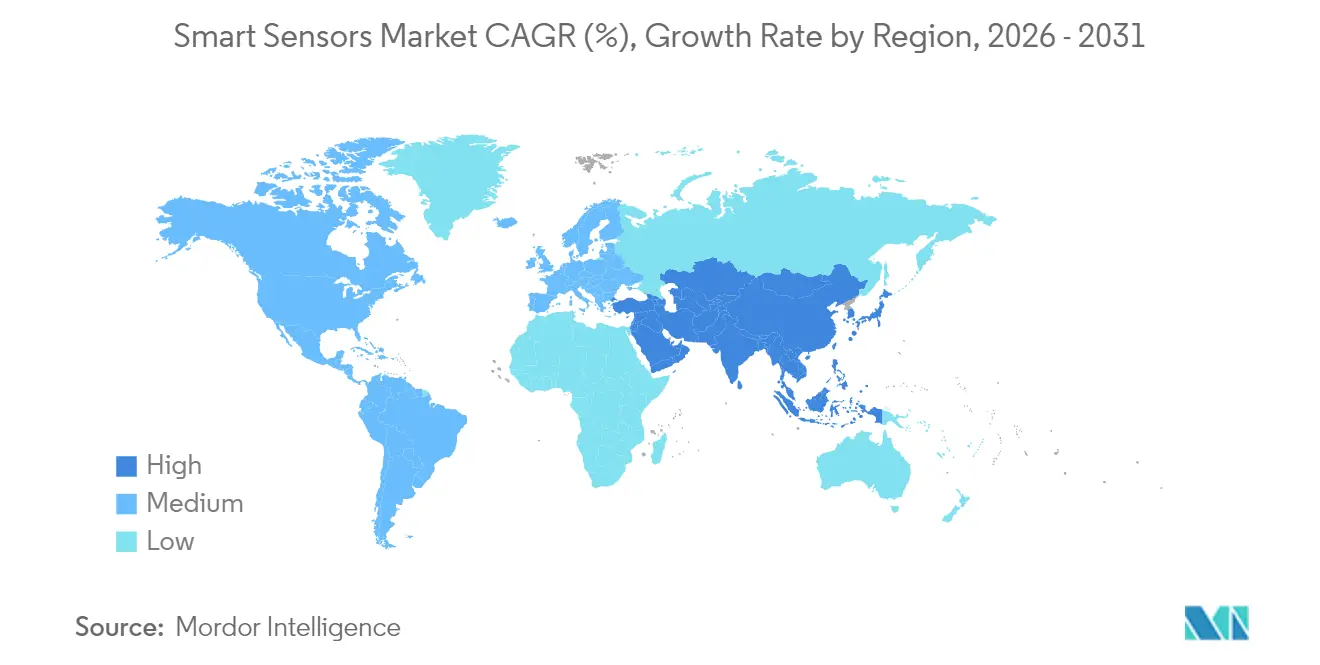
| Fastest Growing Market | Asia Pacific |
| Largest Market | North America |
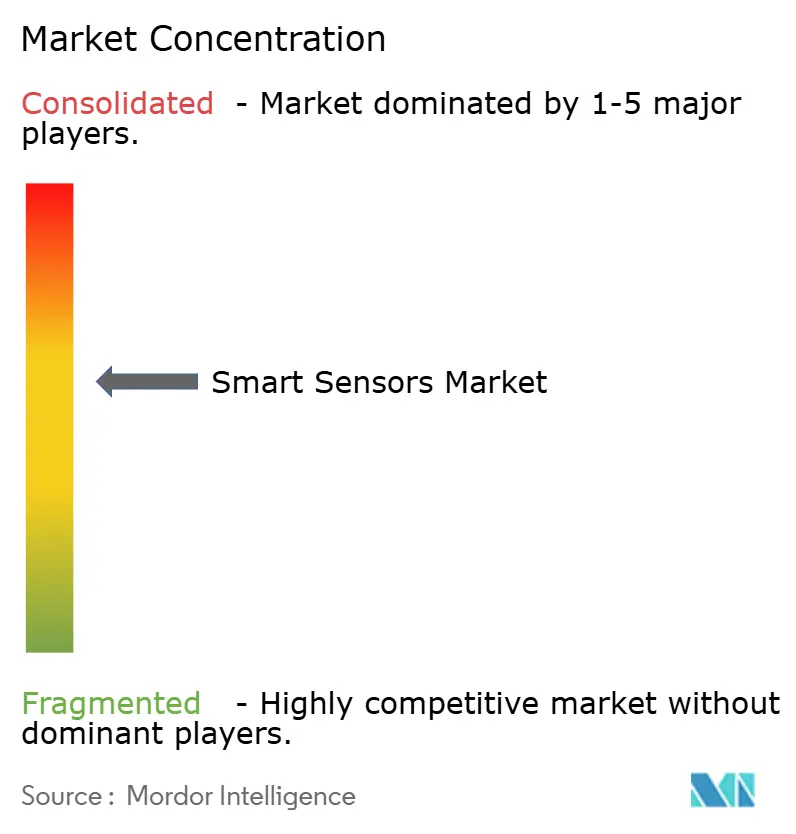
| Market Concentration | Medium |
Major Players *Disclaimer: Major Players sorted in no particular order Image © Mordor Intelligence. Reuse requires attribution under CC BY 4.0. | |
Smart Sensors Market Analysis by Mordor Intelligence
Smart sensors market size in 2026 is estimated at USD 90.31 billion, growing from 2025 value of USD 77.05 billion with 2031 projections showing USD 199.68 billion, growing at 17.21% CAGR over 2026-2031. This growth trajectory is propelled by the convergence of edge artificial intelligence, tightening automotive and healthcare regulations, and industrial automation programs that are moving enterprises from reactive monitoring to predictive intelligence. Mandatory safety features such as automatic emergency braking in vehicles and continuous patient monitoring in medical devices are translating into non-discretionary sensor demand across developed markets. At the same time, edge-AI cores embedded in the latest sensor generations eliminate latency and bandwidth bottlenecks, allowing real-time analytics within power-constrained environments. Supply-chain pressures around gallium and germanium and the race for semiconductor self-sufficiency are keeping average selling prices firm even as unit volumes rise, giving manufacturers headroom for sustained R&D investment. Over the forecast period, performance differentiation is shifting from raw sensitivity metrics to on-board intelligence, cyber-security compliance, and integration flexibility—factors now decisive in procurement shortlists.
Key Report Takeaways
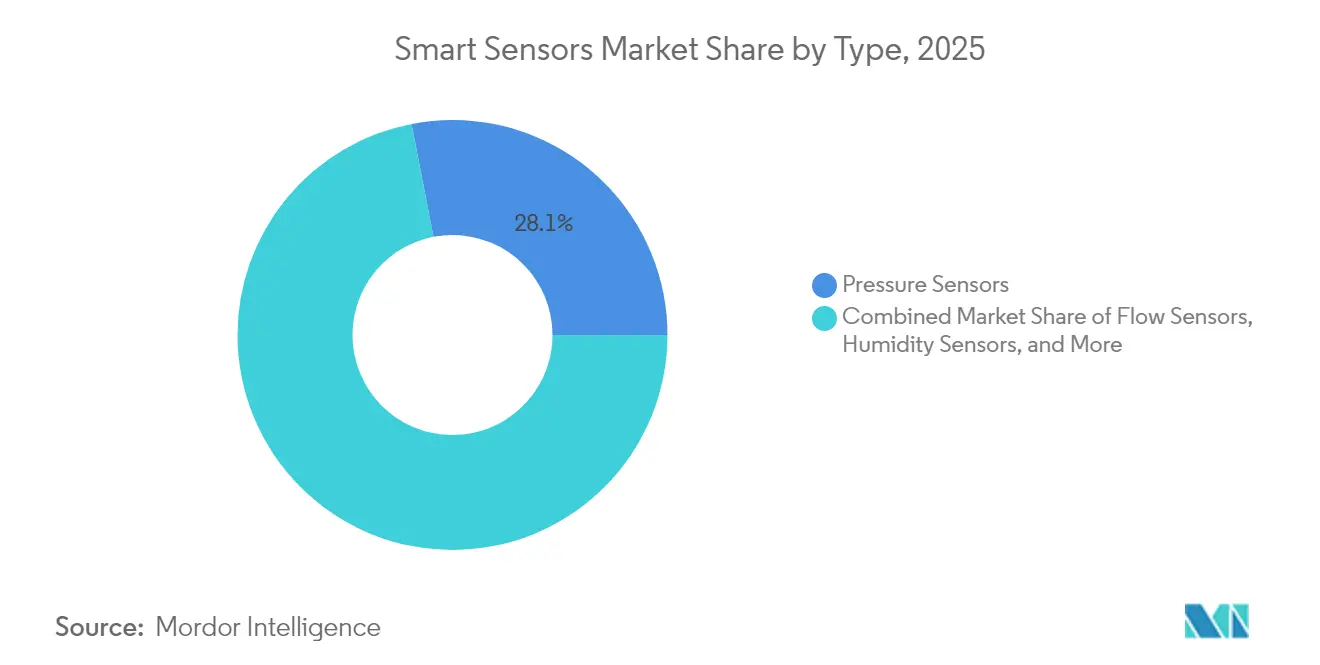
- By sensor type, pressure sensors led with 28.05% revenue share in 2025, while image sensors deliver the highest projected growth at 18.85% CAGR through 2031.
- By technology, MEMS held 45.45% of smart sensors market share in 2025, whereas quantum and photonic sensors are expected to expand at 20.95% CAGR to 2031.
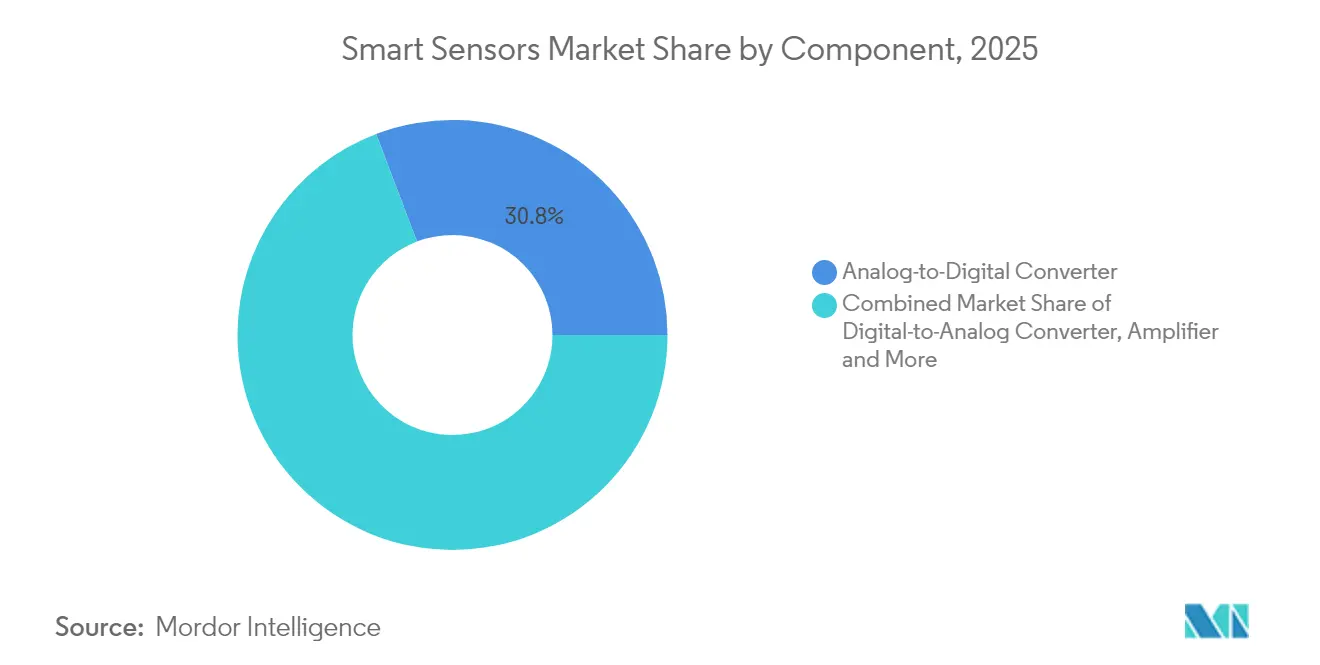
- By component, analog-to-digital converters accounted for 30.78% of the smart sensors market size in 2025; embedded AI cores are forecast to post a 23.15% CAGR from 2026-2031.
- By application, industrial automation captured 24.25% of the smart sensors market size in 2025; healthcare applications are set to accelerate at an 18.05% CAGR over the same horizon.
- By geography, Asia-Pacific commanded 44.10% revenue share in 2025 and is projected to outpace all regions at 19.15% CAGR to 2031.
Note: Market size and forecast figures in this report are generated using Mordor Intelligence’s proprietary estimation framework, updated with the latest available data and insights as of 2026.
Global Smart Sensors Market Trends and Insights
Drivers Impact Analysis*
| Driver | ( ~ ) % Impact on CAGR Forecast | Geographic Relevance | Impact Timeline |
|---|---|---|---|
| Energy-efficiency push across industrial IoT | +3.2% | Global (strongest in EU, North America) | Medium term (2-4 years) |
| Consumer-electronics sensor proliferation | +2.8% | APAC core, spill-over to North America | Short term (≤ 2 years) |
| Automotive & e-health safety mandates | +4.1% | EU and North America, expanding to APAC | Medium term (2-4 years) |
| On-sensor edge-AI lowers latency | +3.5% | Global, led by US, China, Japan | Long term (≥ 4 years) |
| Source: Mordor Intelligence | |||
Energy-efficiency Push Across Industrial IoT
Legally binding sustainability reporting is prompting manufacturers to deploy intelligent sensors that deliver measurable kWh savings and CO₂ reductions. The European Corporate Sustainability Reporting Directive requires granular energy metrics, pushing factories to install edge-AI sensors that continuously optimise HVAC, lighting, and machine utilisation. SECO’s smart CNC retrofit cut production waste by 30% and spare-parts spend by 10%, showcasing hard-dollar returns that justify fleet-wide rollouts.[1]SECO, “Smart Connected CNC Machine,” seco.com Similar results at Lech-Stahlwerke’s 5G-enabled mill have turned energy-efficiency projects into board-level priorities. As early adopters report double-digit cost reductions, laggards face competitive pressure to follow suit, creating a self-reinforcing demand cycle for intelligent sensors.
Consumer-electronics Sensor Proliferation
Smartphone and wearable OEMs now integrate up to a dozen sensor types per device, supporting features such as air-quality measurement, advanced biometrics, and self-learning activity tracking. Bosch confirms that more than half of 2025 handset launches ship with its multi-sensor modules. High-volume consumer demand delivers scale economies that drive per-unit cost down across industrial and automotive tiers, opening new price-performance thresholds. Miniaturisation and milliwatt-level power consumption perfected for wearables are now migrating into factory condition-monitoring nodes and autonomous delivery robots, accelerating cross-industry adoption of edge-ready sensor stacks.
Automotive & E-health Safety Mandates
Regulators on both sides of the Atlantic have turned advanced sensors from optional add-ons into compulsory features. The US NHTSA mandates automatic emergency braking (AEB) for all new light vehicles by September 2029,[2]National Highway Traffic Safety Administration, “Automatic Emergency Braking Final Rule,” nhtsa.gov while the EU General Safety Regulation II already requires emergency lane-keeping and intelligent speed assistance continental-automotive.com. At the same time, FDA clearance for over-the-counter continuous glucose monitors such as Dexcom’s Stelo expands sensor demand across broad health-conscious demographics.[3]U.S. Food & Drug Administration, “Stelo Glucose Biosensor 510(k) Summary,” accessdata.fda.gov These mandates create resilient, non-cyclical demand profiles and establish minimum performance specifications that spur sensor innovation in edge processing, functional safety, and cyber-security.
On-sensor Edge-AI Lowers Latency
Neuromorphic and TinyML architectures now deliver sub-5 ms inference directly inside the sensor package, eradicating the round-trip delay to cloud servers. Innatera’s Pulsar microcontroller demonstrates 20× lower power draw versus conventional MCUs while running spiking neural-network workloads.[4]IEEE Spectrum, “Spiking Neural Network Chip for Smarter Sensors,” spectrum.ieee.org KAIST’s self-learning memristor chip adapts in real time, enabling secure medical imaging and smart-city surveillance without exposing raw data. As enterprises prioritise deterministic response, power autonomy, and data privacy, embedded AI becomes the de-facto differentiator in the smart sensors market.
Restraints Impact Analysis*
| Restraint | ( ~ ) % Impact on CAGR Forecast | Geographic Relevance | Impact Timeline |
|---|---|---|---|
| High upfront deployment cost | -2.1% | Global, more acute for SMEs in developing regions | Short term (≤ 2 years) |
| Complex design & integration skill gap | -1.8% | Global, highest in talent-constrained regions | Medium term (2-4 years) |
| Source: Mordor Intelligence | |||
High Upfront Deployment Cost
Comprehensive smart sensor rollouts frequently require parallel investment in edge gateways, private 5G networks, and workforce reskilling. For many small and midsized plants, total outlay can exceed 0.5% of annual revenue, deferring breakeven beyond four fiscal quarters. Milesight’s turnkey IoT kit for Seoul SMEs bundles LoRaWAN gateways and controllers to lower integration friction, yet even this “all-in-one” package strains capital budgets. Cost headwinds are easing as MEMS volumes scale, but budgetary caution is expected to temper adoption among cash-constrained operators over the next 24 months.
Complex Design & Integration Skill Gap
Deploying heterogeneous sensor networks demands expertise spanning embedded firmware, low-power RF, real-time analytics, and IEC 62443 cyber-security compliance. Workforce pipelines in many regions cannot supply enough systems architects and data engineers, forcing firms to outsource to niche integrators that charge premium day rates and have limited global coverage. The resulting delays and re-work inflate project risk profiles, particularly in brownfield retrofits where legacy PLCs and proprietary protocols add extra complexity.
*Our forecasts treat driver/restraint impacts as directional, not additive. The impact forecasts reflect baseline growth, mix effects, and variable interactions.
Segment Analysis
By Type: Pressure Sensors Lead Despite Image Sensor Surge
Pressure sensors contributed USD 21.61 billion in 2025, translating to the largest 28.05% share of the smart sensors market. The segment’s durability stems from its irreplaceable role in ADAS braking, EV battery management, and medical ventilators. Parallel innovation in silicon-carbide diaphragms now extends operating envelopes above 600 °C for aerospace and hydrogen fuel-cell stacks. Image sensors, while smaller in revenue terms, are forecast to grow at 18.85% CAGR as autonomous driving mandates make pedestrian-detection cameras standard equipment. Integration of global-shutter and event-based pixels is allowing high-contrast performance under rapidly changing lighting, enabling vehicle OEMs to comply with AEB regulations without expensive LiDAR redundancy.
Demand diversification is also reshaping unit economics. Temperature, humidity, and flow sensors are piggy-backing on smart-city water-grid and data-center thermal-management projects, while six-axis position sensors are becoming mandatory in collaborative robots. Hybrid modules that blend pressure, temperature, and relative humidity sensing deliver installation savings and strengthen vendor lock-in by raising switching costs for OEMs.



By Technology: MEMS Dominance Faces Quantum Challenge
MEMS devices captured 45.45% of smart sensors market share in 2025 due to mature foundry ecosystems and cost structures tuned for smartphone volumes. Bosch alone shipped over 6 billion MEMS units in 2024, underscoring the scale advantage. However, photonic and quantum-enhanced sensors are projected to expand at 20.95% CAGR and could clip MEMS share in high-precision navigation and medical diagnostics. Citigroup estimates the quantum sensing addressable market could reach USD 1.4 billion by 2030, catalyzing venture capital inflows. MEMS incumbents are responding by co-integrating BioMEMS channels and edge-AI DSP cores to keep volume buyers within their technology roadmap.
Industry consortia such as the US-JOINT program, which includes 3M, are accelerating material R&D to secure domestic supply chains for advanced substrates. A parallel push into neuromorphic compute tiles embedded in MEMS modules aims to deliver cognitive functionality without sacrificing the size-cost advantage that underpin MEMS leadership.
By Component: ADC Leadership Challenged by AI Core Growth
Analog-to-digital converters represented 30.78% of the smart sensors market size in 2025, reflecting the universal need to translate analog phenomena into digital streams. Yet the fastest-expanding bill-of-materials line item is the embedded AI core, projected to grow at 23.15% CAGR. TDK’s i3 Micro Module integrates MEMS motion sensing with TinyML inferencing, eliminating board-level wiring and trimming power budgets to sub-1 mW. In response, ADC vendors are embedding preprocessing functions such as delta-sigma filters and compressive sensing to maintain attach rates.
RF front-end and transceiver demand is rising as Wi-Fi 6 and 5G modems become table-stakes in remote-monitoring nodes. As a result, discrete amplifier and filter suppliers are forming joint ventures with sensor makers to bundle reference designs that cut certification lead-times, a strategy expected to raise ecosystem stickiness and boost margin capture.
By Application: Industrial Automation Leads Healthcare Surge
Industrial automation contributed 24.25% of the smart sensors market size in 2025 as factories digitised maintenance regimes and tightened OEE targets. Condition-monitoring rollouts at ABB’s Italian steel works, which inserted 290 motor sensors, cut unplanned downtime by double-digit percentages. Regulatory clarity in Europe under Machinery Directive reforms is ushering in a new wave of safety-rated sensors with integrated ISO 13849 diagnostics.
Healthcare, although accounting for a smaller base, is forecast to grow fastest at 18.05% CAGR. FDA clearance of over-the-counter continuous glucose monitoring in 2024 broadened the addressable market from insulin-dependent patients to wellness-oriented users.Hospitals are simultaneously deploying edge-AI sensors for fall-detection and remote patient monitoring programs, responding to staffing shortages and value-based reimbursement incentives.
Geography Analysis
Asia-Pacific delivered 44.10% of 2025 global revenue and is expected to record a 19.15% CAGR through 2031, underpinned by China’s 14th Five-Year Plan subsidies for domestic sensing ICs and Japan’s coordinated quantum-sensing R&D grants. China’s domestic market hit CNY 285 billion (USD 39.8 billion) in 2024, with automotive, factory automation, and network communications each capturing above-20% share. Regional foundries benefit from captive demand and lower input-cost inflation, prompting vertically integrated OEMs to localise entire supply chains.
North America remains technological bellwether, particularly in automotive ADAS and aerospace sensing. Honeywell’s strategic partnership with NXP to co-develop AI-ready avionics exemplifies the region’s focus on functional safety and edge compute. Ongoing US industrial-policy incentives, including CHIPS Act grants, are encouraging on-shoring of MEMS lines by ams OSRAM and GlobalFoundries, improving regional resilience.
Europe, while trailing APAC in volume, benefits from regulatory pull. The EU General Safety Regulation II sets a baseline of mandatory sensor suites in every new vehicle, guaranteeing steady volume ramps even in economic downturns. Additionally, corporate carbon-reduction targets are stimulating demand for building-automation and industrial-efficiency sensors across Germany, France, and the Nordics.
Emerging markets in the Middle East, Africa, and South America show accelerating sensor uptake through smart-city and resource-sector digitisation agendas. Saudi Arabia’s giga-projects require dense environmental and traffic-management sensor grids, whereas Chilean copper mines are installing ruggedised vibration sensors to raise extraction efficiency. Low-latency satellite backhaul solutions are easing connectivity barriers, allowing these regions to adopt advanced sensing without legacy telecom infrastructure.

Regulatory Landscape
Smart sensors sold into regulated end markets are increasingly shaped by overlapping product-safety, radio, environmental, and software governance regimes. In the European Union, market access for connected sensors often hinges on compliance with the Radio Equipment Directive (RED) 2014/53/EU and RoHS 2011/65/EU, as reflected in manufacturer Declarations of Conformity (for example, a February 2026 EU DoC for Aqara's Multi-State Sensor referencing RED and RoHS). For industrial and building systems, procurement for safety-critical deployments is also influenced by applicable safety rules and certification schemes (for example, UL-marked fire detection portfolios).
Beyond traditional compliance, the EU AI Act (Regulation (EU) 2024/1689) adds an additional layer when AI-enabled sensing functions are embedded into high-risk product categories such as medical devices or machinery. That framework requires risk management, technical documentation, and human oversight controls. In healthcare, the US FDA regulatory framework and manufacturing quality requirements remain central, with the Quality Management System Regulation (QMSR) taking effect in February 2026 and tightening expectations around design and production controls for sensor-based medical devices. On the standards side, IEEE 1451.0-2024 (published June 26, 2024 under NIST leadership) supports interoperability for smart transducer interfaces, helping vendors and integrators reduce integration friction in multi-vendor IoT deployments.
Value Chain Analysis
The smart sensors value chain spans materials and substrates (including compound semiconductor inputs exposed to gallium and germanium supply pressure), sensor design IP and EDA, wafer fabrication (200 mm/300 mm), packaging and test (including advanced packaging for miniaturized modules), firmware and embedded AI enablement, and downstream integration into devices and systems across industrial, automotive, healthcare, and buildings. Scale and vertical integration remain decisive in upstream economics, while midstream differentiation is shifting toward integrated modules (sensing plus RF/front-end plus on-device processing) that reduce board space, power draw, and certification effort for OEMs.
Downstream, solution delivery increasingly depends on ecosystem partnerships that combine sensor hardware with software, connectivity, and OT integration. Examples include the January 2025 SICK and Endress+Hauser strategic partnership and joint venture (Endress+Hauser SICK GmbH+Co. KG) targeting analyzers and gas flow meter technologies, and the April 2025 OMRON and Cognizant partnership to integrate IT and OT around OMRON Industrial Automation products. The chain is also extending into platform orchestration and integrated modules, as seen in KUKA's introduction of the KUKA Automation Management Platform (AMP) in March 2026 for coordinating robots, sensors, and production data, and Asahi Kasei Microdevices starting mass production of the AK5816AIM mmWave radar module in July 2026 with integrated antenna design that simplifies deployment for camera-less monitoring applications.
Competitive Landscape
The smart sensors market displays moderate concentration. The top five suppliers collectively command an estimated 55–60% revenue share, driven by Bosch, Honeywell, STMicroelectronics, Infineon, and Sony’s image-sensor division. Their vertical integration—from design IP to 200 mm and 300 mm wafer fabs—supports continuous cost reductions and proprietary process tweaks that smaller rivals struggle to match. Bosch aims to ship 10 billion intelligent sensors annually by 2030, 90% featuring embedded AI.
Competitive boundaries are blurring as compute vendors encroach on sensing and vice-versa. Infineon’s AURIX family of RISC-V microcontrollers targets software-defined vehicles with integrated sensor-fusion accelerators infineon.com. Meanwhile, neuromorphic start-ups such as Innatera pursue ultra-low-power edge inference, threatening to re-set incumbent roadmaps with step-function gains in energy efficiency. Patent filings by Meta in terahertz and UWB sensing hint at potential new entrants from big-tech ecosystems.
Supply-chain strategy is emerging as a pivotal differentiator. China’s curbs on gallium and germanium exports risk squeezing compound-semiconductor supply, a scenario that could trim US GDP by USD 3.4 billion. In response, TSMC, GlobalFoundries, and STMicroelectronics have unveiled multi-billion-dollar capex plans to regionalise production, thus insulating customers from geopolitical shocks and boosting their own bargaining position across the value chain.
Smart Sensors Industry Leaders
ABB Ltd
Honeywell International
Analog Devices Inc.
Siemens AG
General Electric
- *Disclaimer: Major Players sorted in no particular order

Market Opportunities and Future Outlook
White-space is expanding where buyers want higher autonomy and lower latency at the edge, while still trying to avoid the integration burden of complex multi-sensor stacks. Product activity in 2026 highlights a shift toward on-device intelligence and 3D perception in industrial automation. RealSense unveiled the D585 Pro AI-native depth camera in June 2026 for robotics and AMR navigation, while STMicroelectronics announced the VL53L9 direct Time-of-Flight 3D LiDAR module (volume shipments beginning July 2026) and introduced the IIS3DWB10IS intelligent vibration sensor with in-sensor AI processing (available July 2026). These launches support opportunities in condition monitoring, warehouse automation, and robotics where deterministic response and local inference reduce bandwidth and cloud dependence.
Capacity and supply-chain localization also create an opportunity area for sensor suppliers and their manufacturing partners, given the ongoing semiconductor self-sufficiency push and the need to secure mixed-signal and imaging supply for regulated applications. A concrete example is the April 2026 approval by the Japanese government of a subsidy of up to USD 380 million tied to Sony's image sensor production expansion in Kumamoto, pointing to continued strategic investment in imaging supply for automotive and industrial vision use cases. At the system level, integration opportunities extend into unified IT/OT and asset-intelligence deployments, building on partnerships such as OMRON-Cognizant (announced April 2025) and HARMAN-ORBCOMM (announced July 2025) that package sensing with connectivity and software delivery, lowering adoption friction for manufacturers and logistics operators.
Recent Industry Developments
- July 2026: ABB won a contract to deliver Ethernet-APL connected electromagnetic flowmeters to Zhejiang Petroleum & Chemical for a petrochemical facility in Zhoushan, China. The award highlights accelerating demand for digitally networked, process-grade sensing that can be deployed deeper into hazardous and high-uptime environments. It also reinforces Ethernet-APL as a practical path for bringing richer sensor data into plant modernization programs.
- June 2026: Siemens launched its intelligent fire detection and notification portfolio, including Sinteso Nova and Cerberus Nova detectors, adding cloud connectivity and digital alarm notification (Acend Intelligent) and positioning the offer around UL-certified building safety. The release strengthens the convergence between smart building platforms and safety-rated sensing, moving deployments toward connected detectors that can feed analytics and remote operations. It also raises competitive pressure on building-automation suppliers to pair sensing with software and services.
- June 2024: NIST announced the publication of IEEE 1451.0-2024, a smart transducer interface standard for sensors and actuators that supports interoperable identification and data exchange mechanisms such as TEDS. This standardization milestone reduces integration complexity across multi-vendor IoT environments and supports faster scaling of smart sensor deployments. It provides a common technical baseline for vendors aiming to sell into industrial and smart-building ecosystems that prioritize plug-and-play interoperability.


Research Methodology Framework and Report Scope
Market Definition and Coverage
For this report, the smart sensors market covers sensors that combine a sensing element with embedded processing and a digital interface for functions such as self-calibration, signal conditioning, and two-way communication, and it is measured in revenue terms (USD).
Scope exclusions: Excludes purely analog sensors and discrete semiconductors that do not include embedded logic.
Segmentation Overview
- By Type
- Flow Sensors
- Humidity Sensors
- Position Sensors
- Pressure Sensors
- Temperature Sensors
- Image/Optical Sensors
- Other Types
- By Technology
- MEMS
- CMOS
- Optical Spectroscopy
- Quantum and Photonic
- Other Technologies
- By Component
- Analog-to-Digital Converter
- Digital-to-Analog Converter
- Amplifier
- Transceiver / RF Front-End
- Embedded AI Core
- Other Components
- By Application
- Aerospace and Defence
- Automotive and Transportation
- Healthcare and Medical Devices
- Industrial Automation
- Building and Home Automation
- Consumer Electronics
- Agriculture and Environmental
- Other Applications
- By Geography
- North America
- United States
- Canada
- Mexico
- South America
- Brazil
- Argentina
- Rest of South America
- Europe
- United Kingdom
- Germany
- France
- Italy
- Spain
- Russia
- Rest of Europe
- APAC
- China
- India
- Japan
- South Korea
- Rest of APAC
- Middle East and Africa
- Middle East
- Saudi Arabia
- UAE
- Turkey
- Rest of Middle East
- Africa
- South Africa
- Nigeria
- Kenya
- Rest of Africa
- Middle East
- North America
Data Sources, Market Sizing, and Validation
Desk Research
Desk work starts with aligning definitions and mapping where smart sensors show up across industries, then checking whether the same product is being counted twice through adjacent categories. We used public references such as national statistics offices, customs and trade data portals, standards bodies for sensor and interface specifications, patent databases, and peer-reviewed journals that track sensing technologies and integration trends.
We also reviewed company annual reports, investor presentations, product documentation, and reputable press coverage to understand pricing direction and adoption patterns in major end-use areas. Where helpful, our team used paid subscriptions for company financials and news, plus patent analytics and shipment-level import and export views to sanity check supply-side signals. The sources listed here are illustrative, and many other public and paid references were also used for data collection, validation, and clarification.
Primary Interviews and Surveys
Primary work was used to validate what counts as a smart sensor in actual procurement, and to confirm typical attach rates and pricing movement across key applications such as industrial automation, automotive and transportation, healthcare, and consumer electronics. We spoke with manufacturers, distributors, system integrators, and large end users across APAC, EMEA, and the Americas to pressure-test assumptions and close gaps that desk sources cannot answer cleanly.
Distribution of primary research fieldwork respondents
| Company type | Respondent position | Region |
|---|---|---|
| Top tier: 39% | CXOs: 12% | APAC: 44% |
| Mid tier: 40% | Functional/Unit leaders: 34% | EMEA: 35% |
| Smaller Players: 21% | Managers: 54% | Americas: 21% |
Market-Sizing & Forecasting
Sizing begins with a top-down build where electronics production, trade flows for sensor-rich components, and end-market demand indicators are used to reconstruct the addressable pool for smart sensors by region, then filtered by smart-sensor penetration in each major application. To keep it grounded, we corroborate totals with selective bottom-up checks, including sampled average selling price ranges multiplied by shipment proxies for key sensor families, followed by distributor and integrator feedback to adjust outliers.
Inputs that typically move the model include unit output trends for electronics and vehicles, industrial automation investment signals, the MEMS and CMOS mix shift, the share of pressure and image sensors in value terms, and observed pricing changes tied to integration and on-board compute. Forecasting is run using a multivariate regression that links demand to these drivers, and the coefficients are reviewed with expert feedback so the forward view aligns with what buyers and suppliers expect in orders and design wins. When data is thin for a niche technology, gaps are handled using proxy indicators from the closest comparable sensor class, and the impact is limited through conservative adoption curves.
Data Validation & Update Cycle
Outputs are checked through multiple passes so the final totals align with independent signals, including regional electronics output growth, trade direction, and reported end-market demand. If a segment shows a jump that cannot be explained by known drivers, it is reworked, then re-tested through follow-up calls or additional desk checks before sign-off.
Each report is refreshed annually, and interim updates are made when there are material shifts such as regulation changes, sharp pricing resets, or supply chain disruptions. Before delivery, an analyst performs a final review to ensure recent public releases and key market events are reflected in the numbers and assumptions clients receive.
Mordor Intelligence's Global Smart Sensors Market Market Sizing Compared With Other Published Estimates
Published smart sensors numbers often do not match because firms define the product set differently, and they also select different base years and price progression logic. The spread is usually explained by scope overlap with broader sensors, different treatments of components, and how aggressively adoption is assumed to ramp in end-use industries.
Analog-only sensors sit outside Mordor Intelligence's scope for this market, which can pull the value away from figures that include general-purpose sensing devices without embedded processing or digital interfaces.
Benchmark comparison
| Source | Market Size | Gaps in Research Methodology |
|---|---|---|
| Mordor Intelligence | USD 77.05 B (2025) | |
| Global Research Publisher A | USD 59.83 B (2024) | Uses an earlier base year and may apply a wider definition that blends smart sensors with broader connected sensing, which changes the counted revenue pool and the implied growth path. |
| Global Consultancy B | USD 72.03 B (2025) | Often applies a different application mapping and ASP progression across end uses, so adjacent sensing revenues can be captured even when on-sensor processing is not consistently required. |
Overall, the differences in the table mostly come from definition choices, base-year alignment, and how pricing and adoption are rolled forward. By keeping the counted revenue tied to embedded processing and digital connectivity, and then cross-checking it with application demand signals, the final total stays traceable to clear inputs that can be reviewed and repeated.


Key Questions Answered in the Report
What is the current smart sensors market size and projected growth?
The smart sensors market stands at USD 90.31 billion in 2026 and is forecast to reach USD 199.68 billion by 2031 at a 17.21% CAGR.
Which sensor type dominates revenue today?
Pressure sensors hold the largest 28.05% revenue share owing to their ubiquity in automotive, industrial, and healthcare systems.
Why is Asia-Pacific the largest regional market?
Asia-Pacific commands 44.10% share due to China’s semiconductor self-sufficiency drive, Japan’s innovation ecosystem, and strong domestic demand across automotive and electronics.
What regulatory changes are fueling sensor demand in vehicles?
The EU General Safety Regulation II and US NHTSA mandates require advanced emergency braking, lane-keeping, and pedestrian-detection systems, making image and radar sensors mandatory on new vehicles by 2029.
How is embedded edge-AI influencing sensor procurement decisions?
On-sensor AI reduces latency to sub-5 ms, cuts bandwidth costs, and strengthens data-privacy compliance, turning intelligence—not raw sensitivity—into the primary purchase criterion.
What is the biggest obstacle for small manufacturers adopting smart sensors?
High upfront integration costs and the shortage of multidisciplinary engineering talent remain key hurdles, particularly in regions with limited technical training capacity.
Page last updated on:





