Market Overview
| Study Period | 2020 - 2031 |
|---|---|
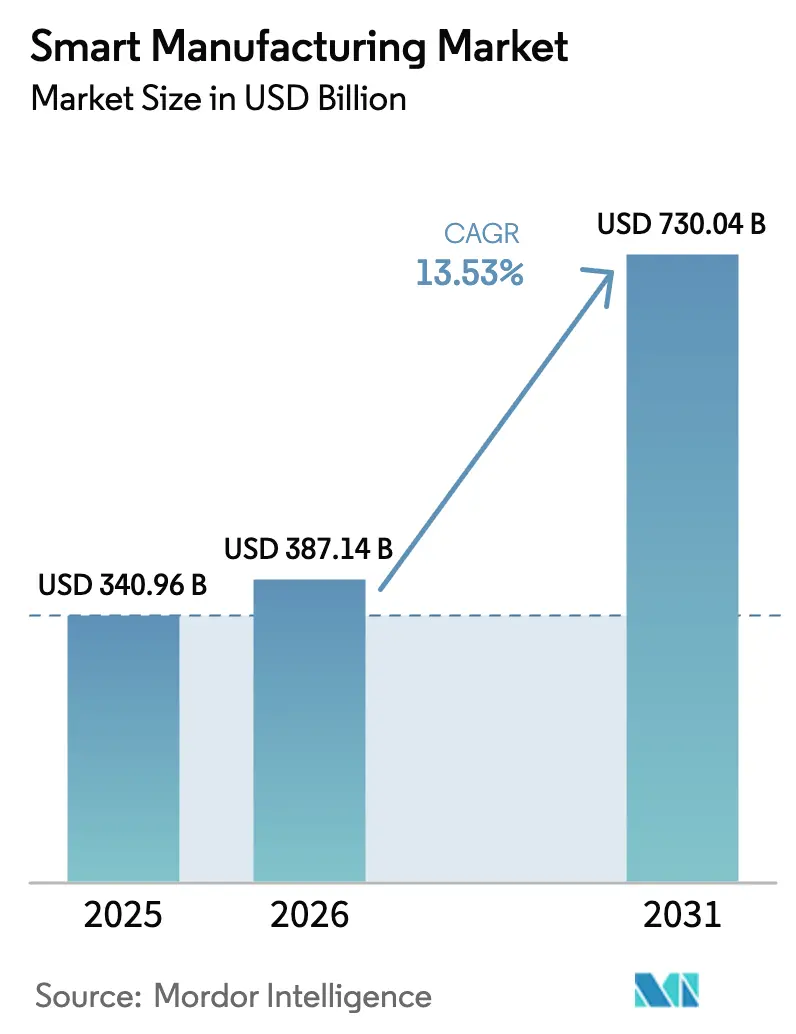
| Market Size (2026) | USD 387.14 Billion |
| Market Size (2031) | USD 730.04 Billion |
| Growth Rate (2026 - 2031) | 13.53% CAGR |
| Fastest Growing Market | Asia Pacific |
| Largest Market | Asia Pacific |
| Market Concentration | Medium |
Major Players
*Disclaimer: Major Players sorted in no particular order Image © Mordor Intelligence. Reuse requires attribution under CC BY 4.0. |
|
Smart Manufacturing Market Analysis by Mordor Intelligence
The smart manufacturing market size is USD 387.14 billion in 2026 and is projected to reach USD 730.04 billion by 2031, reflecting a 13.53% CAGR. Growing capital outlays for digital twins, edge analytics, and private 5G indicate a structural shift toward data-centric operations. Labor shortages raise the economic return on collaborative robots and machine-vision systems, while carbon-border tariffs push factories to install granular energy-monitoring layers. Governments in the United States, Germany, China, and India have linked subsidies to factory digitalization, compressing payback periods on automation equipment. Meanwhile, component suppliers shorten lead times by embedding AI inference in controllers, reducing unplanned downtime and boosting asset utilization.
Key Report Takeaways
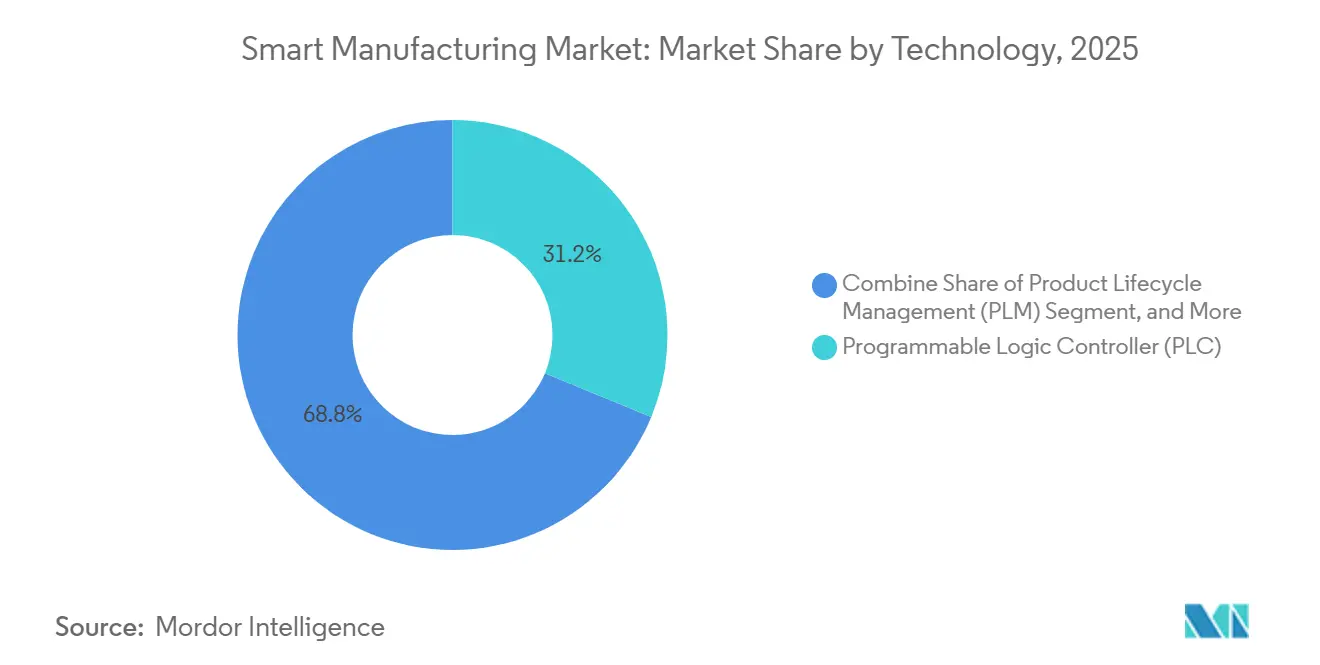
- By technology, programmable logic controllers led with 31.23% revenue share in 2025; digital-twin platforms are forecast to expand at a 14.32% CAGR through 2031.
- By component, hardware commanded 44.13% of the smart manufacturing market share in 2025, while services are on track for a 16.89% CAGR to 2031.
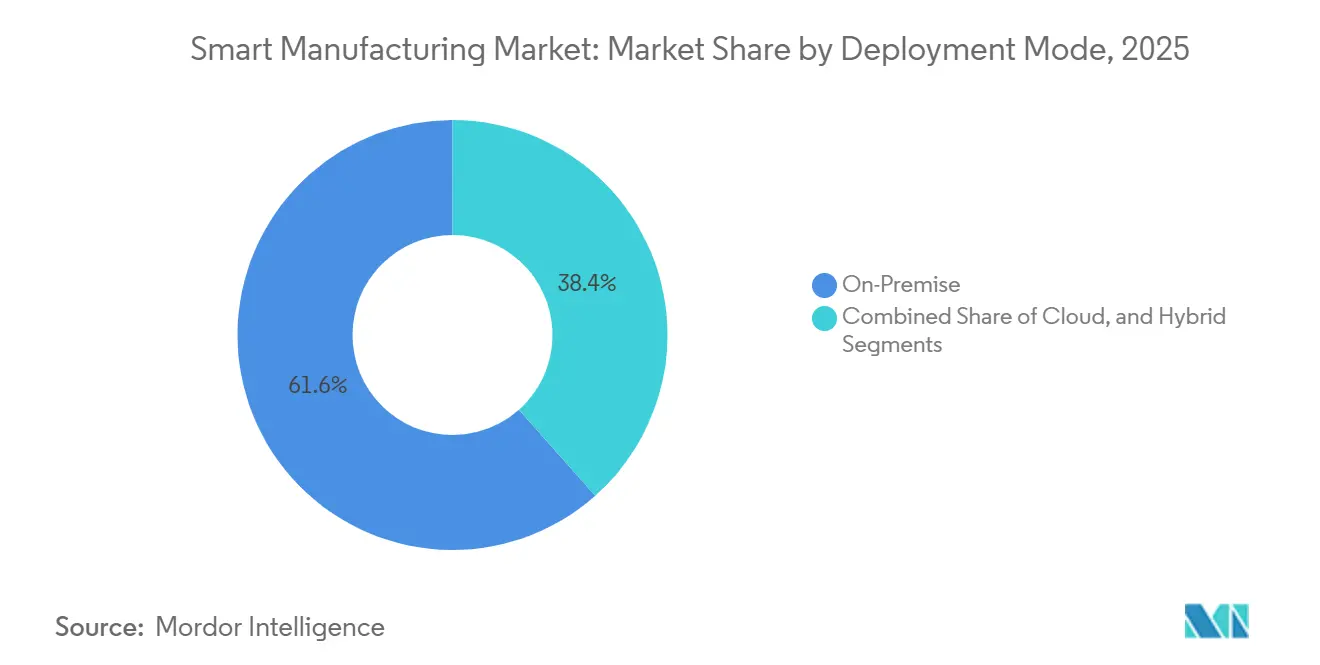
- By deployment mode, on-premises architectures accounted for 61.56% of revenue in 2025; hybrid models are expected to grow at a 14.86% CAGR through 2031.
- By end-user, automotive accounted for 26.71% of demand in 2025; logistics and warehousing will post the fastest 17.13% CAGR to 2031.
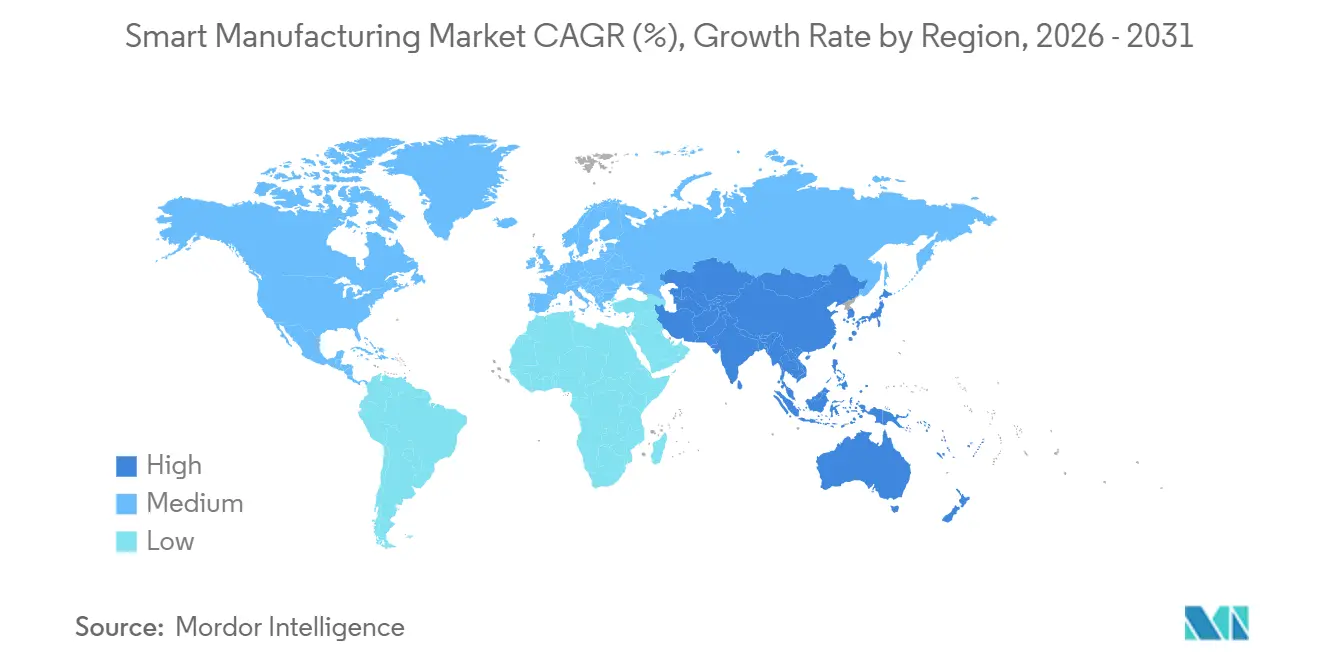
- By geography, Asia Pacific accounted for 36.53% of 2025 revenue; it is forecast to grow at a 14.54% CAGR through 2031.
Note: Market size and forecast figures in this report are generated using Mordor Intelligence’s proprietary estimation framework, updated with the latest available data and insights as of January 2026.
Global Smart Manufacturing Market Trends and Insights
Drivers Impact Analysis*
| Driver | (~) % Impact on CAGR Forecast | Geographic Relevance | Impact Timeline |
|---|---|---|---|
| Rising Adoption of Industry 4.0 and IIoT for Efficiency | +2.3% | Global, with concentration in Asia-Pacific and Europe | Medium term (2-4 years) |
| Government Incentives and Policy Mandates for Digital Factories | +1.8% | North America, Europe, India, China | Short term (≤2 years) |
| Skilled-Labour Shortages Accelerating Automation Uptake | +1.5% | North America, Europe, Japan | Long term (≥4 years) |
| Carbon-Border Adjustment Mechanism Driving Factory-level Energy Transparency | +1.2% | Europe, spillover to North America and export-oriented Asia-Pacific economies | Medium term (2-4 years) |
| Digital-Twin-based Predictive-Maintenance Revenue Streams | +1.0% | Global, early traction in automotive, aerospace, pharmaceuticals | Medium term (2-4 years) |
| Roll-out of Private 5G Networks Enabling Ultra-Low-Latency Control | +0.9% | Asia-Pacific core, pilot deployments in North America and Europe | Long term (≥4 years) |
| Source: Mordor Intelligence | |||
Rising Adoption of Industry 4.0 and IIoT for Efficiency
Factories move from pilot projects to full-scale IIoT rollouts, cutting unplanned downtime by as much as 20% after adding low-cost edge sensors to legacy equipment. Supervisory control and data acquisition backbones lower the marginal cost of new nodes, helping automotive and semiconductor lines generate predictive alerts that avert million-dollar stoppages. Pharmaceutical plants extend the architecture into cleanrooms to monitor particulate counts in real time, trimming batch rejection rates and raising gross margins.[1]“Pharmaceutical CGMP for the 21st Century,” U.S. Food and Drug Administration, fda.gov Certification frameworks now reference digital audit trails, making IIoT adoption a prerequisite for quality-management renewals. As operational and information technology converge, plants deploy zero-trust segmentation and traffic anomaly analytics to curb lateral cyber threats.
Government Incentives and Policy Mandates for Digital Factories
The United States CHIPS and Science Act directs USD 39 billion in subsidies toward fabs that install advanced manufacturing execution systems by 2027. Germany’s Industry 4.0 grants reimburse up to 40% of retrofit costs for small and medium plants that add cloud-connected controllers and human-machine interfaces. India’s Production-Linked Incentive schemes tie payouts to real-time genealogy tracking in electronics and pharmaceuticals. China’s 14th Five-Year Plan obliges state-owned enterprises in steel, chemicals, and energy to reach “intelligent manufacturing” targets by 2025, inflating domestic orders for distributed control and edge-analytics platforms. Companies delaying upgrades risk losing access to subsidized capital and export markets that demand digital traceability.
Skilled-Labor Shortages Accelerating Automation Uptake
Between 2020 and 2025, manufacturing employment in advanced economies fell by 1.2 million while volumes recovered, reflecting retirements and shrinking apprentice pipelines. Japan reported 68% of small and medium factories citing labor availability as the top capacity constraint in 2024. Installations of collaborative robots and machine-vision systems rose 23% year over year in 2025, filling gaps across automotive, electronics, and food processing. Wage inflation shortens acceptable payback periods, making 18-month horizons viable for new automation projects. Warehouses integrate autonomous mobile robots that navigate dynamic layouts, easing dependence on forklift drivers whose median age exceeded 50 in North America and Europe by 2025.
Carbon-Border Adjustment Mechanism Driving Factory-level Energy Transparency
The European Union’s carbon-border tariffs enter their enforcement phase in 2026, requiring importers to declare embedded emissions with hourly granularity. Exporters unable to document energy use face default factors that raise landed costs up to 30%. North American lawmakers have introduced parallel bills, spurring regional manufacturers to embed energy-monitoring layers into enterprise platforms. Chemical producers retrofit control systems with sub-process analytics, enabling premium pricing for low-carbon batches. Digital-twin scheduling minimizes peak-demand charges and aligns production with renewable availability.
Restraints Impact Analysis*
| Restraint | (~) % Impact on CAGR Forecast | Geographic Relevance | Impact Timeline |
|---|---|---|---|
| High CAPEX and Uncertain SME ROI | -1.5% | Global, acute in South America, Africa, Southeast Asia | Short term (≤2 years) |
| Cyber-Security and Data-Sovereignty Concerns | -1.0% | Global, regulatory pressure highest in Europe and China | Medium term (2-4 years) |
| Legacy Analogue Equipment Limiting Interoperability | -0.8% | North America, Europe, established manufacturing hubs in Asia-Pacific | Long term (≥4 years) |
| Semiconductor Supply-Chain Volatility Delaying Control Hardware | -0.6% | Global, most severe in automotive and industrial-equipment sectors | Short term (≤2 years) |
| Source: Mordor Intelligence | |||
High CAPEX and Uncertain SME ROI
Small and medium enterprises cover 60% of manufacturing employment but just 28% of smart-manufacturing capex, because entry-level execution systems run USD 200,000–USD 800,000, well above typical IT budgets. Legacy controllers often lack Ethernet ports, forcing purchases of gateway devices and custom protocol translation. A 2025 survey found that more than half of European SMEs could not quantify productivity gains within 18 months, leading to budget freezes. Subscription pricing lowers upfront costs but adds recurring fees, and banks in emerging markets demand high equity contributions for automation loans.[2]World Bank, “Manufacturing Competitiveness and Finance,” worldbank.org
Cyber-Security and Data-Sovereignty Concerns
Reported industrial-control cyber incidents rose 38% from 2024 to 2025, with ransomware halting production at automotive suppliers across three continents. New European legislation makes manufacturers liable for vulnerabilities in connected devices, inflating compliance costs. China’s data-security rules require local storage, forcing multinationals to maintain parallel executions and complicating process standardization. SMEs lack dedicated security teams, and managed-security contracts add USD 30,000-USD 100,000 to yearly overhead, delaying capital decisions.
*Our forecasts treat driver/restraint impacts as directional, not additive. The impact forecasts reflect baseline growth, mix effects, and variable interactions.
Segment Analysis
By Technology: Digital Twins Move from Novelty to Necessity
Digital-twin platforms will capture more incremental value than any other technology as factories simulate entire lines before physical retooling. Programmable logic controllers remain vital, yet their 31.23% revenue share in 2025 signals maturity rather than growth. Demand for virtual replicas rises especially in aerospace and automotive, where every minute of physical downtime carries six-figure costs. Digital-twin tools link with product lifecycle management to help engineers test hundreds of “what-if” scenarios without stopping a running line. In discrete electronics, twins shorten new-product introductions because layout changes surface virtually, not on shop floors.
Distributed control systems stay entrenched in chemicals and oil and gas, where safety demands deterministic response times. Edge analytics blends with supervisory control and data acquisition, embedding machine-learning models inside controller firmware so pumps alert staff to bearing wear well before vibration exceeds thresholds. Mobile human-machine interfaces replace fixed panels, shaving average repair time by nearly 15 minutes per incident. The International Electrotechnical Commission’s IEC 61499 standard gains traction in modular lines that must switch between short batches without extensive reprogramming. This convergence suggests the smart manufacturing market will rely on software-driven orchestration layered over a hardware foundation.


By Component: Service Revenue Outpaces Falling Hardware Prices
Hardware still accounted for 44.13% of expenditure in 2025, yet falling sensor and robot prices mean future growth will shift to software and integration. Sensors for temperature or vibration now cost under USD 10 each, allowing plants to instrument every motor. Collating millions of data points per second strains legacy systems, pushing the smart manufacturing market toward high-performance time-series databases that scale horizontally. Software revenue grows steadily as perpetual licenses give way to cloud subscriptions, driving up long-run ownership cost but smoothing cash flow for vendors.
Services expand at a 16.89% CAGR because multi-vendor stacks turn deployment into a complex engineering project. Integrators blend programmable logic controllers from one vendor with supervision from another and enterprise resource planning from a third. Specialists bundle pre-configured templates for pharmaceutical batch execution or automotive mixed-model assembly, halving go-live timelines. Managed services appeal to smaller plants that lack automation engineers, offering remote monitoring, software patching, and cybersecurity under monthly contracts. As integration eclipses procurement, services will anchor the next growth wave within the smart manufacturing market size metrics.
By Deployment Mode: Hybrid Models Balance Latency and Elasticity
Hybrid architectures are scaling quickly because they combine the deterministic control of on-premise servers with the elastic analytics of public clouds. Hybrid architectures expand at 14.86% annually. On-premise installations still accounted for 61.56% of revenue in 2025, reflecting decades of capital sunk into data centers across automotive, oil and gas, and chemical plants. Yet every new robotics cell, sensor gateway, and energy meter now ships with secure APIs that push non-critical data to hyperscale providers for model retraining and long-horizon forecasting. This dual-stack pattern protects intellectual property and satisfies strict validation rules in life sciences and aerospace, where unplanned software changes cannot be tolerated. Private 5G networks add another layer by placing edge servers beside radios, so sub-10-millisecond loops for weld quality or pick-and-place accuracy never leave the shop floor.[3]Ericsson, "Private 5G for Manufacturing." ericsson.com
Cloud-only deployments cluster in discrete electronics, textile, and contract logistics facilities, where output swings with seasonal demand and variable compute pricing beats fixed server depreciation. Even here, a smart manufacturing market size calculation shows that hybrid footprints will capture most of the incremental spend because insurance carriers and regulators now require zero-trust segmentation and immutable backups that are easier to implement through managed cloud vaults. System integrators respond by offering ever-green validation services, freezing firmware on local controllers while pushing analytics micro-services through continuous-integration pipelines in the cloud. As latency-sensitive control loops stay local and compliance workloads float to regional zones, hybrid will remain the default design across the smart manufacturing market.
By End-User Industry: Logistics Surges, Automotive Consolidates
Automotive lines accounted for 26.71% of 2025 spend, reflecting entrenched investments in robotics, conveyor automation, and end-of-line vision inspection. Original equipment manufacturers unify legacy programmable logic controllers with digital twins that simulate battery-pack torque specifications and line balancing across a full shift before physical changeovers, enabling them to defend the largest smart manufacturing market share among industries.[4]Siemens AG, “Digital Twin Technology,” siemens.com Tier-one suppliers follow suit, adding edge analytics that cut downtime by double digits, but their incremental outlays slow as major retooling cycles wind down after 2027.
Logistics and warehousing sites post the fastest 17.13% CAGR, driving the smart manufacturing market's growth as e-commerce fulfillment centers adopt fleets of autonomous mobile robots, goods-to-person workstations, and real-time inventory twins. Semiconductor fabs layer vibration sensors on vacuum pumps to protect billion-dollar wafer lots, while chemical plants deploy digital twins to trim catalyst use. Food and beverage processors implement allergen checkpoints, and pharmaceutical firms implement electronic batch records under serialization laws. Each vertical captures new efficiency or compliance value, yet none adds revenue faster than logistics, making it the headline growth engine through 2031.
Geography Analysis
Asia-Pacific held 36.53% of smart manufacturing revenue in 2025 and will deliver a 14.54% compound growth pace through 2031, outstripping every other region. China alone deployed more than 400 private 5G factory networks, and its five-year plan mandates intelligent-manufacturing milestones by 2025. India’s subsidies channel USD 6.5 billion into digital traceability for electronics and pharmaceuticals, cutting average payback to under two years. Japan’s aging workforce accelerates collaborative-robot rollouts, while South Korea instruments every semiconductor tool down to electrodes to safeguard yields at sub-3-nanometer nodes.
North America benefits from USD 39 billion in U.S. CHIPS Act grants, which require advanced execution systems, and tax credits that reward energy-monitoring layers. Mexico’s nearshoring boom pulls capital south of the border to brand-new lines designed around digital twins and private 5G. Canada’s aerospace cluster adds machine-vision inspection on composite assemblies. Europe leans on its Carbon Border Adjustment Mechanism, pushing exporters to retrofit energy-monitoring devices now to avoid future tariffs. Germany extends 40% retrofit grants for small plants, and the United Kingdom rebuilds automotive lines for electric vehicles.
Middle East and Africa pursue national industrial agendas. Saudi Arabia funds petrochemical, metals, and food projects under Vision 2030, with every new line stipulating programmable logic controllers and edge analytics. The United Arab Emirates ties AI grants to digital-factory pilots in desalination and aluminum smelting. South Africa’s cloud adoption lags because plants rely on diesel generators during power outages. Still, Kenya’s textiles adopt basic smart-factory layers where export contracts justify the cost.

Competitive Landscape
Incumbent control and software vendors share roughly 45% of global revenue, producing a moderately consolidated field where scale advantages coexist with meaningful room for challengers. Giants such as ABB, Siemens, Schneider Electric, Rockwell Automation, Emerson, Honeywell, Mitsubishi Electric, SAP, Oracle, and IBM continue to purchase simulation, cybersecurity, and low-code platforms to widen account stickiness and attach high-margin services. Siemens bought Altair Engineering for USD 10.6 billion to bundle physics-based simulation with plant-floor hardware, while Rockwell Automation added Clearpath Robotics for USD 350 million to insert mobile robots into its FactoryTalk stack.
Start-ups exploit white space by selling modular software subscriptions for less than USD 50,000 annually, side-stepping the multi-year integration cycles that burden small and medium manufacturers. Tulip Interfaces offers drag-and-drop dashboards that go live in days, and Plex Systems packages cloud manufacturing execution under a predictable per-site fee. Edge-AI chip suppliers NVIDIA, Intel, and AMD embed accelerators in gateways, enabling real-time inference without bandwidth-heavy trips to cloud cores. Cybersecurity specialists such as Claroty and Nozomi Networks layer deep-packet inspection on operational-technology protocols, satisfying insurers that now require continuous monitoring before underwriting.
Regional system integrators diversify as hyperscale clouds push into industrial workloads. Capgemini, Accenture, and Tata Consulting consolidate niche integrators to build domain practices that deliver validated templates for semiconductor lithography, pharmaceutical cleanrooms, and mixed-model automotive assembly. Their pre-engineered libraries shorten roll-outs from 18 months to under nine and generate recurring managed-service fees. As software weight inside equipment climbs, the competitive gap hinges less on selling standalone controllers and more on orchestrating data across the life cycle. Vendors that master this pivot will extend share, while hardware-centric laggards risk commoditization.
Smart Manufacturing Industry Leaders
-
ABB Ltd.
-
Emerson Electric Co.
-
FANUC Corporation
-
General Electric Co.
-
Honeywell International Inc.
- *Disclaimer: Major Players sorted in no particular order

Recent Industry Developments
- January 2026: Siemens allocated EUR 2 billion (USD 2.2 billion) to expand its Amberg Electronics Plant, adding digital-twin controls and private 5G to cut time-to-market by 30 percent.
- December 2025: Rockwell Automation closed a USD 350 million purchase of Clearpath Robotics, bringing autonomous mobile robots into its FactoryTalk portfolio.
- November 2025: ABB and IBM formed a joint venture to deliver generative-AI scheduling for manufacturing execution systems, targeting automotive and electronics clients.
- October 2025: Honeywell launched Forge Energy Optimization, a cloud service that shifts production to off-peak power windows, trimming energy costs by up to 12 percent.


Research Methodology Framework and Report Scope
Market Definitions and Key Coverage
Smart manufacturing, as defined by Mordor Intelligence, spans all software, hardware, and connected services that enable real-time data exchange, self-optimizing production assets, and digitally driven decision loops inside factories and across supply chains. The estimate places the global market at USD 339.8 billion in 2025, rising to USD 709.2 billion by 2030.
Scope exclusion: ancillary IT outsourcing and generic enterprise software not deployed on the plant floor are left out.
Segmentation Overview
-
By Technology
- Programmable Logic Controller (PLC)
- Supervisory Control and Data Acquisition (SCADA)
- Enterprise Resource Planning (ERP)
- Distributed Control System (DCS)
- Human-Machine Interface (HMI)
- Product Lifecycle Management (PLM)
- Manufacturing Execution System (MES)
- Other Technologies
-
By Component
-
Hardware
- Robotics
- Sensors
- Machine-Vision Systems
- Control Devices
-
Software
- MES
- PLM
- SCADA / ERP Suites
- Digital-Twin / AI and Analytics
-
Services
- Integration and Implementation
- Consulting and Training
- Managed Services
- Communication Segment
-
Hardware
-
By Deployment Mode
- On-Premise
- Cloud
- Hybrid
-
By End-User Industry
- Automotive
- Semiconductors and Electronics
- Oil and Gas
- Chemical and Petrochemical
- Pharmaceuticals and Life Sciences
- Food and Beverage
- Energy and Utilities
- Logistics and Warehousing
- Other End-User Industries
-
By Geography
-
North America
- United States
- Canada
- Mexico
-
Europe
- Germany
- United Kingdom
- France
- Italy
- Spain
- Russia
- Rest of Europe
-
Asia Pacific
- China
- Japan
- India
- South Korea
- ASEAN
- Australia and New Zealand
- Rest of Asia Pacific
-
South America
- Brazil
- Argentina
- Rest of South America
-
Middle East
- Saudi Arabia
- United Arab Emirates
- Turkey
- Rest of Middle East
-
Africa
- South Africa
- Nigeria
- Rest of Africa
-
North America
Detailed Research Methodology and Data Validation
Primary Research
Interview rounds with plant managers, automation OEM product leads, systems integrators, and regional policymakers across North America, Europe, and Asia helped us stress test adoption rates, typical system prices, and retrofit timelines, thereby closing gaps left by desk research before final triangulation.
Desk Research
Our desk work begins with tier-1 public sources such as UN Comtrade shipment data, the International Federation of Robotics install base tables, U.S. Census ASM production statistics, Eurostat PRODCOM output series, and industry association white papers from MESA International and NAM. Annual reports, 10-Ks, and investor decks supply revenue splits, while patent analytics from Questel signal emerging technology diffusion. Complementary insights flow from paid repositories, D&B Hoovers for company financials and Dow Jones Factiva for curated news, to cross-check vendor performance, pricing moves, and capacity additions. This list is illustrative, not exhaustive; many other sources were consulted for data validation and clarification.
Market-Sizing & Forecasting
Model building uses a top-down production and trade reconstruction that scales factory value-add figures by digital penetration ratios, then corroborates results through selective bottom-up supplier roll-ups (sampled ASP × installed units). Key variables include industrial robot shipments, MES software license renewals, private 5G node deployments, and average retrofit CAPEX per square foot. Multivariate regression links these drivers to historic spend, while scenario analysis captures policy incentives and labor cost shocks. Where bottom-up estimates miss smaller geographies, regional proxies are applied and normalized to global totals.
Data Validation & Update Cycle
Every draft faces variance checks against external indices and prior editions. Findings pass a two-step peer review, and anomalies trigger follow-up calls. Reports refresh yearly, with interim updates when material events, such as subsidy rollouts or large M&A deals, shift baselines.
Why Mordor's Smart Manufacturing Baseline Commands Reliability
Published estimates often diverge because firms mix different technology baskets, price points, and update cadences.
Key gap drivers include inclusion of adjacent digital transformation services, differing ASP escalation paths, currency conversion dates, and refresh frequencies.
Benchmark comparison
| Market Size | Anonymized source | Primary gap driver |
|---|---|---|
| USD 339.8 B (2025) | Mordor Intelligence | - |
| USD 349.5 B (2024) | Global Publisher A | Adds IT consulting and cloud-only services, inflating base |
| USD 410.7 B (2025) | Industry Journal B | Uses list prices without regional discounting and counts aftermarket support |
| USD 263.2 B (2025) | Consultancy C | Hardware-centric scope ignores software subscriptions and integration fees |
These comparisons show that Mordor's disciplined scope selection, mixed top-down and bottom-up reconciliation, and annual refresh deliver a balanced, transparent baseline decision makers can rely on.


Key Questions Answered in the Report
How fast is the smart manufacturing market expected to grow through 2031?
It is projected to expand at a 13.53% CAGR from USD 387.14 billion in 2026 to USD 730.04 billion in 2031.
Which segment shows the fastest revenue growth?
Digital-twin technology leads with a 14.32% CAGR through the forecast period.
Why are hybrid deployments gaining traction?
They deliver local latency for control loops while offloading analytics and backups to the cloud, combining resilience with scalability.
What is pushing logistics and warehousing investment?
E-commerce growth drives adoption of autonomous mobile robots and real-time inventory twins, resulting in a 17.13% CAGR for the segment.
How are carbon-border tariffs influencing adoption?
Factories must document machine-level emissions to avoid cost penalties, which accelerates installation of energy-monitoring SCADA systems.
What is the overall market concentration level?
The top ten vendors hold around 45% of revenue, indicating a moderately consolidated environment that still allows new entrants to scale.
Page last updated on:


