Market Overview
| Study Period | 2020 - 2031 |
|---|---|
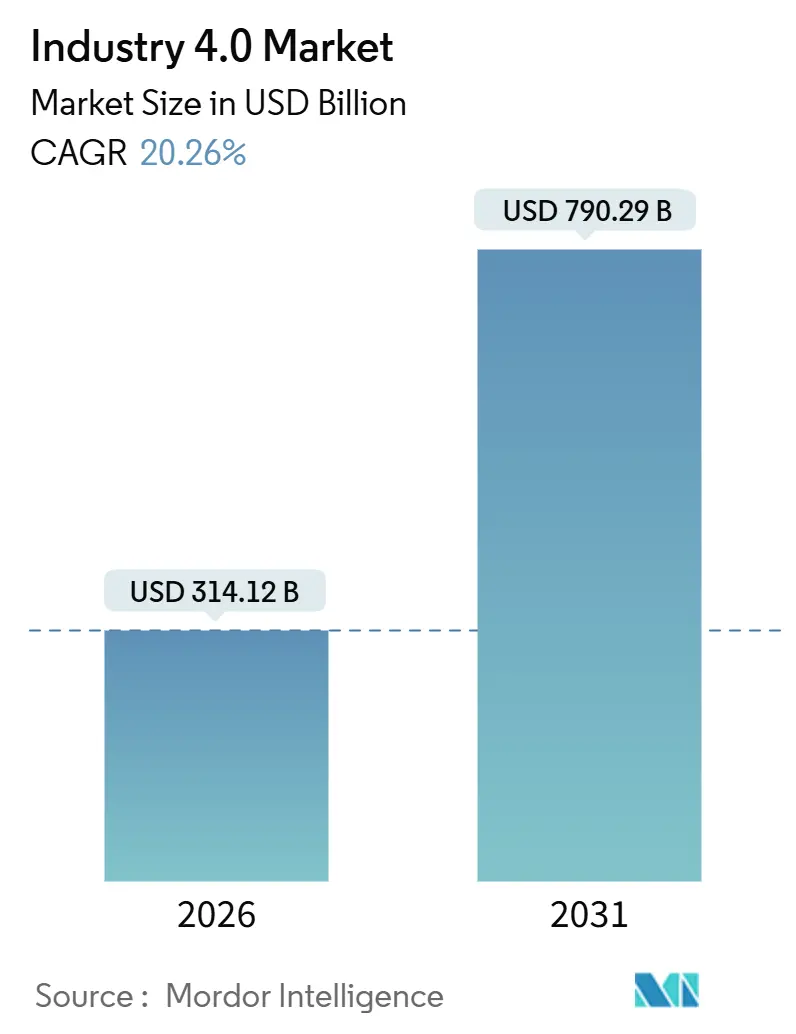
| Market Size (2026) | USD 314.12 Billion |
| Market Size (2031) | USD 790.29 Billion |
| Growth Rate (2026 - 2031) | 20.26% CAGR |
| Fastest Growing Market | Asia Pacific |
| Largest Market | North America |
| Market Concentration | Medium |
Major Players *Disclaimer: Major Players sorted in no particular order Image © Mordor Intelligence. Reuse requires attribution under CC BY 4.0. | |
Analysis of Industry 4.0 Market by Mordor Intelligence
The Industry 4.0 market reached USD 314.12 billion in 2026 and is projected to climb to USD 790.29 billion by 2031, reflecting a 20.26% CAGR over the forecast period, underscoring the structural shift toward mandatory cyber-physical convergence across global production networks. Private 5G installations are lowering latency to single-digit milliseconds, which unlocks real-time closed-loop control and materially raises overall equipment effectiveness. Generative-AI design routines have reduced prototyping windows by 25% at leading automotive plants, accelerating time-to-market and protecting gross margins amid rising component inflation. Subsidy programs in China, India, Germany, and Singapore continue to derisk capital outlays, propelling small and medium-sized enterprises into earlier adoption curves. Meanwhile, platform vendors are migrating license-based software to subscription models that convert fixed costs into scalable operating expenses, a trend that favors recurring revenue for vendors and lowers entry barriers for new users.
Key Report Takeaways
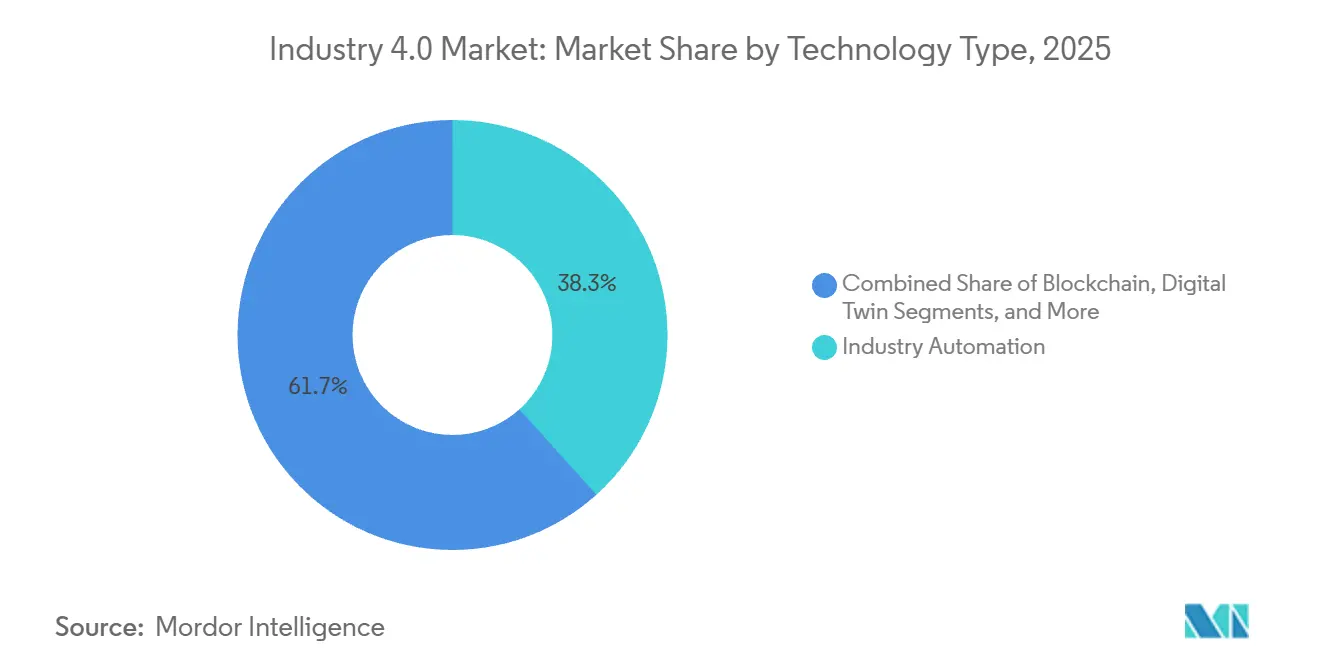
- By technology type, industry automation accounted for 38.33% revenue share in 2025, while blockchain is expected to expand at a 22.81% CAGR through 2031.
- By component, hardware maintained 42.21% of revenue in 2025; software platforms are forecast to grow at a 21.57% CAGR through 2031.
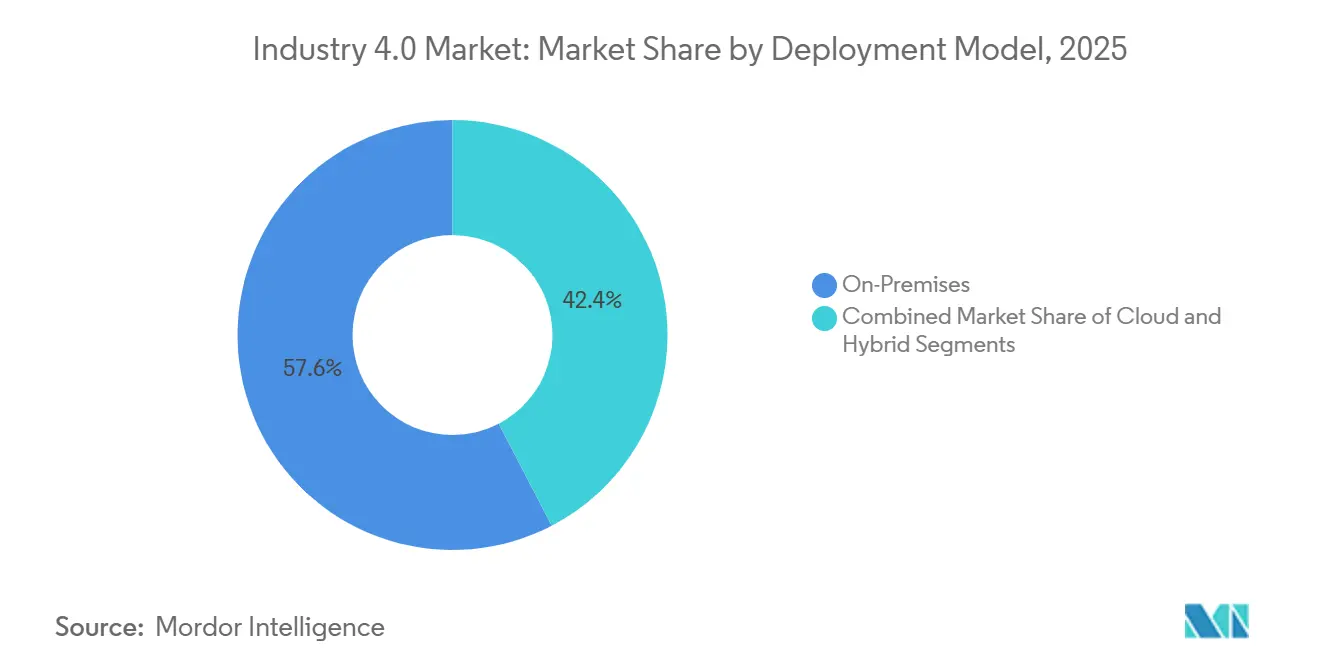
- By deployment model, on-premises solutions accounted for 57.63% of 2025 installations, whereas cloud architectures are projected to grow at a 21.17% CAGR.
- By end-user industry, discrete manufacturing accounted for 37.62% in 2025, but healthcare and pharmaceuticals are projected to grow at a 21.93% CAGR.
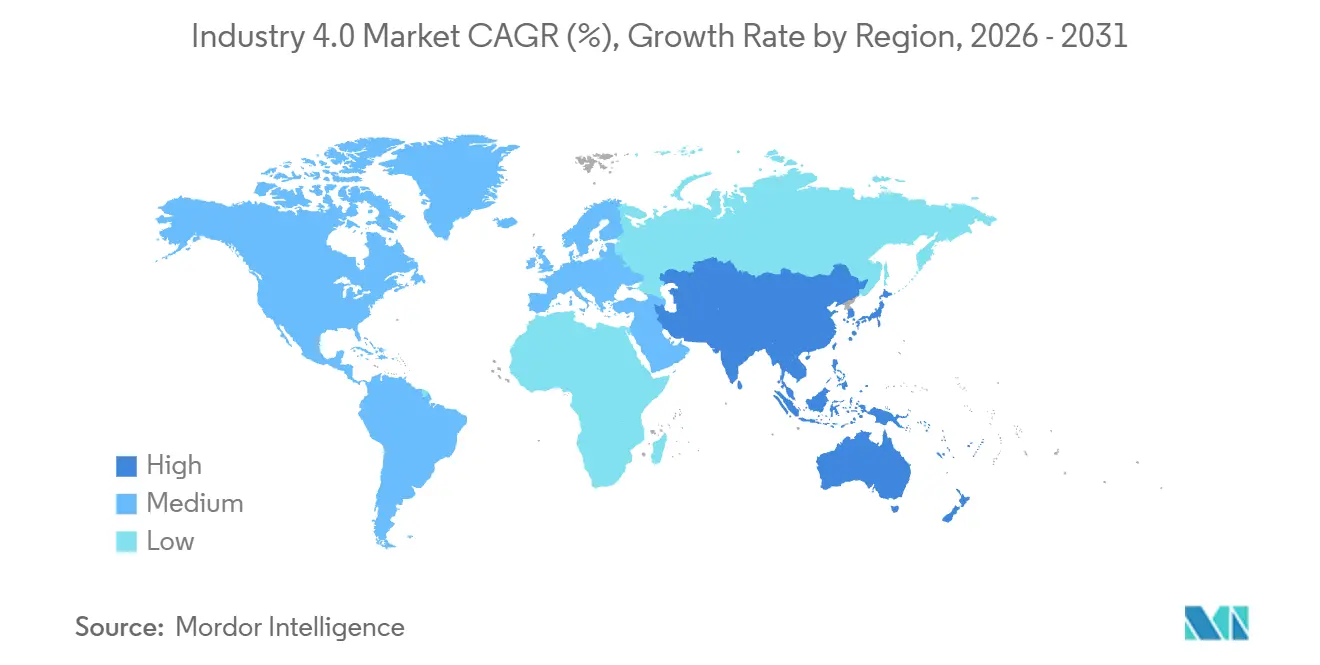
- By Geography, North America led with a 35.13% revenue share in 2025, while Asia Pacific is expected to register the fastest regional CAGR of 21.18% through 2031.
Note: Market size and forecast figures in this report are generated using Mordor Intelligence’s proprietary estimation framework, updated with the latest available data and insights as of January 2026.
Insights and Trends of Industry 4.0 Market
Drivers Impact Analysis*
| Driver | (~) % Impact on CAGR Forecast | Geographic Relevance | Impact Timeline |
|---|---|---|---|
| Favorable Government Initiatives and Multi-Stakeholder Collaborations | +3.5% | Germany, United Kingdom, Singapore, China, India | Medium term (2-4 years) |
| Surging Demand for Industrial and Collaborative Robotics | +4.2% | Asia Pacific and Europe | Short term (≤ 2 years) |
| Rapid SME-Led Digital Transformation Programs | +3.8% | North America, Europe, Asia Pacific | Medium term (2-4 years) |
| Edge and Private 5G Rollouts Enabling Ultra-Low-Latency Factory Networks | +3.2% | North America, Europe, China, Japan, South Korea | Short term (≤ 2 years) |
| Decarbonisation Premiums for Smart-Energy, Self-Optimising Plants | +2.9% | Europe and North America with spill-over to Asia Pacific | Long term (≥ 4 years) |
| AI-Powered Generative Design Cutting Prototyping Cost and Time | +2.6% | Global, concentrated in automotive, aerospace, electronics | Medium term (2-4 years) |
| Source: Mordor Intelligence | |||


Favorable Government Initiatives And Multi-Stakeholder Collaborations
National programs are accelerating cyber-physical adoption by underwriting pilot expenses, codifying best practices, and providing workforce training roadmaps. Germany channeled EUR 200 million (USD 226 million) in 2025 to 5G testbeds that validate machine-to-machine protocols, cutting integration risk for mid-sized suppliers. The United Kingdom’s Made Smarter initiative earmarked GBP 120 million (USD 156 million) to subsidize automation for smaller manufacturers, shortening payback periods to below three years for many projects. Singapore’s Advanced Remanufacturing and Technology Centre partnered with global OEMs to demonstrate predictive-maintenance programs that trimmed unplanned downtime by 40%, a milestone now embedded in the Smart Industry Readiness Index.[1]Singapore Economic Development Board, “Smart Industry Readiness Index,” edb.gov.sg India’s Production-Linked Incentive mechanism offers capital subsidies up to 25%, driving a surge in collaborative-robot orders across electronics and pharmaceutical verticals. These orchestrated efforts squeeze deployment cycles from years to quarters and create de facto standards that ease vendor selection.
Surging Demand For Industrial And Collaborative Robotics
Global robot installations reached 542,000 units in 2024, doubling the volume of a decade earlier as price declines and modular architectures unlocked new use cases. Cobots captured 18% of 2025 shipments, reflecting manufacturers’ push for flexible automation that can coexist safely with human workers. Automotive assembly lines now rely on cobots for windshield bonding and battery-module insertion, tasks demanding precision but tolerant of human proximity. Semiconductor foundries across Taiwan and South Korea installed more than 35,000 robots in 2025 to offset labor shortages while meeting sub-micron yield targets. Vendors are embedding vision sensors and force-torque feedback to enable adaptive gripping, extending automation to high-mix environments previously relegated to manual labor.
Rapid SME-Led Digital Transformation Programs
Lower subscription pricing and pre-integrated sensor kits are closing the digital gap between large manufacturers and their supply-chain partners. Cloud manufacturing execution systems now reduce upfront software spend by 60%, converting capital expenditure into predictable operating fees. Germany’s Mittelstand boosted digital-twin outlays by 42% in 2025, leveraging SaaS models that align with cash-flow cycles. In the United States, the Manufacturing Extension Partnership helped 1,200 SMEs deploy predictive-maintenance suites that forecast bearing failures 30 days in advance, improving uptime without hiring dedicated data scientists. India’s SMEs Go Digital vouchers, totaling INR 5 billion (USD 60 million) in 2025, covered cloud ERP and IoT gateways, allowing tier-2 suppliers to meet OEM visibility mandates. These programs show that the Industry 4.0 market is broadening beyond global corporations into the long-tail of producers.
Edge And Private 5G Rollouts Enabling Ultra-Low-Latency Factory Networks
Private 5G networks trimmed latency below 5 milliseconds in 2025, making autonomous mobile robots and real-time video analytics commercially viable on crowded shop floors. Volkswagen’s Wolfsburg complex connected 3,000 sensors and 200 automated guided vehicles on a single 5G slice, automating dynamic route planning and removing wired bottlenecks. Mercedes-Benz achieved 99.9% network uptime at Factory 56 by co-locating edge compute nodes with 5G base stations, insulating production from wide-area outages. Mitsubishi Electric’s trials in Japan enabled remote parameter tuning of injection-molding machines, allowing off-site technicians to resolve quality deviations within seconds. These references confirm that ultra-reliable low-latency connectivity is becoming a prerequisite for digitized operations.
Restraints Impact Analysis*
| Restraint | (~) % Impact on CAGR Forecast | Geographic Relevance | Impact Timeline |
|---|---|---|---|
| Uncertain ROI Perception Among Tier-2 and Tier-3 Suppliers | -2.1% | Global, acute in North America and Europe SME segments | Short term (≤ 2 years) |
| Workforce Upskilling and Union Push-Back on Cobot Adoption | -1.8% | Europe, North America, with emerging friction in Asia Pacific | Medium term (2-4 years) |
| Cyber-Physical Security Liabilities and Patch-Management Costs | -1.5% | Global, concentrated in critical infrastructure sectors | Short term (≤ 2 years) |
| Fragmented Interoperability Standards Across Brownfield Assets | -1.3% | Global, particularly acute in Europe and North America legacy plants | Medium term (2-4 years) |
| Source: Mordor Intelligence | |||
Uncertain ROI Perception Among Tier-2 And Tier-3 Suppliers
A 2025 survey of 800 manufacturers revealed that 70% of smaller suppliers delayed Industry 4.0 investments due to payback horizons beyond five years, a threshold misaligned with volatile order books. Deloitte found that 58% of SMEs deferred automation projects in 2024 because potential volume swings could strand assets prior to full cost recovery. Attribution is challenging; a German tier-one spent EUR 3 million (USD 3.4 million) on a digital-twin suite yet struggled to isolate its contribution to a 12% scrap reduction because multiple process changes occurred simultaneously. While subsidies alleviate upfront costs, application paperwork can overwhelm firms without in-house engineering capacity, delaying access to funds.
Workforce Upskilling And Union Push-Back On Cobot Adoption
The World Economic Forum expects that half the global factory workforce required reskilling by 2025, yet average training budgets sat at only 1.2% of payroll, constraining progress.[2]World Economic Forum, “Future of Jobs Report,” weforum.org German union IG Metall negotiated rules demanding human supervisory oversight for cobots, trimming productivity gains and complicating ROI math. Similar clauses in 2024 United Auto Workers contracts bind automotive OEMs to retraining obligations for any displaced roles. In Japan, veteran machinists resist training successors on robotic systems, fearing accelerated obsolescence, which slows knowledge transfer. Companies have begun to deploy augmented-reality overlays that guide repairs in real time, but headset costs and software licenses remain a hurdle for cash-constrained SMEs.
*Our forecasts treat driver/restraint impacts as directional, not additive. The impact forecasts reflect baseline growth, mix effects, and variable interactions.
Segment Analysis
By Technology Type: Blockchain Adoption Accelerates Traceability Mandates
Industry automation technologies held 38.33% revenue in 2025, anchoring production lines with programmable logic controllers and supervisory systems vital to the Industry 4.0 market. Blockchain, though only mid-single-digit spending today, is forecast to grow at 22.81% annually through 2031 as regulators tighten traceability rules for pharmaceuticals and vehicle components.[3]IBM, “Food Trust Blockchain Platform,” ibm.com Nestlé and Walmart joined a 500-member food consortium in 2025, raising confidence in permissioned ledgers for cold-chain integrity. Industrial IoT sensors captured 19% of technology budgets, funneling vibration, temperature, and pressure data into predictive-maintenance models. Artificial intelligence held 14% share, mainly vision inspection and demand forecasting, but edge-compatible chips are lowering inference costs, broadening use cases. Extended-reality platforms posted a 21% jump as aerospace assemblers cut error rates on complex airframe tasks. Digital twins represented 11% of spending, aiding automotive firms in simulating capacity changes before committing capital.
Expanded use of additive manufacturing is reshaping spare-parts logistics. GE Aerospace produced 100,000 fuel-nozzle parts via powder-bed fusion in 2025, slashing lead times from 18 months to three. Edge computing and private 5G infrastructure, at 7% share, are growing swiftly as manufacturers adopt on-premises analytics to satisfy data-sovereignty mandates and lower cloud egress fees. The Industry 4.0 market size for blockchain-centric applications is expected to widen considerably as automotive recalls and pharmaceutical serialisation laws enforce immutable data trails. Vendors combining AI vision, edge inference, and permissioned ledgers now position themselves as end-to-end compliance providers in the Industry 4.0 industry.


By Component: Software Platforms Rise As Subscription Economics Mature
Hardware captured 42.21% of 2025 revenue, reflecting robot, sensor, and edge-server purchases indispensable to large-scale digitization in the Industry 4.0 market. Software is projected to grow at a 21.57% CAGR through 2031 as perpetual licenses give way to SaaS, slicing first-year costs for SMEs and ensuring continuous updates. Siemens MindSphere attracted 1,200 new clients in 2025 on pay-as-you-go rates, bundling predictive maintenance and energy dashboards under one contract. SAP Digital Manufacturing Cloud integrated with over 50 equipment brands, enabling unified visibility across multi-site inventory and quality data. Services, including integration and managed support, accounted for 31% revenue as buyers outsource complex retrofits; Rockwell Automation noted 65% of 2025 bookings carried multi-year service terms.
Hardware spending is concentrating in edge-AI accelerators and smart cameras. Intel shipped 2.3 million inference processors to industrial clients in 2025, embedding neural networks inside cameras, cutting network traffic by processing images locally. Regulatory pressure also drives software demand; the FDA requires statistical process control for continuous drug manufacturing, prompting pharma plants to adopt real-time data historians and lab-information links. In turn, the Industry 4.0 market size for SaaS-based twins, historians, and analytics tools is widening faster than hardware budgets, underscoring a secular transition toward data-driven operations within the Industry 4.0 industry.
By Deployment Model: Hybrid Cloud Concepts Temper Security Concerns
On-premises solutions formed 57.63% of 2025 installations, a reminder that many manufacturers still favor air-gapped networks to mitigate ransomware risks in the Industry 4.0 market. Cloud deployments are forecast to accelerate at 21.17% annually as hybrid models split low-latency tasks from heavy analytics. Volkswagen’s Industrial Cloud hosts simulation and analytics on AWS while maintaining deterministic control loops at the edge, balancing scalability with process integrity. Schneider Electric migrated 40% of customers to cloud dashboards that aggregate energy and asset data across dispersed plants, proving that multitenant environments can satisfy ISO 27001 and SOC 2 audits.
Hybrid deployments, 18% of 2025 installations, deliver resilience by executing containerized applications locally and syncing telemetry when bandwidth permits, a critical feature during network outages. Siemens notes that 55% of digital-twin workloads ran in the cloud in 2025, reflecting compute-intensive multiphysics simulations impractical on local servers. Data-sovereignty laws in the European Union and China compel geo-fenced storage, encouraging edge gateways with configurable data-routing. As zero-trust frameworks mature, cloud adjacency will likely further erode the on-premises lead, reshaping the Industry 4.0 market share between deployment models.
By End-User Industry: Healthcare And Pharma Outpace Traditional Segments
Discrete manufacturing captured 37.62% revenue in 2025, covering automotive, electronics, and machinery producers foundational to the Industry 4.0 market. Healthcare and pharmaceutical plants are expected to grow at a 21.93% CAGR through 2031, driven by FDA guidance on continuous manufacturing that mandates sensor-dense, digitally validated lines for real-time quality release. Pfizer employed digital twins in its vaccine network to simulate yield improvements without halting production. Moderna automated mRNA synthesis in 2025, improving first-pass yield to 98%. Automotive producers, 16% of spending, focus on battery assembly lines that need torque-controlled fastening and thermal imaging, while oil and gas operators deploy remote monitoring to cut offshore site visits 25%.
Food and beverage firms adopted vision-based inspection in 2025, achieving 99.5% defect-detection accuracy and reducing recalls by 40%. Aerospace contractors, 7% share, harness augmented-reality guides to reduce assembly errors 35%. Warehousing outfits use autonomous mobile robots to raise throughput by 50% in e-commerce fulfillment, tying logistics into the core Industry 4.0 market. As regulatory mandates and margin pressures converge, the Industry 4.0 market size for healthcare applications is set to eclipse early adopters, illustrating how compliance can catalyze digital spending across the Industry 4.0 industry.
Geography Analysis
North America commanded 35.13% revenue in 2025, aided by USD 85 billion hyperscaler data-center spending that supplies low-latency compute for simulations and AI workloads. Mexico drew USD 40 billion manufacturing investment in 2025 as firms nearshored to cut tariff exposure, a trend bolstering sensor and robotics demand. The U.S. Manufacturing Extension Partnership demonstrated scalable SME adoption, reinforcing that federal technical assistance accelerates digital penetration beyond multinationals. Cybersecurity guidelines from CISA are shaping vendor roadmaps as buyers demand built-in zero-trust controls.
Asia Pacific is forecast to grow at a 21.18% CAGR through 2031, powered by China’s USD 1.4 trillion Made in China 2025 agenda, India’s USD 26 billion Production-Linked Incentive schemes, and Japan’s Society 5.0 policy that aligns digital tools with aging-workforce challenges. South Korea invested USD 15 billion in smart-factory programs in 2025, concentrating on semiconductor and battery-cell lines requiring sub-micron tolerances. Singapore’s Smart Industry Readiness Index helped 300 firms benchmark maturity, enabling phased digital rollouts that avoid over-capitalization.
Europe held 22% revenue in 2025, underpinned by Germany’s Industrie 4.0 platform and U.K. subsidies. Mittelstand firms ramped digital-twin investment by 42% as SaaS pricing harmonized with cash flows. The European Union’s Carbon Border Adjustment Mechanism, effective January 2026, has spurred energy-management installations that log emissions data for tariff compliance.[4]European Commission, “Carbon Border Adjustment Mechanism,” ec.europa.eu The Middle East, with 4% share, channels spending into remote monitoring for oil and gas, exemplified by Saudi Aramco’s upstream deployments. Africa, at 2%, shows early gains in South African automotive plants and Nigerian food processors, although infrastructure gaps and skills shortages limit scale.

Competitive Landscape
The Industry 4.0 market is moderately concentrated, with the top ten vendors accounting major share of combined 2025 revenue, yet none exceeding 8%. Siemens, ABB, and Schneider Electric embed edge-AI inference into programmable logic controllers, countering hyperscalers that bundle IoT with analytics. Siemens filed 1,200 industrial AI and digital-twin patents in 2024, most in the category, signaling an intellectual-property moat. Startups targeting brownfield retrofits raised USD 180 million in 2025 to deploy wireless vibration sensors and cloud diagnostics, bypassing costly equipment swaps.
White-space growth emerges where automation penetration was traditionally low. Food processors, automating only 22% of tasks in 2024, now deploy vision systems to meet EU Farm to Fork traceability mandates. Pharmaceutical companies adopt blockchain for clinical-trial supply chains, improving protocol adherence by 30%. Standards convergence also reshapes competition; by September 2025, 4,500 vendors had adopted OPC Unified Architecture, easing multi-vendor integration costs. Strategic alliances abound; Rockwell Automation and Microsoft now embed Azure AI services into FactoryTalk, enabling factory-floor machine-learning without data-science expertise.
As hyperscalers deepen vertical specialization and automation incumbents pivot to software, acquisition pipelines intensify. Siemens acquired Altair Engineering for USD 10.6 billion in October 2025 to consolidate simulation and analytics, challenging Dassault and PTC in high-value digital-twin deals. ABB bought ASTI Mobile Robotics for USD 200 million, expanding into autonomous intralogistics. Schneider Electric’s software-defined automation launch demonstrates the pivot from proprietary hardware to vendor-agnostic control logic. The Industry 4.0 market continues to reward firms that orchestrate hardware, software, and services into integrated, standards-compliant stacks.
Leaders of Industry 4.0 Market
ABB Ltd
Siemens AG
Schneider Electric SE
Rockwell Automation Inc.
Honeywell International Inc.
- *Disclaimer: Major Players sorted in no particular order

Recent Industry Developments
- December 2025: Siemens announced a EUR 2 billion (USD 2.26 billion) plan to expand its digital-industries software portfolio, including the USD 10.6 billion Altair Engineering acquisition.
- September 2025: ABB completed its USD 200 million purchase of ASTI Mobile Robotics, adding autonomous mobile robots to its lineup.
- August 2025: Schneider Electric introduced EcoStruxure Automation Expert 2.0, a vendor-agnostic control platform with 150 early adopters.
- July 2025: Rockwell Automation and NVIDIA integrated AI-based vision inspection into FactoryTalk, achieving 99.7% defect-detection accuracy.


Research Methodology Framework and Report Scope
Market Definitions and Key Coverage
Our study defines the Industry 4.0 market as the value of hardware, software platforms, and associated services that digitize factory-floor and supply-chain operations through industrial IoT, robotics, AI/ML analytics, digital twins, blockchain, extended reality, and additive manufacturing. Revenues are captured only when the technology is deployed inside production or logistics environments; pilot proofs of concept are counted once commercialized.
Scope exclusion: pure IT modernization projects that never interface with operational technology layers are kept outside this market.
Segmentation Overview
- By Technology Type
- Industrial Robotics
- Industrial Internet of Things (IIoT)
- Artificial Intelligence and Machine Learning
- Blockchain
- Extended Reality (AR/VR/MR)
- Digital Twin
- 3D Printing / Additive Manufacturing
- Edge Computing and Private 5G
- By Component
- Hardware
- Software / Platforms
- Services (Integration, Consulting, Support)
- By Deployment Model
- On-Premises
- Cloud
- Hybrid
- By End-User Industry
- Discrete Manufacturing
- Automotive
- Oil and Gas
- Energy and Utilities
- Electronics and Semiconductor Foundry
- Food and Beverage
- Aerospace and Defense
- Healthcare and Pharma
- Logistics and Warehousing
- By Geography
- North America
- United States
- Canada
- Mexico
- South America
- Brazil
- Rest of South America
- Europe
- Germany
- United Kingdom
- France
- Italy
- Spain
- Nordics
- Rest of Europe
- Middle East
- Saudi Arabia
- United Arab Emirates
- Rest of Middle East
- Africa
- South Africa
- Nigeria
- Rest of Africa
- Asia-Pacific
- China
- Japan
- South Korea
- India
- Singapore
- Australia
- Rest of Asia-Pacific
- North America
Detailed Research Methodology and Data Validation
Primary Research
Mordor analysts complemented desk work with interviews and surveys covering plant managers, automation systems integrators, industrial software vendors, and regional policy bodies across North America, Europe, and Asia-Pacific. These conversations validated penetration rates, typical retrofit budgets, and forecast headwinds such as chip lead times and cyber security liabilities.
Desk Research
We begin with a wide desk scan that pulls structured statistics from tier-1 public sources such as the International Federation of Robotics, World Bank industrial value-added series, Eurostat's PRODCOM, United States Census Annual Survey of Manufactures, and WTO trade codes for industrial controllers. Company 10-Ks, investor decks, and selected patent families from Questel reveal adoption velocity and pricing inflections for sensors, cobots, and 3D-printing powders.
Next, our analysts cross-reference shipment logs from Volza, contract awards flagged by Tenders Info, and regional policy trackers (for example, Germany's "Industrie 4.0 Plattform") to size brownfield retrofit spending. These sources establish baselines for unit volumes, average selling prices, and installed-base churn. The list is indicative; many additional publications and datasets were mined to refine assumptions and close data gaps.
Market-Sizing & Forecasting
A top-down model converts global manufacturing output into an Industry 4.0 addressable spend pool, which is then aligned with technology-level adoption curves. Select bottom-up checks, supplier roll-ups and channel ASP × volume samples, are applied to calibrate totals before sign-off. Key variables include industrial robot density per 10,000 workers, IIoT node shipments, edge AI chipset ASPs, additive manufacturing powder consumption, and smart factory CAPEX ratios. Five-year projections employ a multivariate regression that blends manufacturing PMI trends, corporate CAPEX outlooks, and government incentive pipelines, with coefficients reviewed by our primary experts.
Data Validation & Update Cycle
Outputs face a three-tier peer review, variance tests against external macro and micro indicators, and anomaly callbacks to expert respondents. Mordor refreshes each dataset annually, issuing mid-cycle amendments when material events, such as major fiscal incentives or supply shocks, shift the underlying series.
Why Mordor's Industry 4.0 Baseline Is the Dependable Compass
Published estimates do vary, largely because firms mix consumer IoT, generic IT services, or standalone analytics tools into their totals, and because refresh cadences range from quarterly to multi-year cycles.
Key gap drivers include differing inclusion of pilot projects, diverging ASP deflators, and whether services linked to legacy SCADA upgrades are counted. Mordor's disciplined boundary setting, yearly model rebuild, and dual-angle validation remove these distortions.
Benchmark comparison
| Market Size | Anonymized source | Primary gap driver |
|---|---|---|
| USD 260.4 B (2025) | Mordor Intelligence | - |
| USD 190.9 B (2025) | Global Consultancy A | Excludes managed services and digital twin software; uses lower ASP benchmarks |
| USD 200.1 B (2024) | Trade Publication B | Counts only hardware; adjusts currency at fixed 2021 rates |
| USD 551.7 B (2024) | Research Boutique C | Adds generic cloud and enterprise analytics spend; no adoption rate filters |
These comparisons show how scope breadth, pricing assumptions, and update timing alter totals. By anchoring figures to clear operational technology boundaries and regularly re-testing inputs, Mordor delivers a balanced, transparent baseline that decision-makers can replicate and trust.


Key Questions Answered in the Report
What is the projected value of the Industry 4.0 market by 2031?
It is forecast to reach USD 790.29 billion, advancing at a 20.26% CAGR.
Which region is expected to grow the fastest through 2031?
Asia Pacific is projected to register a 21.18% CAGR, bolstered by large-scale subsidy programs in China and India.
Why are blockchain technologies gaining traction in manufacturing?
Pharmaceutical and automotive regulations now demand immutable traceability, driving a 22.81% annual growth outlook for blockchain use cases.
How are SMEs overcoming high upfront costs for digital tools?
Subscription-based software, government vouchers, and cloud deployment models have lowered initial investment by up to 60%.
What is the main barrier to Industry 4.0 adoption among smaller suppliers?
Uncertain return-on-investment timelines, often extending beyond five years, deter capital-constrained tier-2 and tier-3 firms.
Page last updated on:


