
Motor Monitoring Market Size and Share
Market Overview
| Study Period | 2020 - 2031 |
|---|---|
| Market Size (2026) | USD 2.62 Billion |
| Market Size (2031) | USD 3.64 Billion |
| Growth Rate (2026 - 2031) | 6.82 % |
| Fastest Growing Market | Asia Pacific |
| Largest Market | North America |
| Market Concentration | Medium |
Major Players
*Disclaimer: Major Players sorted in no particular order Image © Mordor Intelligence. Reuse requires attribution under CC BY 4.0. |
|
Motor Monitoring Market Analysis by Mordor Intelligence
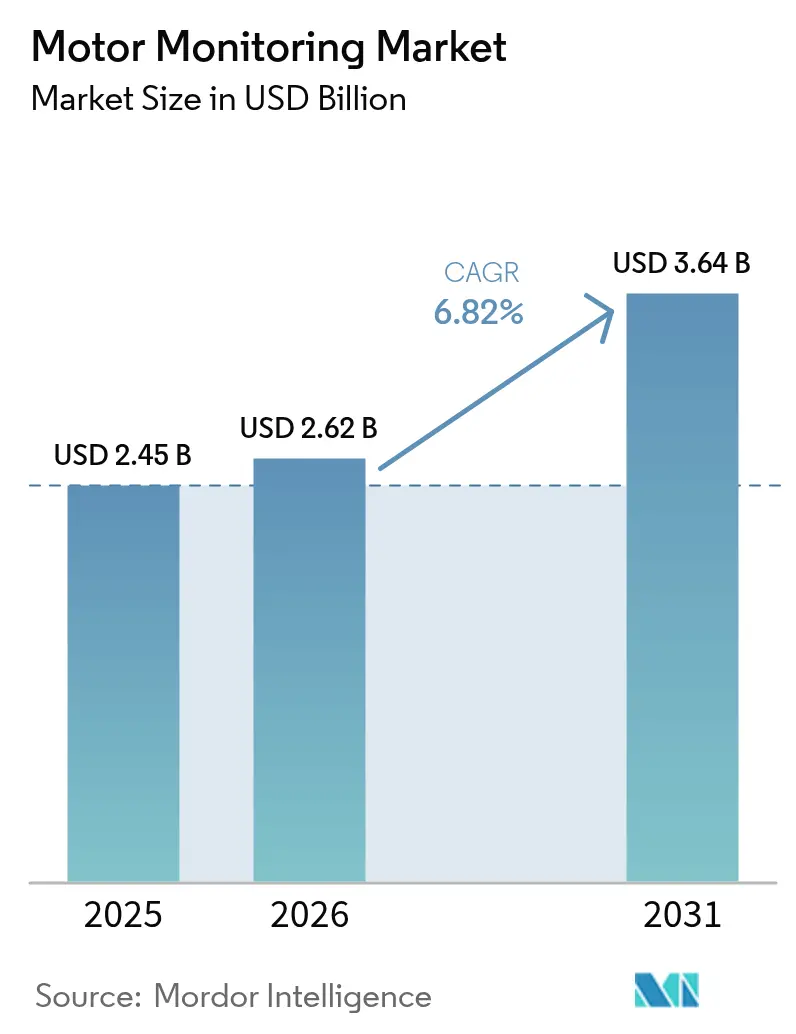
The motor monitoring market size is expected to grow from USD 2.45 billion in 2025 to USD 2.62 billion in 2026 and is forecast to reach USD 3.64 billion by 2031 at 6.82% CAGR over 2026-2031. Edge-enabled predictive maintenance platforms that anticipate failures up to 40 hours in advance are driving adoption across capital-intensive industries. Industrial Internet of Things (IIoT) architectures coupled with embedded artificial intelligence now deliver real-time insights that cut unplanned downtime by as much as 50%, a saving especially relevant to sectors where production stops can cost USD 50 billion annually. Hardware still accounts for most outlays, yet managed analytics services are accelerating as firms seek external expertise for complex diagnostics. North America leads on account of strict efficiency mandates, while Asia-Pacific is the fastest-growing region thanks to rapid manufacturing expansion and supportive government programs. Vendor competition is intensifying as automation majors acquire specialist sensor firms to strengthen edge-AI portfolios and address swelling demand for cloud-ready solutions. [1]B. Adams, “IEC 60034 Efficiency Updates,” iec.ch
Key Report Takeaways
- By offering, hardware led with 68.45% of the motor monitoring market share in 2025; services are projected to grow at a 9.34% CAGR through 2031.
- By deployment, on-premises solutions held 73.10% of the motor monitoring market size in 2025, while cloud-based models are expanding at a 11.75% CAGR.
- By monitoring technique, vibration analysis dominated with 40.35% revenue share in 2025; oil analysis is forecast to rise at a 9.66% CAGR to 2031.
- By end-user industry, oil and gas accounted for 28.10% of the motor monitoring market share in 2025, whereas renewable energy is growing at a 9.12% CAGR.
- By motor type, AC motors retained 62.35% of the motor monitoring market size in 2025; servo and stepper motors will register the fastest 9.38% CAGR.
- By geography, North America led with 34.70% revenue share in 2025; Asia-Pacific is set to expand at a 9.98% CAGR.
Note: Market size and forecast figures in this report are generated using Mordor Intelligence’s proprietary estimation framework, updated with the latest available data and insights as of 2026.
Global Motor Monitoring Market Trends and Insights
Drivers Impact Analysis*
| Driver | (~) % Impact on CAGR Forecast | Geographic Relevance | Impact Timeline |
|---|---|---|---|
| Accelerated deployment of Industry 4.0 production lines | +1.80% | Global, with APAC and Europe leading adoption | Medium term (2-4 years) |
| Government tax-credit programmes for smart-factory retrofits | +1.20% | North America and EU, expanding to APAC | Short term (≤ 2 years) |
| Falling ASP of high-power red-laser emitters | +0.90% | Global manufacturing hubs | Long term (≥ 4 years) |
| Rapid shift to zero-defect packaging lines in F&B | +1.10% | Global, concentrated in developed markets | Medium term (2-4 years) |
| New IEC 61496-5 safety-rated photoelectric standards | +0.70% | Global, mandatory compliance regions first | Short term (≤ 2 years) |
| AI-enabled self-calibration reducing maintenance labour | +1.00% | Advanced manufacturing economies | Long term (≥ 4 years) |
| Source: Mordor Intelligence | |||
Rising Adoption of Predictive Maintenance Platforms
Predictive maintenance platforms now combine vibration, current, acoustic and thermal data with machine-learning models that deliver 91% anomaly detection accuracy and cut breakdowns by 30-50%. Steel makers have demonstrated 40-hour failure forecasts, and mining operators report nine-fold returns from averting unplanned stoppages. The economic case continues to sharpen as cloud analytics turn raw sensor feeds into prescriptive work orders that reduce spare-parts inventories and overtime labour. [2]OMRON, "3D TOF Sensor Module | OMRON Device & Module Solutions," January 1, 2025, components.omron.com
Rapid Shift Toward Wireless, Battery-less Sensor Networks
Energy-harvesting designs that draw micro-watts from motor magnetic fields eliminate battery swaps and wiring, slashing lifetime ownership costs. Commercial modules such as TDK’s i3 integrate on-board edge-AI to extend operating life by 50% while forming self-healing mesh networks over industrial campuses. These untethered nodes unlock monitoring in ship engine rooms and offshore rigs where access is costly and hazardous.
Integration of IIoT and Digital Twin Architectures
Digital twins merge real-time motor telemetry with physics-based simulations to test “what-if” maintenance scenarios before any service crew is dispatched. Siemens’ SIMOCODE M-CP embeds anomaly detection directly into switchboards, pairing field data with virtual replicas to optimize protection settings. Academic trials show digital-twin gearbox models achieving 99% fault-classification precision, enabling operators to schedule maintenance during low-production windows. Utilities using Emerson’s Ovation 4.0 platform report smoother load balancing and longer overhaul intervals.
Stricter Global Motor-Efficiency Regulations
Updated IEC 60034 rules oblige motors up to 1 MW to meet IE3 or IE4 tiers, pushing enterprises to verify efficiency continuously via sensor feedback. The U.S. Department of Energy estimates that new standards will save 7 quadrillion Btu over 30 years, reinforcing the business case for condition monitoring. Component makers such as Eaton now market silicon-carbide drives that exceed 95% efficiency and feed operational metrics into cloud dashboards for regulatory audits.
Restraints Impact Analysis*
| Restraint | (~) % Impact on CAGR Forecast | Geographic Relevance | Impact Timeline |
|---|---|---|---|
| Uptake of low-cost 3D ToF cameras in short-range picking | -0.80% | Global, concentrated in logistics and e-commerce | Medium term (2-4 years) |
| High replacement rate in wash-down environments | -0.50% | Food processing and pharmaceutical regions | Short term (≤ 2 years) |
| Volatile gallium-arsenide spot prices | -0.60% | Global semiconductor supply chains | Short term (≤ 2 years) |
| Fragmented OEM interface protocols | -0.40% | Global, affecting system integration | Long term (≥ 4 years) |
| Source: Mordor Intelligence | |||
High Upfront CAPEX and ROI Uncertainty
Full-scale deployments often require USD 100,000 or more for sensors, gateways and integration, a burden that can deter mid-sized plants despite potential 10-40% maintenance savings. Case studies show early models may drift when equipment is modified, necessitating extra spend on algorithm retraining, which prolongs payback horizons. Vendors are responding with subscription-based offerings and staged pilots to mitigate financial risk for cost-sensitive buyers.
Shortage of Domain-Skilled Reliability Engineers
Industrial automation roles show only nine qualified candidates per posting, inflating salaries to USD 72,000–114,000 and delaying project rollouts. The hybrid skillset that blends motor mechanics with data science remains scarce, prompting manufacturers to outsource analytics or adopt low-code platforms that embed predictive models to compensate for talent gaps. [3]U.S. Geological Survey, "Mineral Commodity Summaries 2024," January 30, 2024, pubs.usgs.gov.
*Our forecasts treat driver/restraint impacts as directional, not additive. The impact forecasts reflect baseline growth, mix effects, and variable interactions.
Segment Analysis
By Offering: Services Drive Digital Transformation
Services generated a 9.34% CAGR outlook as companies turn to external specialists for integration, analytics and lifecycle optimization. While hardware retained 68.45% of 2025 revenue, complex multivendor environments now prioritize data interpretation over sensor procurement. Emerson’s USD 8.2 billion purchase of NI underscores the pivot toward higher-margin service revenue streams that embed continuous monitoring into broader automation contracts.
Hardware makers are repositioning as solution providers by bundling gateways, cloud connectors and managed dashboards. Regal Rexnord’s Perceptiv platform integrates field sensors with analytics that reportedly cut expected failures by 55% and stretch machine life 40%. As value migrates to insights rather than components, hybrid commercial models encompassing equipment, software and support are becoming the norm across the motor monitoring market.




By Deployment: Cloud Adoption Accelerates
On-premises architectures kept 73.10% revenue share in 2025 because critical plants still favour local control for latency and data-sovereignty reasons. Nevertheless, cloud deployments hold the fastest 11.75% CAGR as cybersecurity standards mature and 5G networks lower backhaul costs. Honeywell’s collaboration with Verizon embeds cellular intelligence in meters to stream usage data securely to analytics hubs, showcasing the hybrid edge-cloud approach gaining traction.
Academic research flags four common vulnerabilities in cloud-SCADA links—shared resources, insider threats, insecure protocols and connectivity gaps—yet the adoption of zero-trust architectures and network-based intrusion detection is mitigating risk. Manufacturers increasingly process safety-critical data locally while offloading deep-learning workloads and fleet benchmarking to the cloud, a pattern that boosts scalability without compromising uptime across the motor monitoring market.
By Monitoring Technique: Oil Analysis Gains Momentum
Vibration analysis remained the largest segment at 40.35% in 2025, but oil analysis is forecast to climb at a 9.66% CAGR because it detects microscopic wear particles well before vibrational signatures shift. Field studies show lubrication assays spotting bearing distress weeks earlier, enabling orderly maintenance scheduling for million-dollar assets.
Thermography and ultrasonics are also rising as complementary modalities. Continental Automotive’s rotor temperature sensor narrows tolerance bands to 3 °C, enhancing thermal insight for electric drivetrains. Integrated platforms that merge multiple techniques within unified dashboards deliver higher diagnostic confidence and fewer false positives, a trend that strengthens demand across the motor monitoring market.
By Motor Type: Servo Precision Expands
AC motors continued to dominate with 62.35% of 2025 revenue, reflecting their ubiquity in pumps, fans and compressors. Servo and stepper models, however, are on a 9.38% CAGR trajectory as robotics and high-speed pick-and-place systems demand tight positional accuracy. Schneider Electric’s Lexium 38i integrates monitoring electronics within a compact housing, simplifying installation and enabling real-time health scoring.
Permanent-magnet synchronous motors in electric vehicles pose new monitoring challenges around demagnetization and thermal runaway. Research reports 98% detection accuracy for bearing faults when combining current and vibration features, underlining the importance of multi-signal analytics for next-generation drive systems.

By End-User Industry: Renewable Energy Surges
Oil and gas kept 28.10% of 2025 revenue, yet renewable energy applications carry a 9.12% CAGR, led by offshore wind farms that require 24/7 drivetrain surveillance. The U.S. alone has 52 GW of projects in development, each relying on predictive analytics to cut costly sea-borne service visits.
Automotive makers adopt AI-driven diagnostics to speed model changes, and miners post a ninefold ROI by halting critical failures before they cascade. Food processors such as Danish Crown report 15% Overall Equipment Effectiveness gains from standardized data workflows, highlighting broadening appeal across the motor monitoring market.
Geography Analysis
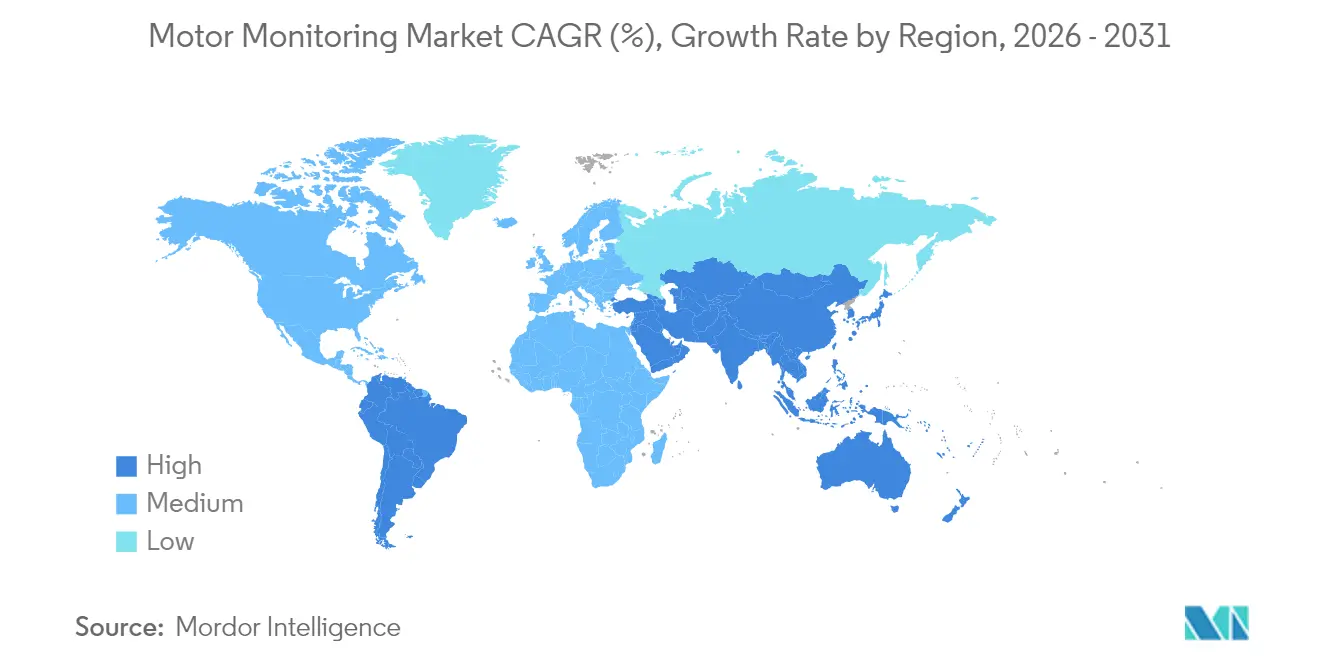
Asia-Pacific holds the strongest growth outlook at a 9.98% CAGR through 2031. Government policies such as China’s Smart Manufacturing 2025 blueprint are incentivizing sensor retrofits, and domestic vendors are releasing cost-competitive platforms to capture local demand. New product lines under Siemens’ “China Acceleration 2.0” and Mitsubishi Electric’s “Lingling” brand exemplify tailored strategies for this market, reinforcing momentum within the motor monitoring market. North America remains the revenue leader with 34.70% share in 2025 due to strict energy-efficiency rules and investments in grid and data-center resiliency. Schneider Electric’s USD 700 million expansion across five U.S. plants illustrates how suppliers are localizing production to support federal infrastructure programs that prioritize condition-based maintenance in energy, water and manufacturing sectors. Europe shows steady demand fuelled by sustainability mandates and circular-economy goals. SKF’s Infinium bearings—capable of indefinite reuse through laser metal deposition—demonstrate how European suppliers align monitoring solutions with resource efficiency. Emerging regions in South America and Middle East and Africa are adopting monitoring technologies in mining and utility projects to enhance uptime amid harsh operating conditions, extending the global reach of the motor monitoring market.

Regulatory Landscape
Motor monitoring demand is shaped by tightening motor efficiency and product sustainability rules that increase the need for auditable operating data. IEC efficiency classifications remain a primary global anchor, with BS EN IEC 60034-30-1:2026 effective from January 2026 introducing an IE5 class and revised efficiency-class coefficients across 0.12 kW to 1,000 kW motors, raising the bar for how plants verify efficiency during operation.
In the United States, the Department of Energy adopted amended energy conservation standards for expanded-scope electric motors in January 2025, with compliance required on and after June 1, 2027, and a Federal Register final determination for small electric motors published February 13, 2026 (effective March 16, 2026). In Europe, Commission Regulation (EU) 2019/1781 continues to set ecodesign requirements for electric motors and variable speed drives while under review through Spring 2027, and Regulation (EU) 2024/1781 (June 13, 2024) establishes a broader Ecodesign for Sustainable Products framework that supports lifecycle-oriented reporting, increasing emphasis on digitally captured performance and condition records.
Value Chain Analysis
The value chain spans sensing and embedded compute, connectivity, analytics software, and delivery through OEMs and service channels. Upstream suppliers provide vibration and current sensors, wireless nodes, and edge gateways, while standards-driven efficiency and safety requirements raise the need for higher-accuracy instrumentation and secure data handling. Midstream, AI diagnostics and condition monitoring platforms translate raw signals into alarms, remaining useful life estimates, and maintenance work orders, increasingly packaged as subscriptions or managed services rather than one-time hardware purchases.
Downstream integration and lifecycle services are becoming a key differentiator as plants pursue multi-vendor interoperability and faster time-to-value. Fluke Reliability and Treon (May 2025) paired Treon Connect wireless sensors with Fluke's eMaint platform, and SEW-Eurodrive and Schaeffler (April 2025) linked Optime wireless vibration sensing and cloud analytics into DriveRadar APPredict. Modernization of installed bases is also a major route to scale, exemplified by ABBs October 2025 launch embedding Samotics-powered Electrical Signature Analysis into legacy variable speed drives to retrofit predictive maintenance without replacing core assets.
Competitive Landscape
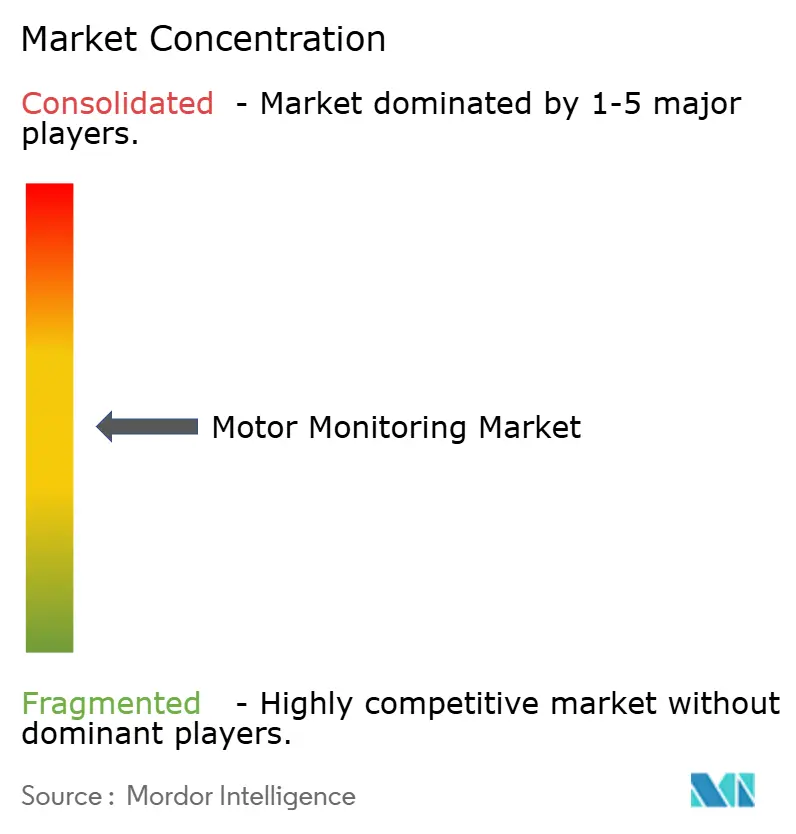
Competition is moderately fragmented, with consolidation reshaping market boundaries. KPS Capital Partners’ EUR 3.5 billion purchase of Siemens’ Innomotics and WEG’s acquisition of Marathon Electric underscore a shift toward vertically integrated portfolios that span motors, sensors and analytics. ABB secured niche pump-motor expertise through its Aurora Motors deal, mirroring peers that target specialized segments to deepen domain knowledge.
Technology differentiation now centers on edge-AI chips and battery-less sensor design. TDK’s ultracompact i3 module embeds machine-learning inference at the node, reducing data traffic and prolonging operating life. MIT’s magnetic-field energy harvester enables self-powered sensors in confined spaces, opening white-space opportunities for newcomers that can commercialize advanced power-scavenging techniques.
Cloud-native entrants such as Samotics leverage advanced blockage-detection algorithms to help utilities avoid pollution incidents and regulatory fines, pressuring incumbents to accelerate software innovation. As margins on commoditized hardware erode, sustained advantage hinges on data analytics depth, integration services and cybersecurity credentials across the motor monitoring market.
Motor Monitoring Industry Leaders
-
Omron Corporation
-
Keyence Corporation
-
Panasonic Holdings Corporation
-
Rockwell Automation Inc.
- *Disclaimer: Major Players sorted in no particular order

Market Opportunities and Future Outlook
A near-term opportunity centers on compliance-grade monitoring that supports efficiency-class verification and broader sustainability documentation as IEC 60034-30-1:2026 introduces IE5 class thresholds and the EU shifts from the legacy ecodesign directive toward the Ecodesign for Sustainable Products framework (Regulation (EU) 2024/1781). This supports demand for solutions that combine condition monitoring with energy and performance evidence trails that maintenance teams and compliance functions can reuse for audits, particularly in regulated industrial footprints where on-premises deployments still dominate.
Interoperable predictive maintenance architectures are also taking shape through standards work, which reduces friction between sensors, edge gateways, and analytics. EN IEC 63270-1:2025 defines functional structures and data requirements for predictive maintenance of industrial automation equipment (including motors), and ISO 13381-1:2025 updates prognostics guidance for modelling and remaining useful life estimation; national adoptions such as MEST EN IEC 63270-1:2026 taking effect June 1, 2026 strengthen implementation pathways. Alongside standards, lightweight diagnostic methods that use existing low-frequency signals, such as SCADA proxies for stator-winding degradation, create additional upgrade routes for legacy plants facing high upfront retrofit costs, supporting expansion of monitoring coverage without a full sensor rebuild.
Recent Industry Developments
- April 2026: OMRON updated Sysmac Studio (v1.58) to add AI-driven diagnostic functions aimed at anomaly detection in servo axes and predictive maintenance support for I/O modules. The edge-oriented approach emphasizes diagnostics that operate without cloud connectivity, aligning with plants that prefer on-premises monitoring and tighter data-sovereignty controls.
- May 2025: Fluke Reliability announced a strategic partnership with Treon to integrate Treon Connect wireless condition monitoring sensors with Flukes eMaint platform. The combination links always-on sensor data with computerized maintenance management workflows, supporting broader rollouts that depend on automated work order creation and fleet-level analytics.
- September 2024: Augury integrated Baker Hughes sixth-generation Ranger Pro wireless condition monitoring sensor into the Augury Machine Health platform to address hazardous industrial environments. The update expands the addressable installed base where wired instrumentation is difficult and reinforces platform ecosystems built around certified sensors and centralized diagnostics.


Research Methodology Framework and Report Scope
Market Definition and Coverage
This market covers solutions used to track the health and performance of electric motors in industrial and commercial settings, so operators can detect faults early and improve uptime. Revenue is counted from monitoring hardware and related software used to collect, analyze, and alert on motor condition.
Scope exclusions: Standalone motor sales, general plant automation controls, and maintenance labor that is not tied to a motor monitoring solution are excluded.
Segmentation Overview
-
By Offering
- Hardware
- Software
- Services
-
By Deployment
- On-Premise
- Cloud
-
By Monitoring Technique
- Vibration Analysis
- Motor Current Signature
- Thermography
- Oil Analysis
- Ultrasound and Acoustic
-
By Motor Type
- AC Motors
- DC Motors
- Servo and Stepper Motors
-
By End-User Industry
- Oil and Gas
- Energy and Power
- Automotive
- Mining and Metals
- Food and Beverage
- Chemicals
- Aerospace and Defense
- Other Industries
-
By Geography
-
North America
- United States
- Canada
- Mexico
-
Europe
- Germany
- United Kingdom
- France
- Rest of Europe
-
Asia-Pacific
- China
- India
- Japan
- Rest of Asia-Pacific
-
South America
- Brazil
- Argentina
- Rest of South America
-
Middle East and Africa
- GCC
- Turkey
- South Africa
- Rest of Middle East and Africa
-
North America
Data Sources, Market Sizing, and Validation
Desk Research
Desk research is used to set the market boundaries and to anchor demand signals to observable industrial activity. We rely on public sources such as US Energy Information Administration statistics, International Energy Agency data, US Bureau of Labor Statistics production indicators, US Census Bureau trade data, and standards references from IEC and IEEE for common monitoring practices.
After that, company filings, investor presentations, product catalogs, and reputable press coverage are used to map typical monitoring configurations and how buyers structure budgets for them. Where needed, subscribed databases are used for company financials and news screening, patent lookups, and shipment level import and export checks to validate supply trends. These desk sources are not exhaustive, and we also used other public references as cross checks and for clarification.
Primary Interviews and Surveys
Primary work focuses on confirming what is actually purchased and deployed, and how pricing moves with features such as continuous monitoring, connectivity, and analytics. We speak with a mix of solution providers, channel partners, and end users across process industries and discrete manufacturing. Respondent input is balanced across APAC, EMEA, and the Americas to reduce location bias.
Distribution of primary research fieldwork respondents
| Company type | Respondent position | Region |
|---|---|---|
| Top tier: 27% | CXOs: 12% | APAC: 50% |
| Mid tier: 56% | Functional/Unit leaders: 28% | EMEA: 30% |
| Smaller Players: 17% | Managers: 60% | Americas: 20% |
Market-Sizing & Forecasting
The market is first built using a top-down logic where the installed motor base and operating intensity in key industries are translated into a realistic monitoring adoption pool, and then converted to annual spend using typical system pricing. To keep the totals practical, results are checked using selective bottom-up approximations, such as sampled average selling prices times expected unit volumes, and channel feedback on annual deployments.
Key inputs include the installed base of industrial motors in large sites, downtime sensitivity by end user, penetration of predictive maintenance programs, typical replacement and retrofit cycles for sensors and monitoring units, and the share of deployments using continuous monitoring rather than periodic testing. Pricing is tracked separately for hardware and software so that subscription growth is not mixed with one-time equipment purchases.
For forecasting, scenario analysis is used with a simple set of drivers that interviewees can validate, including industrial production trends, energy efficiency initiatives, and plant digitization spending. When bottom-up coverage is thin for a country or niche end use, gaps are filled using adoption ranges from comparable industries, then rechecked with regional expert feedback before finalizing.
Data Validation & Update Cycle
Numbers are validated through repeated cross checks, where model outputs are compared with independent signals such as automation spending direction, motor reliability programs, and observed pricing movement. Outliers are flagged early, and assumptions are revisited when a value looks too high for the implied deployment volume or too low for the stated feature mix.
Before sign-off, the model and key assumptions go through multi-step analyst reviews, and re-contacts are triggered when interview inputs differ widely from desk findings. Reports are refreshed annually, with interim updates added when there are material changes that can shift adoption or pricing. Right before delivery, a fresh analyst pass is completed so the view reflects the latest information available.
Mordor Intelligence's Motor Monitoring Market Size Compared Against Other Published Estimates
Published market sizes for motor monitoring do not always match, even when the topic name looks the same. Differences usually come from how each study draws the product scope, what year is treated as the starting point, and how software and service revenue is counted.
The spread is often explained by whether condition monitoring techniques (such as vibration analysis, motor current signature analysis, thermography, oil analysis, and ultrasound or acoustic methods) are all included, and whether services are blended into the same total as hardware and software. Some estimates also anchor to a 2024 base year and then apply a faster adoption curve, while others use a later base year and rely more on validated deployment cycles and pricing checks, which is how the 2026 value is constructed here. This scope choice is used by Mordor Intelligence.
Benchmark comparison
| Source | Market Size | Gaps in Research Methodology |
|---|---|---|
| Mordor Intelligence | USD 2.62 B (2026) | |
| Global Consultancy A | USD 2.43 B (2024) | Uses a 2024 base year and projects forward over 2025-2030, which can raise the apparent current value when adoption is assumed to accelerate early. Scope language is broader, and service revenue treatment is not always separated clearly from core monitoring solutions. |
| Industry Publisher B | USD 2.51 B (2024) | Anchors to 2024 and extends to 2032, which increases sensitivity to long-run assumptions on retrofit rates and ASP inflation. The write-up does not clearly state how monitoring techniques and bundled services are filtered, which can shift totals versus a tighter solution-only definition. |
Looking across the three figures, most of the gap is explained by base-year choice and what gets bundled into the definition of a monitoring solution. By tying the estimate to clear demand indicators such as installed motor base, adoption cycles, and realistic pricing splits, the result stays easier to trace and repeat for future updates without relying on hidden assumptions.


Key Questions Answered in the Report
What is the current size of the motor monitoring market?
The motor monitoring market generated USD 2.62 billion in 2026 revenue and is on track to reach USD 3.64 billion by 2031.
Which region leads the motor monitoring market?
North America held 34.70% market share in 2025, driven by strict efficiency mandates and robust digital infrastructure.
What segment is growing fastest within the motor monitoring market?
Services show the quickest expansion with a 9.34% CAGR because firms rely on external analytics and optimization expertise.
Why is oil analysis gaining prominence?
Oil analysis detects early wear particles, spotting faults weeks before vibration signatures and supporting a 9.66% CAGR for this technique.
How are wireless, battery-less sensors impacting adoption?
Energy-harvesting sensors remove battery maintenance, reduce wiring costs and enable monitoring in remote or hazardous locations, hastening deployment.
What are the main challenges to broader implementation?
High upfront costs and a shortage of reliability engineers remain key barriers, though subscription pricing and low-code analytics are easing both issues.
Page last updated on:


 Your data is secure and never sold or shared.


