Market Overview
| Study Period | 2020 - 2031 |
|---|---|
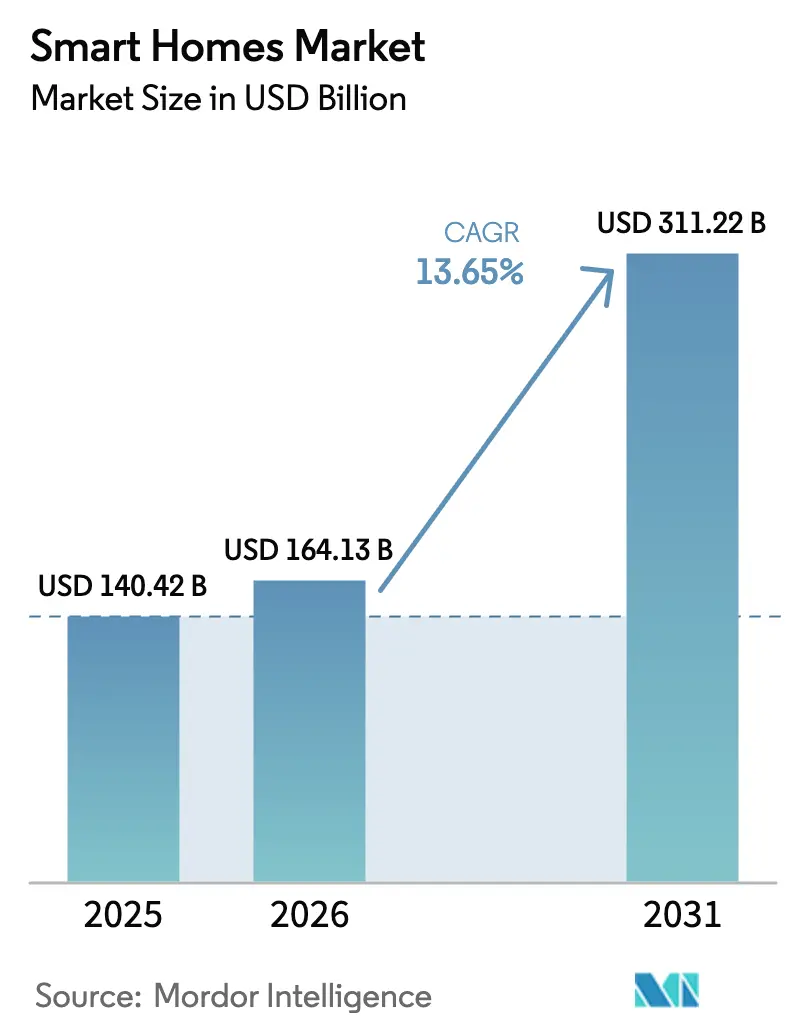
| Market Size (2026) | USD 164.13 Billion |
| Market Size (2031) | USD 311.22 Billion |
| Growth Rate (2026 - 2031) | 13.65% CAGR |
| Fastest Growing Market | Asia Pacific |
| Largest Market | North America |
| Market Concentration | Medium |
Major Players.webp) *Disclaimer: Major Players sorted in no particular order Image © Mordor Intelligence. Reuse requires attribution under CC BY 4.0. | |
Smart Homes Market Analysis by Mordor Intelligence
The Smart Homes Market size was valued at USD 140.42 billion in 2025 and is estimated to grow from USD 164.13 billion in 2026 to reach USD 311.22 billion by 2031, at a CAGR of 13.65% during the forecast period (2026-2031). The smart homes market growth is following a mainstream curve as Matter-enabled interoperability breaks down historic vendor lock-in, while tax incentives in the United States and Europe lower the ownership costs for connected HVAC, battery storage, and EV chargers. Uptake is accelerating among first-time buyers who treat automation as standard infrastructure rather than a luxury, a sentiment reinforced by visible savings from utility demand-response payouts. Hardware road maps now emphasize perimeter security, in-home health, and energy dashboards, with each area benefiting from rapid gains in low-power semiconductors that extend battery life and shrink form factors. Competitive strategies increasingly hinge on subscription revenues, as vendors monetize cloud storage, professional monitoring, and predictive maintenance analytics, thereby boosting lifetime value and smoothing cash-flow volatility.
Key Report Takeaways
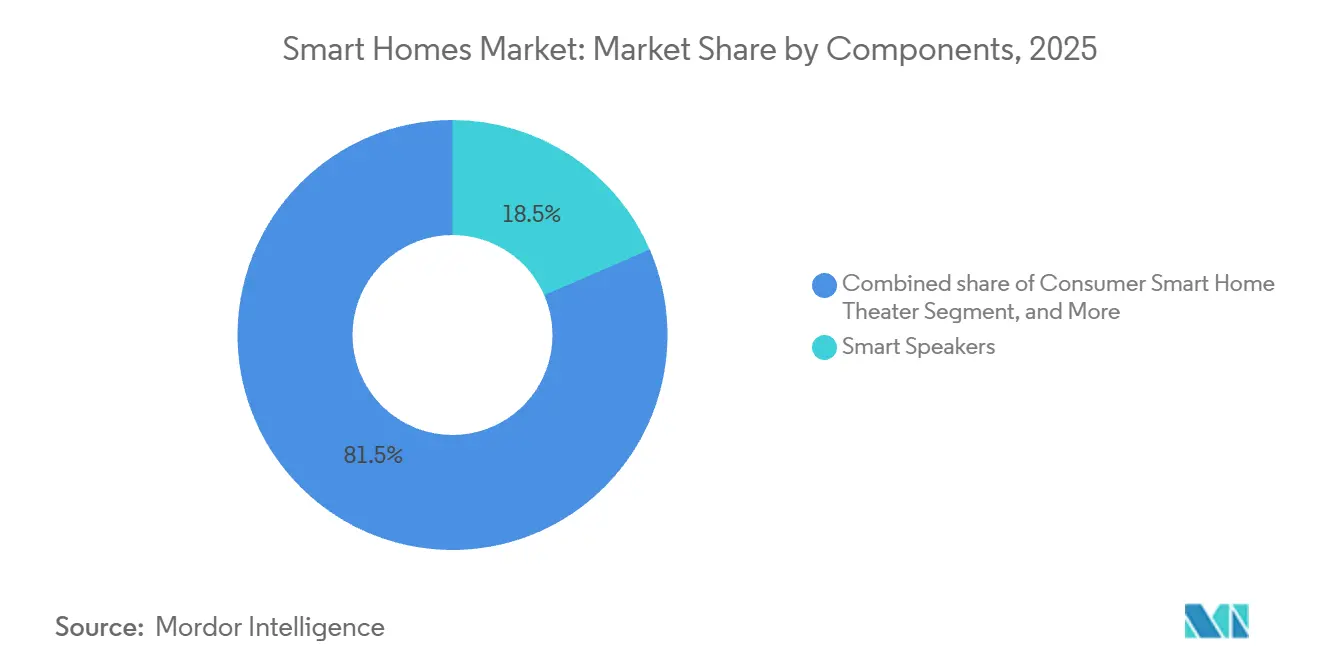
- By component, smart speakers led with 18.49% of the smart homes market share in 2025, while smart security cameras are forecast to expand at an 18.32% CAGR through 2031.
- By housing type, single-family dwellings accounted for 71.63% of the smart homes market size in 2025, whereas the multi-family segment is projected to advance at a 17.46% CAGR through 2031.
- By installation type, retrofit projects accounted for 64.36% of the smart homes market size in 2025 and are projected to grow at a 14.12% CAGR through 2031.
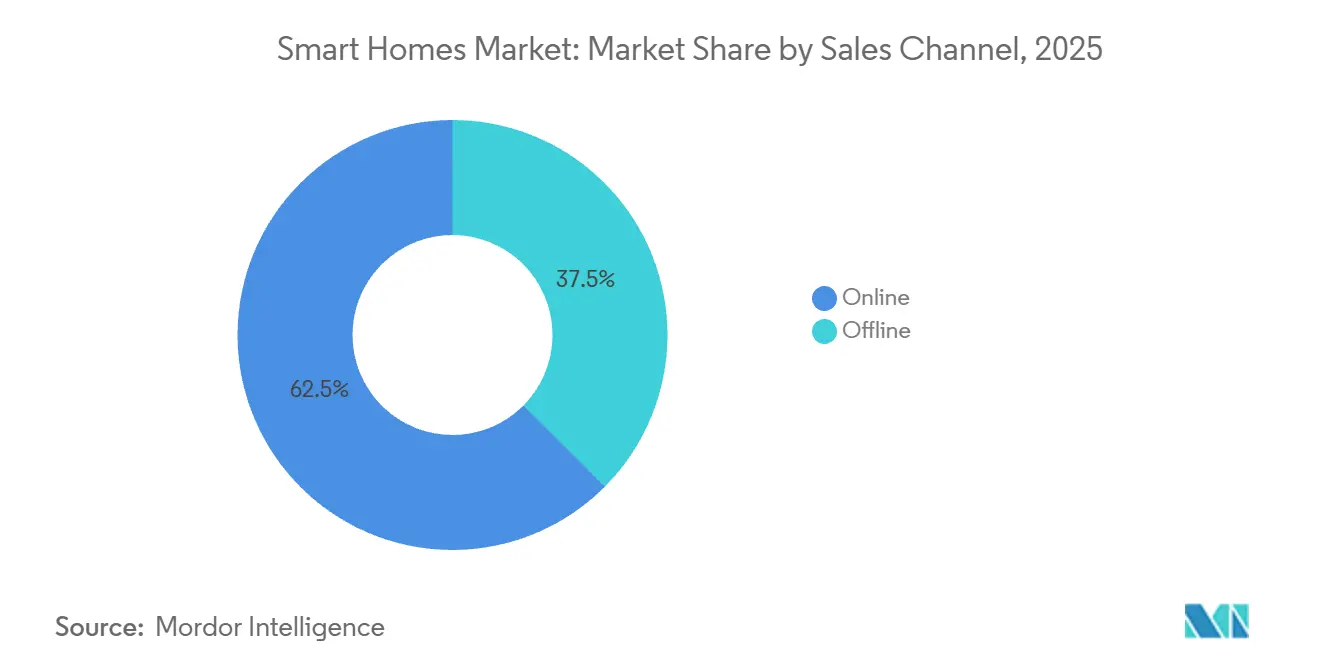
- By sales channel, online platforms captured a 62.52% revenue share in 2025 and are expected to grow at a 14.36% CAGR over the forecast period.
- By connectivity technology, Wi-Fi accounted for 60.12% of revenue in 2025, whereas Powerline and PLC are projected to advance at a 16.12% CAGR through 2031.
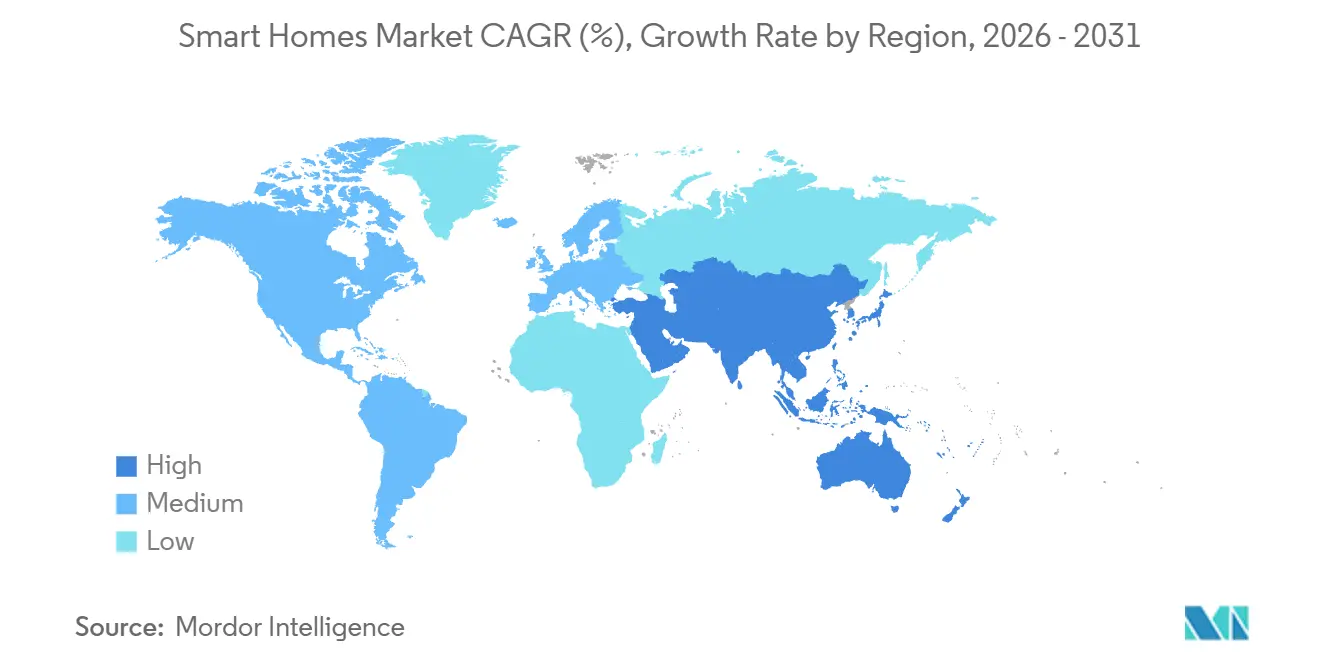
- By geography, North America retained a 36.23% share of the smart homes market in 2025, while Asia Pacific is the fastest-growing region at a 17.12% CAGR from 2026 to 2031.
Note: Market size and forecast figures in this report are generated using Mordor Intelligence’s proprietary estimation framework, updated with the latest available data and insights as of January 2026.
Market Trends and Insights
Drivers Impact Analysis of Smart Homes Market*
| Driver | (~) % Impact on CAGR Forecast | Geographic Relevance | Impact Timeline |
|---|---|---|---|
| Increasing Demand for Energy-Efficient Smart Appliances | +3.2% | Global, led by North America and Europe | Medium term (2-4 years) |
| Growing Broadband and 5G Penetration | +2.8% | Asia Pacific core, spill-over to Middle East and Africa | Short term (≤ 2 years) |
| Incentives for Residential Decarbonisation and Energy-Management | +2.5% | North America and Europe, expansion to Australia and New Zealand | Long term (≥ 4 years) |
| Interoperability Standard (Matter) Accelerating Ecosystem | +2.9% | Global, early gains in United States, Germany, United Kingdom | Short term (≤ 2 years) |
| Ageing-in-Place and Home-Health Integration Surge | +2.1% | North America, Europe, Japan | Medium term (2-4 years) |
| Gen-Z Home-Ownership Driving Automation Spend | +1.8% | North America, Western Europe, urban Asia Pacific | Medium term (2-4 years) |
| Source: Mordor Intelligence | |||
Increasing Demand for Energy-Efficient Smart Appliances
Residential electricity accounts for one-fifth of energy use in developed economies, and connected thermostats can save 10%–23% by learning occupancy patterns and syncing with demand-response signals.[1]U.S. Department of Energy, “Affordable Home Energy Shot,” Energy.gov The United States Affordable Home Energy Shot aims to achieve a 50% reduction in household energy costs by 2030, encouraging consumers to adopt connected HVAC controllers, adaptive lighting, and granular consumption dashboards. Shrinking payback periods now two to three years for most smart thermostats move the value proposition into the mainstream. California and Texas utilities subsidize installations to flatten peak loads, an approach that European grid operators plan to replicate as renewable penetration climbs. These aligned incentives between consumers and utilities help sustain momentum for adoption within the smart homes market.
Growing Broadband and 5G Penetration
Fixed broadband reached 44.6% of OECD households by the end of 2024, while 5G accounted for 33% of mobile subscriptions, providing a low-latency backbone essential for device orchestration. Fixed wireless access grew 17% year-over-year, extending high-speed links to suburbs and rural areas previously restricted to DSL. India’s BharatNet aims to connect 250,000 village clusters, creating bundled device opportunities and greenfield demand. Hybrid Wi-Fi-plus-5G architectures enable outdoor cameras and garage operators to continue functioning even when routers fail, reducing single-point outages and boosting consumer confidence. The net result is a larger, connected, and addressable base that sustains double-digit unit growth across the smart homes market.
Interoperability Standard (Matter) Accelerating Ecosystem
Apple, Google, Samsung, and Amazon aligned behind Matter in January 2025, erasing the need for multiple hubs and proprietary bridges. The Wi-Fi Alliance followed with its Wi-Fi for Matter certification in September 2025, ensuring routers prioritize smart-home packets during congestion. Thread, a low-power mesh protocol central to Matter, extends battery lifespans for sensors and locks to multiple years, thereby enhancing the customer experience while reducing maintenance costs. Manufacturers report 30%–40% cuts in firmware overhead because one code base now covers multiple ecosystems. Lower engineering expense and smoother user onboarding translate into faster replacement cycles, which in turn reinforce revenue velocity in the smart homes market.
Incentives for Residential Decarbonisation and Energy-Management
The United States Inflation Reduction Act extends 30% tax credits through 2032 for heat pumps, battery storage, and EV chargers, embedding smart energy controls inside broader decarbonization upgrades. Europe’s Renovation Wave funds deep retrofits, often coupled with demand-flexible equipment such as connected boilers and adaptive lighting. Grid operators in Germany and the United Kingdom award dynamic pricing rebates when smart appliances shift loads off-peak, aligning consumer ROI with broader climate objectives. Rebate stacking reduces net device costs by up to 35%, accelerating adoption among mid-income households. The virtuous loop between policy support and user savings is poised to keep the smart homes market on a high-growth trajectory through the decade.
Restraints Impact Analysis of Smart Homes Market*
| Restraint | (~) % Impact on CAGR Forecast | Geographic Relevance | Impact Timeline |
|---|---|---|---|
| High Upfront Installation and Retrofit Costs | -2.3% | Global, acute impact in emerging markets and lower-income segments | Medium term (2-4 years) |
| Cyber-Security and Data-Privacy Concerns | -1.9% | North America and Europe under heightened regulatory scrutiny | Short term (≤ 2 years) |
| Fragmented Device Ecosystems Hinder Adoption | -1.4% | Global, diminishing as Matter scales | Short term (≤ 2 years) |
| Semiconductor Supply-Chain Volatility | -1.1% | Global, lingering geopolitical tension | Medium term (2-4 years) |
| Source: Mordor Intelligence | |||
High Upfront Installation and Retrofit Costs
Full-home packages that cover lighting, HVAC, security, and energy management often top USD 5,000, a threshold that discourages many middle-income buyers. Older structures lacking neutral wires push electrician fees to USD 200–USD 400 per room, and multi-family landlords face split-incentive hurdles where tenants capture the energy savings. DIY kits priced between USD 200 and USD 500 lower the barrier, but they sacrifice deep integration and leave cybersecurity gaps. Until financing models, utility rebates, or green leases routinely offset the initial hit, this restraint will temper otherwise robust smart homes market momentum.
Cyber-Security and Data-Privacy Concerns
Rising consumer anxiety following high-profile exploits, such as the 2024 Ring doorbell breach, keeps 69%–71% of prospective buyers wary of smart devices. The GDPR imposes penalties up to 4% of global revenue for data breaches, adding compliance costs that average 10%–15% per unit for privacy-by-design architectures.[2]European Commission, “General Data Protection Regulation Framework,” Europa.eu California’s Consumer Privacy Act exerts similar pressure in the United States, and smaller vendors struggle to fund the requisite encryption, secure boot, and local processing features. Although on-device AI inference can mitigate risk, higher-performance chipsets add to the bill of materials expense. This security trust deficit remains a moderate drag on the smart homes market until certification frameworks mature and become ubiquitous.
*Our forecasts treat driver/restraint impacts as directional, not additive. The impact forecasts reflect baseline growth, mix effects, and variable interactions.
Smart Homes Market Segment Analysis
By Components:
Security Cameras Outpace Voice AssistantsSmart speakers accounted for 18.49% of the components segment in 2025, underscoring early saturation as entry-level devices slipped below USD 50. The segment’s growth slows further as users shift discretionary spend toward perimeter defense, wellness, and energy dashboards. In contrast, smart security cameras are forecast to expand at an 18.32% CAGR because AI-driven person detection, package alerts, and two-way audio convert passive recording into proactive monitoring. Insurance carriers now offer premiums 5%–10% lower for professionally monitored camera systems, directly linking hardware to the economic upside. Energy controllers and central hubs sustain premium pricing by serving as neural links that orchestrate fragmented devices across multiple protocols, and Matter support is accelerating hub replacement cycles across the smart homes market.
Voice hubs nonetheless remain critical to natural language control, and vendors are embedding higher-fidelity microphones and spatial audio to spark replacement demand. Lighting continues its shift from novelty color palettes to circadian tuning, which adjusts color temperature to enhance sleep hygiene. Smart HVAC and climate devices, ranging from USD 200 thermostats to USD 3,000 zoned controllers, anchor the high-value end of the catalog and align with utility rebates. Healthcare peripherals, such as glucose and cardiac monitors, carve out a regulatory moat that protects pricing and stabilizes margins. Overall, component diversity fuels resilient revenue streams and positions the smart homes market for multi-vector expansion.


By Housing Type:
Multi-Family Retrofit Gains MomentumSingle-family homes accounted for 71.63% of installations in 2025, thanks to homeowner autonomy and widespread access to thirty-year mortgages, which spread costs over long timeframes. Yet multi-family dwellings are set to grow at a 17.46% CAGR, propelled by landlords who bundle smart locks, thermostats, and lighting to lift rent and cut turnover. Property managers integrate access control with tenant screening, automating keyless entry and reducing re-keying expenses. Bulk procurement at portfolio scale trims per-unit costs by 20%–30%, making retrofit economics compelling even for mid-tier buildings. Meanwhile, condominium associations struggle with governance processes that slow capital approvals, although rising energy prices are tipping the balance in favor of smart upgrades.
As financing models evolve and green leases proliferate, the multi-family share of the smart homes market will expand steadily, though it is unlikely to displace single-family dominance within the forecast horizon.
By Installation Type:
Retrofit Dominates as New Construction SlowsRetrofit projects claimed a 64.36% share in 2025 and are expected to post a 14.12% CAGR, as the existing housing stock dwarfs new starts by roughly fifty-to-one in mature markets.
Thread-enabled battery sensors, solar-powered cameras, and magnetic mount fixtures are alleviating professional installation friction, thereby widening the addressable demand. Professional integrators still maintain a toehold for high-end whole-home packages, but the long-term trend strongly favors self-installed kits and staggered upgrades. This retrofit skew will help the smart homes market maintain velocity even if macroeconomic headwinds slow new construction.
By Sales Channel:
E-Commerce Captures DIY SurgeOnline platforms collected 62.52% of revenue in 2025 and are projected to expand at a 14.36% CAGR, buoyed by Amazon’s logistics prowess and vendor direct-to-consumer storefronts that bypass retail markups.
Omnichannel commerce is emerging as a differentiator: buyers research products online, view showroom demos, and schedule professional installs through a single portal. This cohesive path alleviates choice paralysis and compresses sales cycles, ultimately enhancing the customer experience. As 5G commerce apps and augmented-reality visualization showcase device placement and wiring routes, the smart homes market is likely to see its online share inch higher, although specialty integrators will remain indispensable for complex projects.
By Connectivity Technology:
Wi-Fi Dominates, Thread EmergesWi-Fi accounted for 60.12% of revenue in 2025 and powered over 60% of connected homes, thanks to ubiquitous routers and bandwidth capable of streaming multiple 2K or 4K camera feeds simultaneously. However, Zigbee and Z-Wave face displacement as Matter elevates Thread, a low-power mesh that mitigates radio congestion and extends sensor battery life. Apple’s HomePod Mini and Google’s Nest Hub Max now function as Thread border routers, establishing foundational mesh coverage without the need for dedicated gateways. Bluetooth Low Energy retains a niche for proximity-based locks and health wearables, where rapid pairing overrides range limitations.
Powerline and PLC are projected to expand at a 16.12% CAGR through 2031. Powerline communication remains a small but useful option in concrete or steel structures that attenuate radio waves.
Geography Analysis
North America Smart Homes Market
North America accounted for 36.23% of the 2025 revenue, supported by 95% household broadband coverage and aggressive utility demand-response programs that subsidize the adoption of smart thermostats. The Inflation Reduction Act’s 30% credits for heat pumps, EV chargers, and storage extend through 2032, embedding connected energy controls into mainstream renovation cycles. Canada mirrors this trajectory, with provincial schemes in Ontario and British Columbia targeting net-zero housing by 2050. Mexico trails due to lower broadband penetration, but crime-driven demand for security cameras in Mexico City and Monterrey is spurring niche adoption.
APAC Smart Homes Market
Asia Pacific is forecast to post a 17.12% CAGR, propelled by rapid urbanization and rising middle-class incomes in China and India. Domestic champions such as Xiaomi and Huawei deliver integrated ecosystems priced 30%–50% below Western alternatives, compressing adoption timelines. India’s BharatNet rollout extends fiber to 250,000 villages, pairing broadband subscriptions with bundled smart kits.[3]Government of India, “BharatNet National Broadband Mission,” Bharatnet.gov.in Japan’s aging demographics drive demand for medical alerts and fall detection, while South Korea’s 5G penetration supports 4K video doorbells. Australia and New Zealand leverage solar-plus-storage rebates to popularize energy dashboards, nudging regional smart homes market size higher.
EMEA Smart Homes Market
Europe’s trajectory hinges on GDPR compliance, which adds 10%–15% to unit cost but builds consumer trust. Germany leads smart HVAC adoption due to strict renovation codes, and the United Kingdom gains ground through smart meter mandates. Middle East adoption centers on the United Arab Emirates and Saudi Arabia, where state-led smart city projects cascade into residential deployments. African demand is concentrated in South Africa, Nigeria, and Kenya, where mobile-first connectivity leapfrogs fixed broadband limitations, and solar-powered devices offset grid instability. Collectively, these dynamics set a diversified yet promising runway for the global smart homes market.

Regulatory Landscape
Cybersecurity and privacy compliance is tightening for consumer IoT and smart-home devices across major markets, which raises baseline requirements for device makers and platform operators. In the United Kingdom, the Product Security and Telecommunications Infrastructure (PSTI) security requirements regime entered into force in April 2024, mandating minimum security provisions for relevant connectable products. In the European Union, Regulation (EU) 2024/2847 (Cyber Resilience Act) entered into force in December 2024, setting horizontal cybersecurity requirements for products with digital elements, including smart-home products such as smart locks and alarm systems.
Beyond statutory rules, standard-setting and labeling initiatives are also shaping go-to-market checklists for smart-home vendors. In the United States, the FCC advanced a voluntary IoT labeling program (Cyber Trust Mark) for wireless consumer IoT devices in 2024, linking procurement and retail readiness to recognizable security signals. On interoperability, the Connectivity Standards Alliance released Matter 1.6 and Product Security 1.1 in June 2026, reinforcing that ecosystem participation now couples cross-brand compatibility with formalized security certification coverage for devices, apps, and gateways.
Value Chain Analysis
The smart homes value chain begins with semiconductor and module suppliers (connectivity SoCs for Wi-Fi, Thread, BLE, and Zigbee), sensors, cameras, and power electronics. Device OEMs and appliance brands then integrate firmware, security features, and cloud connectivity into end-user products. Standards bodies and certification programs (Connectivity Standards Alliance for Matter, Thread Group for Thread) provide enabling infrastructure by reducing integration and testing friction, while aligning device behavior across ecosystems. Platform operators (Amazon, Google, Apple, and Samsung SmartThings) and the cloud service layer then supply identity, automation, storage, and remote access, enabling subscription monetization such as professional monitoring and video retention.
Distribution and delivery routes increasingly lean on online channels and direct-to-consumer fulfillment, supported by installer networks and property-management channels for multi-family deployments. The chain is also consolidating around Matter-over-Thread and multi-protocol hardware that bridges installed Zigbee bases with newer Matter networks, including Samsung SmartThings enabling direct Matter-over-Thread integration for third-party devices (April 2026) and Signify working with Silicon Labs to support concurrent multiprotocol operation for Philips Hue (June 2026). Real-estate and developer partnerships are adding another downstream link by bundling smart-home platforms into housing infrastructure, illustrated by LG integrating its ThinQ ON AI home hub with GS E&C's Xi apartment platform (July 2026).
Competitive Landscape
The smart homes market remains moderately fragmented, with the top ten firms controlling roughly 45–50% of the revenue, leaving ample room for niche specialists. Amazon and Google deploy loss-leader hardware to funnel users into cloud services, yet shrinking margins spur a pivot toward subscription bundles and advertising within device interfaces. Industrial stalwarts such as Schneider Electric, Siemens, and Honeywell leverage their legacy HVAC and energy management expertise but struggle to match the simplicity of consumer-grade UIs. Apple positions HomeKit as a privacy-centric ecosystem with on-device processing, capturing a premium segment that values data sovereignty.
Matter certification lowered engineering barriers by 30-40%, resulting in more than 500 certified products from 200 manufacturers by late 2025. This wave erodes proprietary moat advantages and intensifies price competition. Cybersecurity emerges as a differentiator: Arlo and ADT emphasize professional monitoring and insurance partnerships to mitigate liability, while IEEE works on voluntary IoT security labels.[4]Institute of Electrical and Electronics Engineers, “IoT Security Certification Development,” Ieee.org White-space opportunities in remote patient monitoring attract Philips and Omron, whose regulatory experience creates defensible niches. Semiconductor improvements, coupled with cloud development kits, further reduce entry costs, ensuring a dynamic competitive arena.
Strategic moves illustrate an arms race for ecosystem stickiness. Amazon’s Ring Battery Doorbell Pro 2 launched with Matter support and 3D motion radar; Google invested USD 150 million to expand Nest capacity; Samsung partnered with ADT to bundle SmartThings with professional monitoring. Schneider Electric’s acquisition of Sense Energy adds appliance-level analytics, and Honeywell’s T10 Pro thermostat merges air-quality sensors with demand-response enrollment. Each action reinforces platform lock-in, accelerates subscription revenue, and reshapes value propositions across the smart homes market.
Smart Homes Industry Leaders
ABB Ltd
Schneider Electric SE
Honeywell International Inc.
Emerson Electric Co.
Siemens AG
- *Disclaimer: Major Players sorted in no particular order
Smart Homes Market Companies Covered in this Report
- ABB Ltd
- Schneider Electric SE
- Honeywell International Inc.
- Emerson Electric Co.
- Siemens AG
- LG Electronics Inc.
- Cisco Systems Inc.
- Google LLC
- Microsoft Corporation
- General Electric Company
- IBM Corporation
- Legrand SA
- Lutron Electronics Co. Inc.
- Samsung Electronics Co., Ltd.
- Control4 Corporation
- Assa Abloy AB
- Amazon.com, Inc.
- Apple Inc.
- Bosch Smart Home GmbH
- Sony Group Corporation
- Faststream Technologies
- SimpliSafe Inc.
- Ecobee Inc.
- Signify N.V.
- ADT Inc.
- Arlo Technologies, Inc.
- Vivint Smart Home, Inc.
- Ring LLC

Market Opportunities and Future Outlook
Interoperability and multi-ecosystem management remain a key whitespace where vendors can reduce setup friction and expand addressable demand beyond single-platform households. The Connectivity Standards Alliance release of Matter 1.6 in June 2026 added Joint Fabric for cross-ecosystem device management and NFC-based commissioning. For device makers, this creates a clearer path to sell one SKU across multiple major ecosystems while simplifying onboarding, with downstream benefits for retrofit-heavy adoption where reducing hub requirements lowers installation complexity for DIY buyers and e-commerce-led conversions.
Energy-management adjacencies are also widening as policy and technical programs expand what counts as a smart, controllable home energy system. In March 2026, the European Commission Joint Research Centre expanded its Code of Conduct for energy smart appliances to include photovoltaic inverters, batteries, and EV home chargers, aligning smart-home energy dashboards with behind-the-meter assets rather than only appliances. Separately, supply-chain investments around power electronics are feeding smart-home energy roadmaps, including Bosch commencing sample production of silicon carbide semiconductors at its Roseville, California facility in July 2026, supported by U.S. Department of Commerce CHIPS Act funding, which links component availability to residential electrification use cases (storage, inverters, and charging controls).
Recent Industry Developments in Smart Homes Market
- July 2026: Schneider Electric announced the acquisition of industrial AI platform Cognite for USD 3.1 billion, with plans to integrate it into the AVEVA platform. The acquisition strengthens Schneider Electric's software and data layer that can be applied to energy optimization and connected-building workflows, reinforcing the shift toward analytics-driven energy management across homes and buildings.
- March 2025: ABB finalized the acquisition of Siemens' Wiring Accessories business in China, expanding its access to local distribution across 230 cities and adding wiring and smart-home related products to its portfolio. The deal deepens ABB's channel reach in a high-growth smart-home region while improving its ability to bundle residential electrification and automation hardware.
- September 2024: Schneider Electric launched Schneider Home in the United States as an integrated home energy management system spanning hardware and software components for household energy control. This broadened Schneider Electric's position in residential energy management, linking smart-home controls with storage, solar, and EV charging-oriented home electrification upgrades.


Smart Homes Market Report Scope and Research Methodology
Market Definition and Coverage
For this methodology, the smart homes market is the value of connected devices and enabling software and services used inside residential dwellings to monitor, automate, and remotely control home functions through a digital interface.
Scope exclusions: We exclude commercial building automation, stand-alone smart meters procured through utility tenders, and pure professional installation labor charges.
Segments Covered in This Report
- By Components
- Consumer Electronics
- Smart Speaker
- Smart Home Theater
- Smart Purifier
- Other Consumer Electronics
- Access Control, Safety and Security
- Smart Alarm
- Smart Locks
- Smart Sensors
- Smoke/Hazard Detectors
- Smart Cameras and Monitoring
- Garage-Door Operators and Rest of Access Control, Safety and Security
- Lighting
- Smart Lighting
- Smart Lamps and Luminaires
- Ambient Lighting
- Other Lighting Products
- Energy Management
- Lighting Energy Controllers
- Central Control Systems
- HVAC Energy Controls
- Smart HVAC / Climate Control
- Fans
- Radiators
- Thermostats
- Air-Conditioners
- Controllers / Hubs
- DIY Hubs and Panels
- Professional Hubs and Panels
- Smart-Home Healthcare
- Medical-Alert Systems
- Smart Glucose Monitors
- Smart Cardiac Monitors
- Smart Kitchen
- Smart Refrigerators
- Smart Cookware and Cooktops
- Smart Dishwashers
- Smart Ovens
- Other Smart Kitchen Products
- Consumer Electronics
- By Housing Type
- Single-Family
- Multi-Family
- By Installation Type
- New Construction
- Retrofit
- By Sales Channel
- Online
- Offline
- By Connectivity Technology
- Wi-Fi
- Zigbee and Z-Wave
- Bluetooth/BLE
- Thread
- Powerline and PLC
- Rest of Connectivity Technology
- By Geography
- North America
- United States
- Canada
- Mexico
- South America
- Brazil
- Argentina
- Rest of South America
- Europe
- Germany
- United Kingdom
- France
- Italy
- Spain
- Russia
- Rest of Europe
- Asia Pacific
- China
- Japan
- South Korea
- India
- Australia
- New Zealand
- Rest of Asia Pacific
- Middle East
- United Arab Emirates
- Saudi Arabia
- Turkey
- Rest of Middle East
- Africa
- South Africa
- Nigeria
- Kenya
- Rest of Africa
- North America
Data Sources, Market Sizing, and Validation
Desk Research
Desk work starts by mapping the demand pool and the categories that typically ship into a smart home, and then it is narrowed to residential-only usage. Public and official sources are used to anchor the model, such as national statistics offices for household counts and housing starts, customs and trade statistics for electronics flows, telecom regulators for broadband coverage, and energy agencies for residential consumption patterns.
We also review product and standard-setting documentation (for example, interoperability standards), peer-reviewed journals covering connected-home adoption, and association publications that track consumer electronics trends. These inputs are cross-checked with company filings, earnings call transcripts, investor presentations, and trusted news coverage to understand pricing movement, feature bundling, and regional adoption timing. In cases where public data is thin, paid subscriptions that support company financials and intelligence, news and financials, patent databases, and shipment-level import and export tracking are used to validate directionally what the desk data suggests. The sources listed here are illustrative only, and many other public and paid references are also used for data collection, validation, and clarification.
Primary Interviews and Surveys
Primary work is used to confirm what is actually counted as smart home revenue and what stays outside scope, especially when devices are bundled with apps, hubs, or recurring services. We spoke with a mix of device suppliers, platform and software participants, channel partners, and industry experts across major regions. This input helped refine assumptions like household attach rates, typical upgrade cycles, and average selling price (ASP) ranges to better reflect buying behavior.
Distribution of primary research fieldwork respondents
| Company type | Respondent position | Region |
|---|---|---|
| Top tier: 29% | CXOs: 14% | APAC: 42% |
| Mid tier: 53% | Functional/Unit leaders: 34% | EMEA: 35% |
| Smaller Players: 18% | Managers: 52% | Americas: 23% |
Market-Sizing & Forecasting
Sizing is built using both top-down and bottom-up logic so the numbers stay realistic even when a single input changes. On the top-down side, the demand pool is reconstructed by region using household counts, broadband penetration, and adoption of connected home categories, and then it is translated into value using category-level unit volumes and ASP bands.
To keep the model market-specific, a few inputs are tracked carefully, including smart home device penetration by household, replacement and upgrade cycles, mix shifts between security, comfort and lighting, energy management, entertainment, and smart appliances, and the changing share of recurring subscriptions attached to devices. Currency conversion timing is handled consistently because the market is global and local pricing changes do not land evenly across regions.
For corroboration, selective bottom-up approximations are run using sampled supplier revenue disclosures, channel checks on category pricing, and volume indicators from trade flows where relevant, and then gaps are handled through conservative interpolation when a category or country does not disclose clean splits. Forecasting is driven mainly through scenario analysis that ties adoption and ASP trajectories to expert inputs on consumer spending conditions, connectivity rollouts, and standardization progress, followed by a final reasonableness check against the historical growth path.
Data Validation & Update Cycle
Outputs are tested through multiple checks so unusual spikes or drops are explained before sign-off. We compare the model against independent signals like household adoption indicators, shipment or trade direction, and disclosed revenue trends, and then variances are reworked back to the assumption level.
A second analyst review is performed to verify scope boundaries, unit economics logic, and currency conversions, after which follow-up calls are triggered if a key input still looks off. Reports are refreshed annually, and material events such as major pricing shifts or regulatory changes can lead to interim updates. Before delivery, the latest pass is completed so the final numbers reflect the most current data available at that point.
Mordor Intelligence's Global Smart Homes Market Market Size Compared Against Other Published Estimates
Published smart home market values can differ even when the topic sounds the same, since each publisher makes its own choices on what to count and when to update assumptions. Differences usually come from scope boundaries, pricing logic for devices versus subscriptions, and the way exchange rates are applied for a global roll-up.
A common gap driver in this market is the refresh cadence for ASPs and the currency timing used when local prices are converted into USD, which can move totals meaningfully during volatile periods. These checks are emphasized in the latest model update applied by Mordor Intelligence.
Benchmark comparison
| Source | Market Size | Gaps in Research Methodology |
|---|---|---|
| Mordor Intelligence | USD 140.42 B (2025) | |
| Industry Research Publisher A | USD 147.52 B (2025) | Often uses a broader inclusion of smart home solutions and may apply more aggressive adoption and bundle-value assumptions, which can lift the 2025 total versus a residential-only device-plus-enabling-services view. |
| Research Publisher B | USD 151.50 B (2025) | May include adjacent services across security, healthcare, and entertainment in ways that are not consistently tied back to device-installed bases, and may rely on slower-moving price bands that do not reflect recent ASP declines in some categories. |
Taken together, the spread is mostly explained by how adjacent services are counted and how quickly pricing and currency inputs are refreshed. By keeping the scope residential and by re-validating key ASP ranges and conversion timing through repeated checks, the final figure stays traceable to clear demand indicators and repeatable steps.


Key Questions Answered in the Report
What was the global smart homes market size in 2026?
The market reached USD 164.13 billion in 2026 and is projected to more than double to USD 311.22 billion by 2031.
Which component segment is forecast to grow the fastest?
Smart security cameras are expected to register an 18.32% CAGR through 2031 as AI detection features turn passive video into interactive security.
How much of the smart homes market size did online channels account for in 2025?
E-commerce platforms captured 62.52% of sales in 2025, reflecting strong DIY demand and direct-to-consumer strategies.
Which region is projected to lead growth to 2031?
Asia Pacific is poised for the fastest expansion at a 17.12% CAGR, driven by urbanization in China and India and cost-effective domestic brands.
What is Matter and why does it matter for adoption?
Matter is a cross-brand interoperability standard backed by Apple, Google, Samsung, and Amazon; it removes proprietary barriers, lowers engineering cost, and simplifies consumer onboarding, thereby accelerating installation rates.
What financing incentives support smart energy devices in the United States?
The Inflation Reduction Act extends 30% tax credits through 2032 for connected heat pumps, battery storage, and EV chargers, reducing net purchase costs and encouraging adoption.
Page last updated on:


