Smart Home Appliances Market Size and Share
Market Overview
| Study Period | 2020 - 2031 |
|---|---|
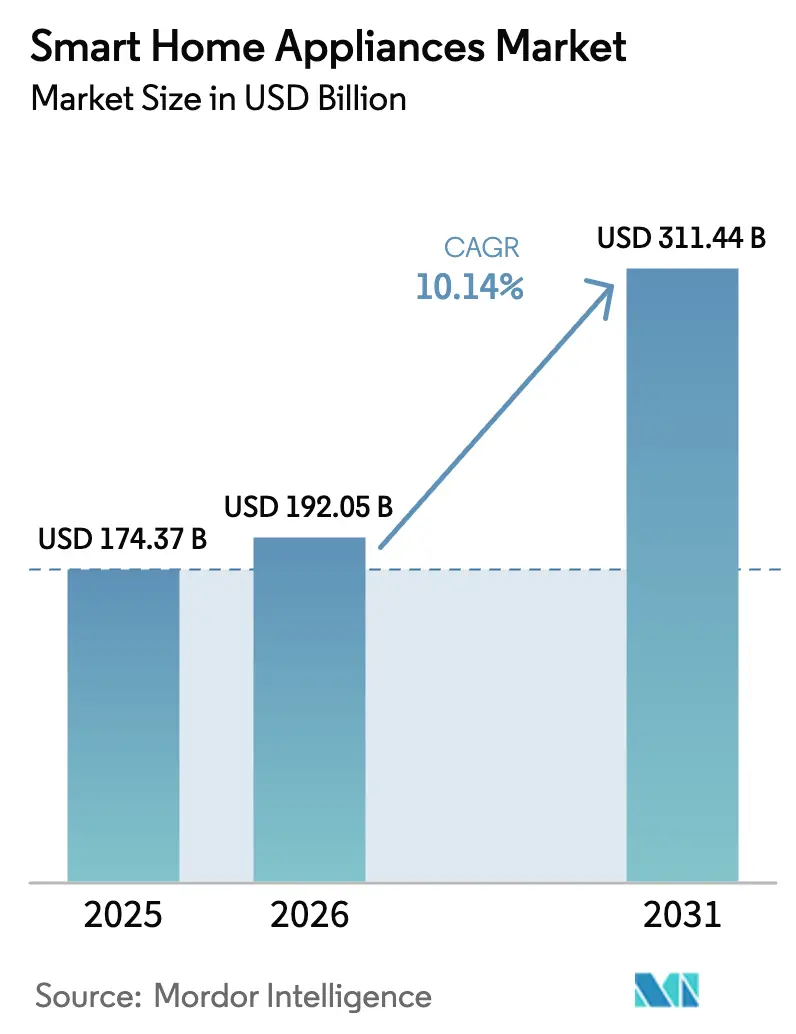
| Market Size (2026) | USD 192.05 Billion |
| Market Size (2031) | USD 311.44 Billion |
| Growth Rate (2026 - 2031) | 10.14% CAGR |
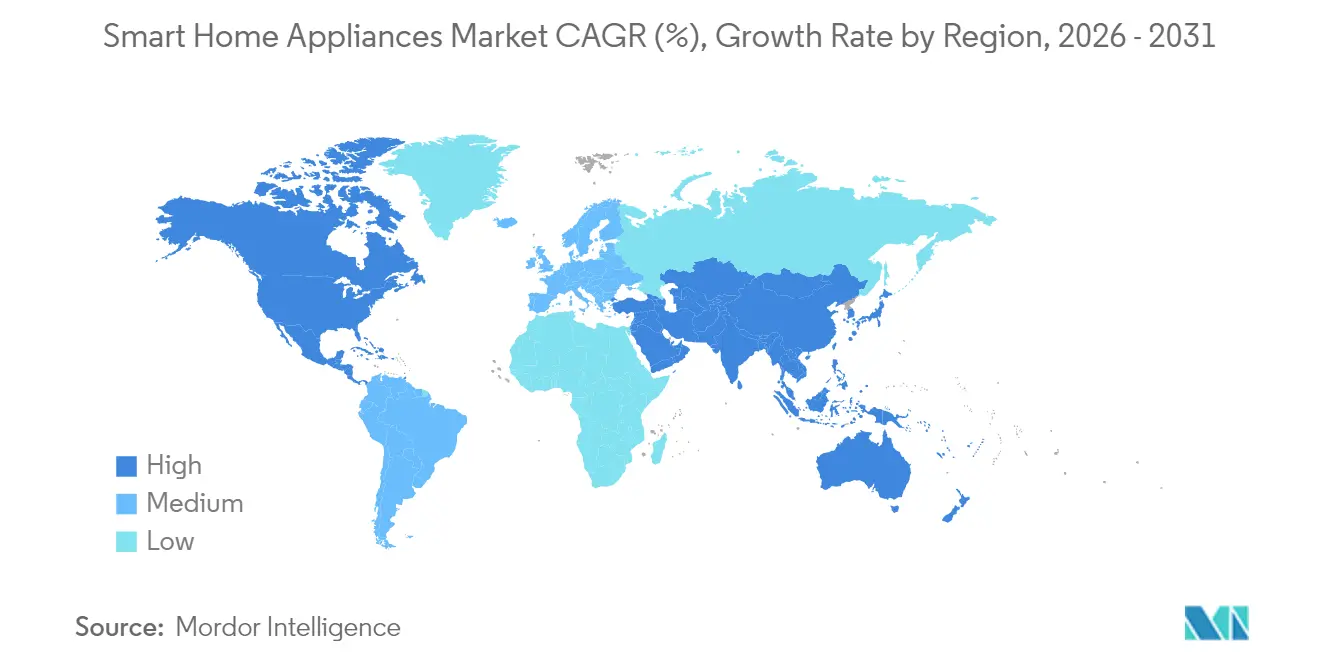
| Fastest Growing Market | Asia Pacific |
| Largest Market | North America |
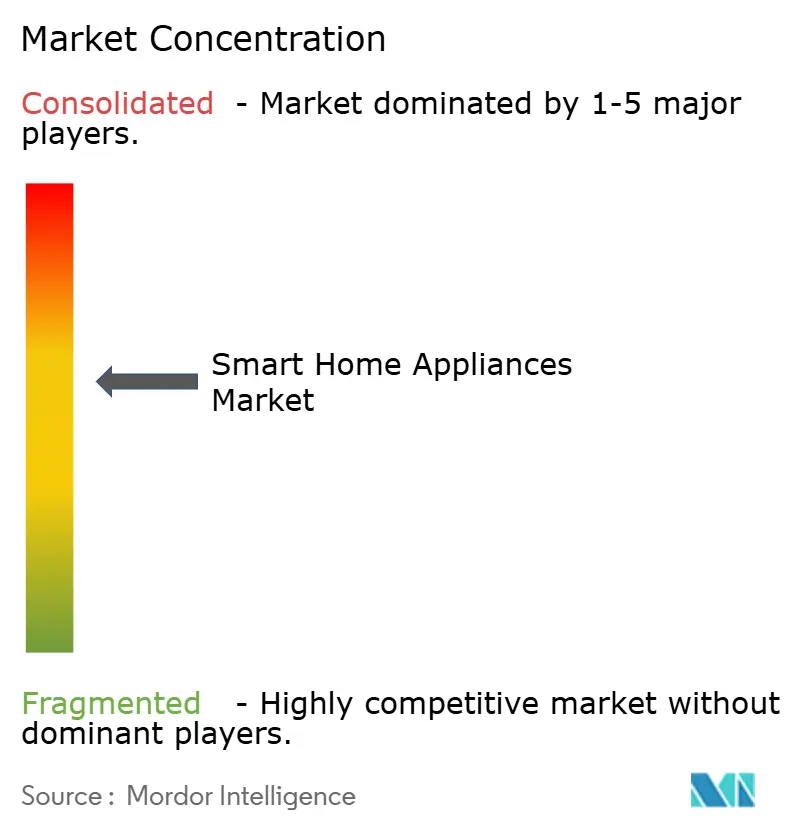
| Market Concentration | Medium |
Major Players *Disclaimer: Major Players sorted in no particular order Image © Mordor Intelligence. Reuse requires attribution under CC BY 4.0. | |
Smart Home Appliances Market Analysis by Mordor Intelligence
The Smart Home Appliances Market size is projected to be USD 174.37 billion in 2025, USD 192.05 billion in 2026, and reach USD 311.44 billion by 2031, growing at a CAGR of 10.14% from 2026 to 2031.
Heightened consumer interest in energy-saving devices, utility-driven time-of-use tariffs, and more affordable connectivity chips all reinforce momentum. Rapid IoT maturation allows manufacturers to bundle AI-powered functions that extend product lifespans, while semiconductor supply stabilization after the 2022-2023 shortage is letting factories clear backlogs and release new SKUs. Utilities in North America and Europe now remunerate households that automate load shifting, turning connected washers, dryers, and water heaters into income-generating assets. At the same time, growing privacy regulations are prompting appliance brands to differentiate on cybersecurity credentials, which further elevates hardware refresh rates as older, non-compliant models are phased out.
Key Report Takeaways
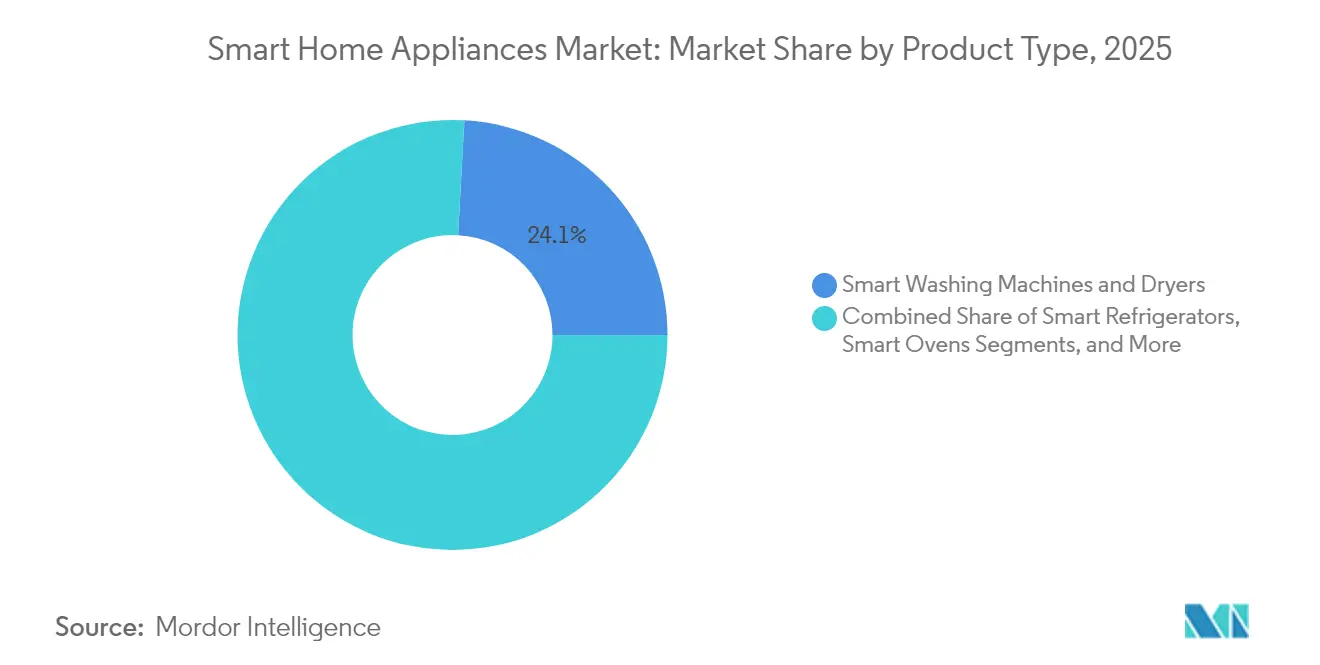
- By product type, smart washing machines and dryers led with 24.12% of the smart home appliances market share in 2025, while smart cookware and cooktops are forecast to expand at a 12.74% CAGR through 2031.
- By connectivity technology, Wi-Fi captured 57.93% revenue share in 2025; Thread is advancing at a 12.94% CAGR through 2031.
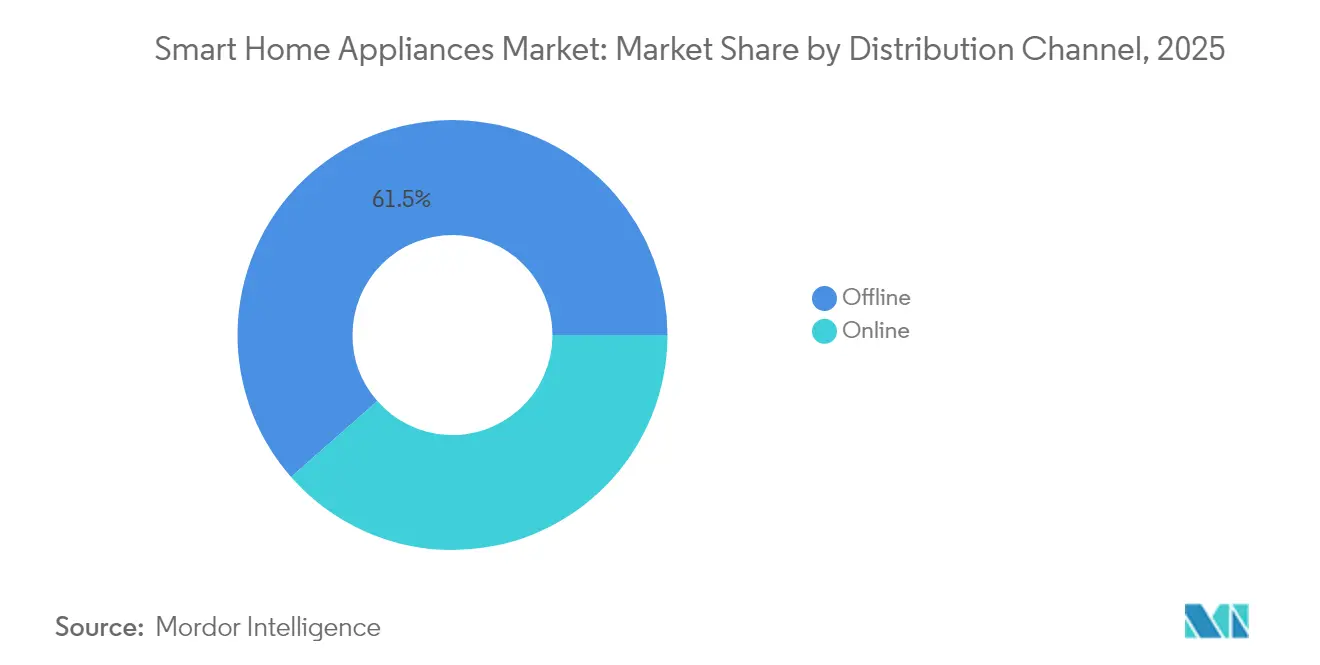
- By distribution channel, offline outlets accounted for 61.48% of the smart home appliances market size in 2025, whereas online sales are projected to grow at an 11.73% CAGR through 2031.
- By end-user industry, residential applications represented 66.02% of 2025 revenue, and commercial usage is rising at an 11.32% CAGR to 2031.
- By geography, North America led with 32.41% of the smart home appliances market share in 2025, while the Asia Pacific is forecast to expand at a 11.12% CAGR through 2031.
Note: Market size and forecast figures in this report are generated using Mordor Intelligence’s proprietary estimation framework, updated with the latest available data and insights as of 2026.
Global Smart Home Appliances Market Trends and Insights
Drivers Impact Analysis*
| Driver | (~) % Impact on CAGR Forecast | Geographic Relevance | Impact Timeline |
|---|---|---|---|
| Rising disposable income and consumer awareness | +1.8% | Global; strongest in APAC and Latin America | Medium term (2-4 years) |
| Rapid adoption of IoT and voice-assistant ecosystems | +2.3% | North America and EU lead; APAC close follower | Short term (≤ 2 years) |
| Energy-efficiency regulations and incentive programs | +2.1% | EU and North America primary; APAC expanding | Long term (≥ 4 years) |
| Growth of e-commerce home-appliance sales | +1.4% | Global; urban market focus | Short term (≤ 2 years) |
| OEM bundling of AI-based predictive-maintenance services | +1.2% | North America and EU early; APAC emerging | Medium term (2-4 years) |
| Utilities’ time-of-use tariffs driving smart load-shifting appliances | +1.9% | North America lead; EU expanding; APAC pilots | Medium term (2-4 years) |
| Source: Mordor Intelligence | |||
Rapid Adoption of IoT and Voice-Assistant Ecosystems
Samsung’s SmartThings platform logged 2.5 billion device interactions during 2024, while Amazon Alexa now supports 140,000 smart devices across 400 brands [1]Samsung Electronics, “Samsung Electronics Announces Q3 2024 Results,” samsung.com. This critical mass removes the learning-curve barrier that long deterred older homeowners. Appliance makers are embedding Thread 1.4 radios so products can self-organize into secure mesh networks that maintain service even if the household Wi-Fi router fails [2]Thread Group, “Thread 1.4 Specification Released,” threadgroup.org. Integration also yields compound use-cases like dryers coordinate with rooftop solar output, or refrigerators vary compressor speed in line with occupancy patterns collected by home security sensors. The result is an ecosystem in which connected appliances deliver measurable electricity savings without constant user input, broadening the smart home appliances market to previously hesitant demographics.
Energy-Efficiency Regulations and Incentive Programs
Mandatory efficiency labels are morphing into connectivity mandates. The EU’s 2025 energy-labeling update requires that A-rated refrigerators and washers include smart-grid interfaces. California’s Title 24 building code similarly obliges new homes to install demand-response-ready appliances. Complementary rebates amplify pull-through demand. For instance, ComEd pays USD 50-200 per unit for qualified devices enrolled in its Peak-Time Savings program. These carrots and sticks mean manufacturers that cannot demonstrate secure two-way communication risk losing shelf space at big-box retailers. Such policies move the smart home appliances market beyond voluntary adoption toward regulatory compliance, elongating replacement cycles as buyers trade up to maintain resale value.
Growth of E-Commerce Home-Appliance Sales
Online channels grew 23% year-over-year in 2024, buoyed by VR showrooms and flat-rate white-glove deliveries that de-risk bulky purchases. Amazon’s tie-up with Sears now offers nationwide installation, transforming what was once an in-store advantage into a digital service. Manufacturers respond with augmented-reality apps that let shoppers preview a smart range in their actual kitchen before checkout. Because product pages can explain connectivity specs better than over-extended in-store staff, web channels are capturing a disproportionate share of the incremental spend on AI-enabled models. The result is a virtuous cycle in which online analytics inform SKU design, enhancing speed-to-market and reinforcing digital migration within the smart home appliances market.
Utilities’ Time-of-Use Tariffs Driving Smart Load-Shifting Appliances
Dynamic tariffs are turning connectivity into a bankable asset rather than a lifestyle perk. Duquesne Light customers who enrolled in connected washers and water heaters in real-time pricing cut bills by 15-20% in 2024 [3]Duquesne Light, “Time-of-Use Rates,” duquesnelight.com. Pacific Gas and Electric’s USD 0.47 per kWh peak-versus-off-peak spread means a smart dishwasher pays for itself in 18 months, accelerating payback rationales. Appliance OEMs now preload rate tables and machine-learning algorithms that autonomously schedule cycles. These capabilities resonate with grid operators facing renewable intermittency, ensuring a policy environment that continues to reward automated load flexibility and sustaining growth in the smart home appliances market.
Restraints Impact Analysis*
| Restraint | (~) % Impact on CAGR Forecast | Geographic Relevance | Impact Timeline |
|---|---|---|---|
| High upfront cost and long replacement cycles | -1.6% | Global; stronger in price-sensitive regions | Long term (≥ 4 years) |
| Data-privacy and cybersecurity concerns | -1.3% | EU and North America | Short term (≤ 2 years) |
| Fragmented connectivity standards limiting interoperability | -0.9% | Global; regional variations | Medium term (2-4 years) |
| Supply-chain volatility for semiconductor components | -1.1% | Global; APAC manufacturing concentration | Short term (≤ 2 years) |
| Source: Mordor Intelligence | |||
Data-Privacy and Cybersecurity Concerns
The 2024 Wyze camera breach, which exposed 13,000 video feeds, placed privacy squarely on mainstream news cycles and curbed intent-to-buy scores for connected devices. New rules under the EU Cyber Resilience Act compel vendors to provide security patches for a product’s entire service life, raising lifetime support costs. Similar proposals in the United States would require factory-installed unique passwords and public vulnerability disclosures. Consumers interpreting headlines equate any internet-connected appliance with risk, raising the bar for transparent data-use policies. Brands must now allocate budget for encryption hardware and third-party penetration testing, which marginally inflates retail pricing and slows adoption in the smart home appliances market.
Supply-Chain Volatility for Semiconductor Components
Although the acute chip shortage of 2023 has eased, aged-node microcontrollers remain vulnerable to price spikes, forcing appliance OEMs to carry excess inventory or redesign boards on the fly. Automotive companies have long-term capacity agreements, leaving appliance suppliers to secure older-generation plants in China and Malaysia that can still meet performance and cost targets. The added procurement complexity leads some brands to reserve premium AI features for high-margin flagships while releasing stripped-down SKUs at the entry level. Such bifurcation may constrain the total addressable base for fully featured products, tempering the overall smart home appliances market trajectory through the medium term.
*Our forecasts treat driver/restraint impacts as directional, not additive. The impact forecasts reflect baseline growth, mix effects, and variable interactions.
Segment Analysis
By Product Type: AI Integration Transforms Traditional Categories
Smart washing machines and dryers commanded 24.12% of the smart home appliances market share in 2025, a leadership driven by short replacement cycles and rebate-boosted ROI calculations. High-spin motors and sensor-based detergent dosing save water and electricity, validating purchase decisions for cost-conscious families. Conversational voice controls and mobile push alerts further reduce user effort, lifting customer-satisfaction scores. Smart refrigerators leverage their always-powered status to anchor digital dashboards, becoming central hubs for grocery management and home-energy analytics. Ovens are iterating toward camera-enabled bake detection and auto-shutoff logic that cuts food waste and electricity bills.
Smart cookware and cooktops, while starting from a smaller base, are projected to grow at a 12.74% CAGR through 2031, the fastest among product categories. AI-linked recipe libraries and precision induction zones cater to time-starved professionals seeking guaranteed results. Autonomous vacuum cleaners and air conditioners capitalize on labor-saving appeal and comfort optimization, respectively, thereby recruiting first-time smart appliance buyers. Dishwashers and kitchen scales add incremental connectivity that extends ecosystem stickiness without inflating prices excessively. Overall, appliances that incorporate hands-free autonomy or measurable cost savings continue to outpace features that merely replicate manual controls, reinforcing hierarchy within the smart home appliances market.


By Connectivity Technology: Thread Protocol Disrupts Wi-Fi Dominance
Wi-Fi accounted for 57.93% of 2025 revenue owing to near-universal router penetration and user familiarity. Yet Thread devices are forecast to expand at a 12.94% CAGR as Matter certification gains prominence. Thread-enabled appliances form self-healing IPv6 meshes that sustain low-latency performance even when single nodes drop offline, satisfying the stringent reliability needs of ovens or HVAC systems. This evolution diminishes proprietary hubs, lowering total system cost for homeowners. Bluetooth retains a foothold for personal-health products like smart scales, where occasional phone sync suffices. Zigbee and Z-Wave continue serving security-plus-lighting bundles sold through professional installers.
Vendors now view open, certificate-based provisioning as a safeguard against future cybersecurity mandates. Accordingly, engineering roadmaps prioritize Thread radios, sometimes in dual-band packages that support Wi-Fi 6 for over-the-air firmware updates while defaulting to Thread for day-to-day telemetry. Such architectural shifts position Thread as the baseline for the next hardware replacement wave, further standardizing the smart home appliances market around interoperable protocols.
By Distribution Channel: Digital Transformation Accelerates Despite Physical Preference
Offline retailers still captured 61.48% of the smart home appliances market size in 2025 because consumers want to touch stainless-steel finishes, gauge noise levels, and negotiate installation packages face-to-face. Big-box chains responded by installing live demo kitchens and smart-power kiosks that visualize potential utility savings. In parallel, online/e-commerce grew at an 11.73% CAGR, propelled by improved last-mile logistics, AI-chat product advisors, and interest-free financing that mirrors brick-and-mortar offers. Virtual showrooms built with WebXR tech allow shoppers to “walk” around appliances in a life-size scale, narrowing experiential gaps between channels.
Manufacturers increasingly orchestrate omnichannel journeys, such as a QR code on an in-store unit that opens interactive setup demos or triggers an online coupon usable for same-day curbside pickup. These blended paths increase close rates and capture first-party data that feeds product-improvement loops. As Gen Z consumers reach household-formation age, their default preference for online research and checkout will tilt revenue steadily toward digital, making channel agility a core competency for brands vying for smart home appliances market leadership.
By End-User Industry: Commercial Adoption Accelerates Through Sustainability Mandates
Residential customers held 66.02% of 2025 revenue as homeowners pursued comfort and cost-saving gains. Utility rebates and mortgage-linked efficiency incentives subsidize premium SKUs, shrinking payback periods. DIY-friendly apps simplify onboarding, while cross-device automations let refrigerators alert ovens about recipe schedules, reinforcing platform lock-in.
Commercial premises, hotels, restaurants, and corporate campuses will, however, post an 11.32% CAGR to 2031, outpacing households. Hotels adopt connected PTAC units and smart mini-bars to monitor occupancy and optimize energy usage without compromising guest comfort. Quick-service restaurants deploy AI cooktops that guarantee consistent results and auto-generate HACCP compliance logs. For facility managers tasked with net-zero targets, connected appliances deliver granular energy data that feeds ESG reporting dashboards. Consequently, vendors are releasing industrial-grade variants of consumer flagships, broadening the total smart home appliances market addressable base.
Geography Analysis
North America led with 32.41% revenue share in 2025, anchored by mature rebate infrastructures and high disposable income. ComEd’s Peak-Time Savings and PG&E’s Critical-Peak Pricing reward connected load shifting, ensuring tangible financial returns. Federal efficiency standards now incorporate connected-ready provisions, effectively making smart features table stakes for new models. Canada’s federal carbon price credits further nudge consumers toward AI-managed machines, while Mexico’s rising middle class is fueling demand in urban centers despite patchy rural broadband coverage.
Asia Pacific is projected to compound at an 11.12% CAGR through 2031, making it the fastest-growing region. China shipped 4.48 billion appliances in 2024, up 20.8% year-on-year, and domestic giants Midea and Haier are using scale advantages to undercut Western peers abroad. South Korea and Japan, already boasting fiber penetration rates above 97%, are early adopters of premium AI fridge-to-car charging synchronization. India’s smart-city initiatives include subsidies for grid-interactive devices, smoothing price sensitivities. Southeast Asia’s booming e-commerce platforms are bypassing retail infrastructure gaps, accelerating device availability even in secondary cities.
Europe maintains a steady trajectory as stringent regulations shift from efficiency to cybersecurity. The updated energy label requires smart-grid interfaces by 2025, while the Cyber Resilience Act mandates lifetime patch delivery. Germany and the UK leverage ample rooftop solar to encourage appliances that modulate consumption based on intra-day prices. Nordic countries, with abundant hydro and wind resources, encourage load-shifting washers and dryers that flatten demand curves during winter peaks. In the Middle East and Africa, adoption remains concentrated in wealthier Gulf Cooperation Council states, but new fiber corridors and urban megaprojects are creating beachheads for future expansion, gradually enlarging the global smart home appliances market.

Competitive Landscape
The market features moderate concentration. Samsung and LG differentiate via vertically integrated ecosystems, Bespoke AI, and ThinQ UP, which enable over-the-air feature unlocks and subscription maintenance plans, reinforcing customer lifetime value. Whirlpool and Electrolux are partnering with cloud providers to close software gaps while preserving core manufacturing strengths.
Chinese contenders Midea and Haier are leveraging cost advantages and targeted acquisitions, such as Haier’s 2025 purchase of Hungary-based KLIMA KFT, to broaden HVAC portfolios and cross-sell appliances into new geographies. Start-ups like Tovala and June are positioning software-defined ovens that receive recipe updates weekly, illustrating how cloud architectures can disrupt traditional refresh cycles. Meanwhile, cybersecurity compliance costs are rising; vendors with in-house security teams earn procurement preference from hospitality chains and multi-family developers. Strategic focus thus oscillates between scaling service ecosystems, securing supply chains, and meeting divergent regional regulations, all while preserving margin in a price-sensitive smart home appliances market.
Equipment makers are also building patent walls around AI diagnostic models that predict component failure weeks in advance, reducing warranty claims. Collaboration with utilities on demand-response pilots grants appliance OEMs valuable grid data, creating an entry barrier for software-only newcomers. The race to embed energy-trading algorithms could redefine value pools, pivoting revenue toward transaction fees rather than hardware markups over the next decade.
Smart Home Appliances Industry Leaders
Samsung Electronics Co., Ltd.
LG Electronics Inc.
Whirlpool Corporation
AB Electrolux
BSH Hausgeräte GmbH
- *Disclaimer: Major Players sorted in no particular order

Recent Industry Developments
- September 2025: Samsung Electronics launched advertising capabilities on Family Hub refrigerators, creating targeted marketing revenue streams.
- June 2025: Haier Smart Home acquired KLIMA KFT to expand HVAC capabilities across Central and Eastern Europe.
- February 2025: GE Appliances integrated Google Cloud AI across its smart portfolio to enable predictive maintenance and energy optimization.


Global Smart Home Appliances Market Report Scope
The paper examines the present market environment and significant factors affecting smart home equipment and gadgets. The study's scope includes gadgets that can be connected to a network and controlled from a distance, like tablets and smartphones. The study's scope contains appliances, including ovens, dishwashers, refrigerators, cooktops and cookware, scales, thermometers, and other items. The paper discusses the market trends in particular North American, European, and Asia-Pacific countries.
The smart home appliance market report is segmented by product type (smart ovens, smart dishwashers, smart refrigerators, smart cookware and cooktops, smart scale and thermometers), and geography (North America (United States, Canada), Europe (Germany, United Kingdom, France, Spain), Asia Pacific, and the Rest of the World). The market sizes and forecasts are provided in terms of value (USD) for all the above segments.
| Smart Refrigerators |
| Smart Ovens |
| Smart Dishwashers |
| Smart Washing Machines and Dryers |
| Smart Cookware and Cooktops |
| Smart Vacuum Cleaners |
| Smart Air Conditioners |
| Smart Scales and Thermometers |
| Other Product Types |
| Wi-Fi |
| Bluetooth |
| Zigbee |
| Z-Wave |
| Thread |
| Other Technologies |
| Online |
| Offline |
| Residential |
| Commercial |
| North America | United States |
| Canada | |
| Mexico | |
| South America | Brazil |
| Argentina | |
| Rest of South America | |
| Europe | Germany |
| United Kingdom | |
| France | |
| Italy | |
| Spain | |
| Russia | |
| Rest of Europe | |
| Asia Pacific | China |
| Japan | |
| South Korea | |
| India | |
| Australia and New Zealand | |
| Southeast Asia | |
| Rest of Asia Pacific | |
| Middle East | Saudi Arabia |
| United Arab Emirates | |
| Turkey | |
| Rest of Middle East | |
| Africa | South Africa |
| Nigeria | |
| Egypt | |
| Rest of Africa |
| By Product Type | Smart Refrigerators | |
| Smart Ovens | ||
| Smart Dishwashers | ||
| Smart Washing Machines and Dryers | ||
| Smart Cookware and Cooktops | ||
| Smart Vacuum Cleaners | ||
| Smart Air Conditioners | ||
| Smart Scales and Thermometers | ||
| Other Product Types | ||
| By Connectivity Technology | Wi-Fi | |
| Bluetooth | ||
| Zigbee | ||
| Z-Wave | ||
| Thread | ||
| Other Technologies | ||
| By Distribution Channel | Online | |
| Offline | ||
| By End-User Industry | Residential | |
| Commercial | ||
| By Geography | North America | United States |
| Canada | ||
| Mexico | ||
| South America | Brazil | |
| Argentina | ||
| Rest of South America | ||
| Europe | Germany | |
| United Kingdom | ||
| France | ||
| Italy | ||
| Spain | ||
| Russia | ||
| Rest of Europe | ||
| Asia Pacific | China | |
| Japan | ||
| South Korea | ||
| India | ||
| Australia and New Zealand | ||
| Southeast Asia | ||
| Rest of Asia Pacific | ||
| Middle East | Saudi Arabia | |
| United Arab Emirates | ||
| Turkey | ||
| Rest of Middle East | ||
| Africa | South Africa | |
| Nigeria | ||
| Egypt | ||
| Rest of Africa | ||


Key Questions Answered in the Report
What is the current value of the smart home appliances market?
The market is valued at USD 192.05 billion in 2026 and is forecast to reach USD 311.44 billion by 2031.
Which product category leads revenue?
Smart washing machines and dryers lead with 24.12% market share in 2025.
Which connectivity technology is growing fastest?
Thread protocol is projected to grow at a 12.94% CAGR through 2031 as Matter certification spreads.
What is driving commercial uptake?
Hospitality and restaurant operators are adopting connected appliances to meet sustainability mandates and lower operating costs, yielding an 11.32% CAGR forecast.
Which region will see the fastest growth by 2031?
Asia Pacific is set to expand at an 11.12% CAGR, propelled by China’s infrastructure investments and rising middle-class demand.
How do time-of-use tariffs affect adoption?
Real-time pricing programs can cut electricity bills by 15–20%, giving households a clear payback case for connected appliances.
Page last updated on:


