Market Overview
| Study Period | 2020 - 2031 |
|---|---|
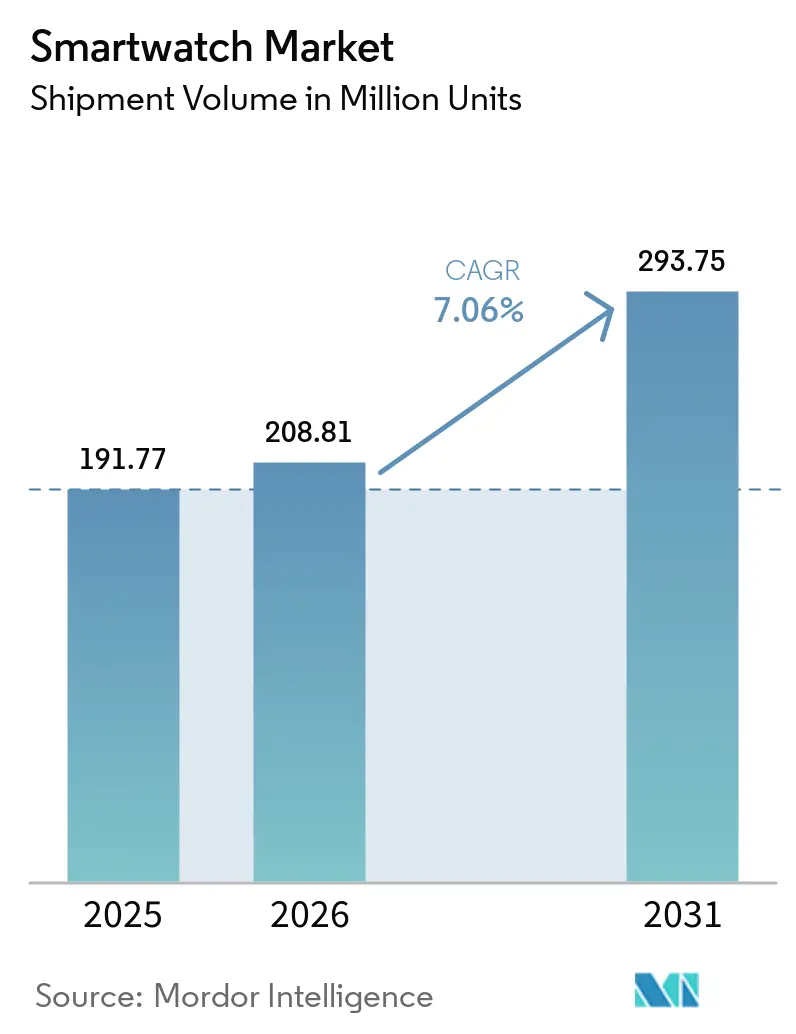
| Market Volume (2026) | 208.81 Million units |
| Market Volume (2031) | 293.75 Million units |
| Growth Rate (2026 - 2031) | 7.06% CAGR |
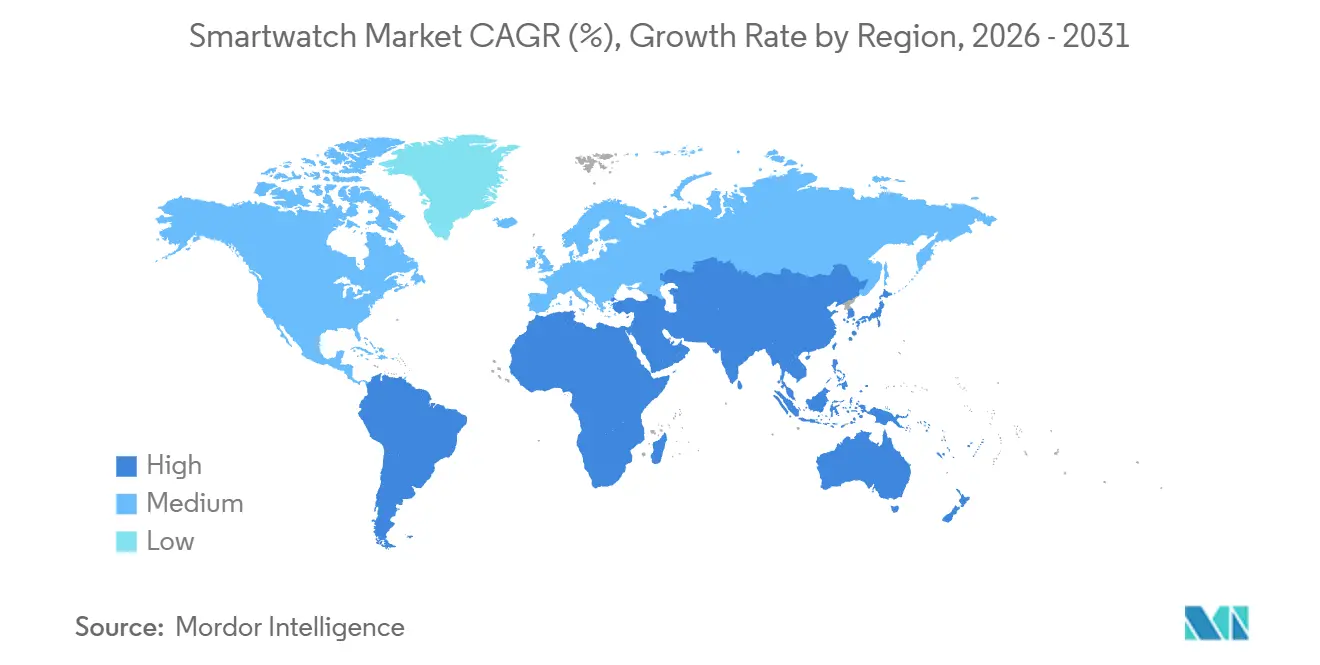
| Fastest Growing Market | Middle East |
| Largest Market | Asia-Pacific |
| Market Concentration | Medium |
Major Players*Disclaimer: Major Players sorted in no particular order Image © Mordor Intelligence. Reuse requires attribution under CC BY 4.0. | |
Smartwatch Market Analysis by Mordor Intelligence
The Smartwatch Market size in terms of shipment volume is projected to be 191.77 Million units in 2025, 277.49 Million units in 2026, and reach 293.75 Million units by 2031, registering a CAGR of 7.06% between 2026 to 2031. As expanding clinical reimbursement, corporate-wellness incentives, and low-power silicon converge to sustain double-digit growth. Competitive advantage now hinges on securing medical device clearances, integrating with telemedicine platforms, and maintaining battery endurance that meets multi-day health monitoring demands. Asia Pacific continues to account for almost two-fifths of global shipments, but device subsidies tied to preventive-care mandates in the Gulf Cooperation Council propel the Middle East toward the fastest regional growth. HarmonyOS gains momentum in China’s price-sensitive cities, Micro-LED enters premium models after overcoming yield bottlenecks, and carrier-bundled eSIM plans in North America and Europe reframe connectivity as a recurring-revenue lever. Commercial headwinds center on fragmented privacy laws and OLED supply constraints, yet sustained R&D around sensor fusion and on-device AI keeps the smartwatch market on its current expansion path.
Key Report Takeaways
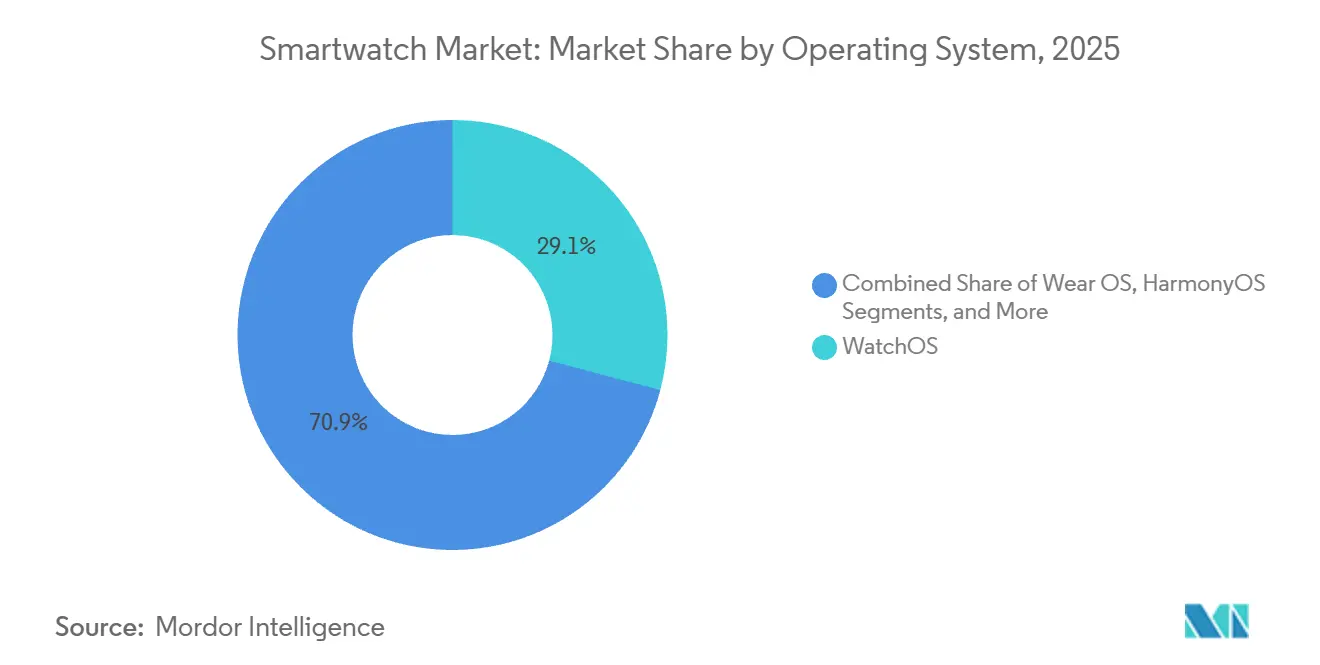
- By operating system, watchOS led with 29.12% smartwatch market share in 2025 while HarmonyOS is projected to grow at 8.01% CAGR through 2031.
- By display technology, AMOLED panels captured 68.46% of shipments in 2025 whereas Micro-LED displays are forecast to expand at a 9.21% CAGR to 2031.
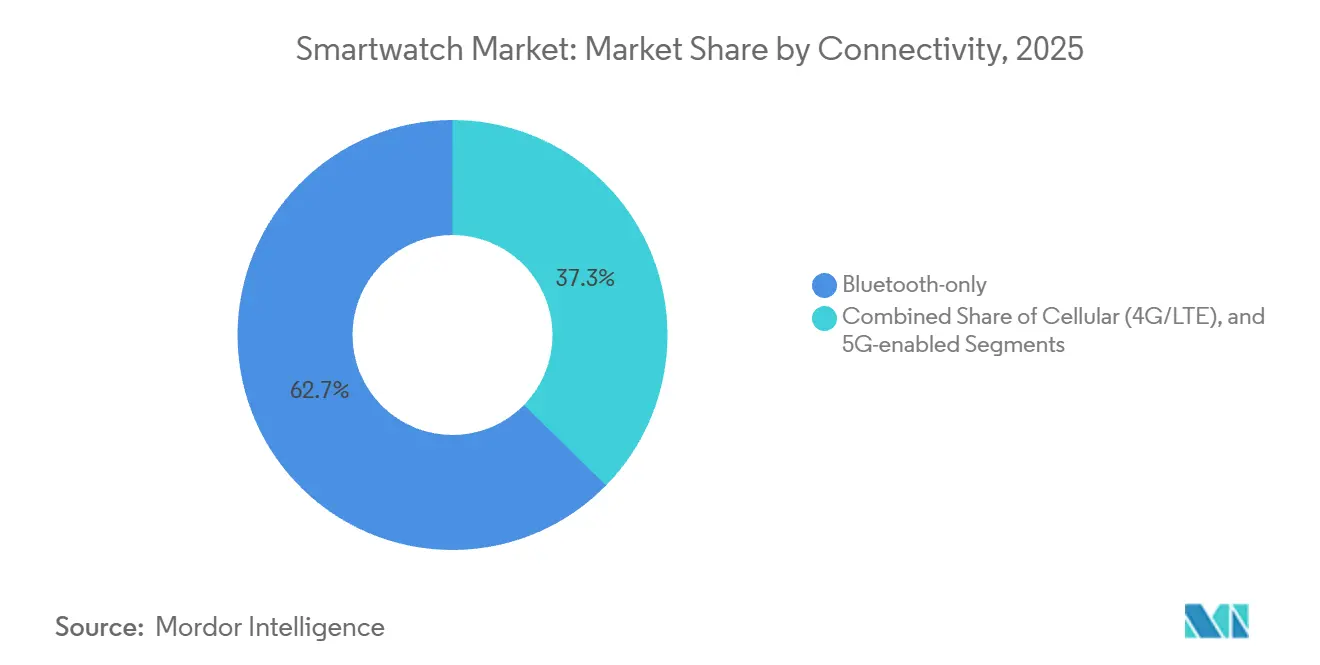
- By connectivity, Bluetooth-only variants held 62.67% share of the smartwatch market size in 2025 and 5G-enabled models are set to advance at an 7.96% CAGR.
- By application, fitness and wellness accounted for 48.74% of the smartwatch market size in 2025 and medical and chronic-care use cases are expected to progress at a 8.74% CAGR.
- By geography, Asia Pacific commanded 39.36% of unit volume in 2025, while the Middle East will post the quickest expansion at 10.57% CAGR through 2031.
Note: Market size and forecast figures in this report are generated using Mordor Intelligence’s proprietary estimation framework, updated with the latest available data and insights as of January 2026.
Global Smartwatch Market Trends and Insights
Drivers Impact Analysis*
| Driver | (~) % Impact on CAGR Forecast | Geographic Relevance | Impact Timeline |
|---|---|---|---|
| Rapid Feature-Rich Upgrades by Leading OEMs | +3.8% | Global, with premium-tier concentration in North America, Europe, and Asia Pacific urban centers | Short term (≤ 2 years) |
| Convergence of Health Monitoring with Telemedicine Platforms | +4.2% | North America and Europe lead; Asia Pacific tier-1 cities accelerating | Medium term (2-4 years) |
| Growing Corporate Wellness and Insurance-Linked Incentive Programs | +3.5% | North America and Europe; pilot expansion in Australia, Singapore, and UAE | Medium term (2-4 years) |
| Rising Smartwatch Adoption in Emerging Middle-Income Asia Pacific Cities | +4.6% | Asia Pacific tier-2 and tier-3 cities in China, India, Indonesia, and Vietnam | Long term (≥ 4 years) |
| Low-Power AI Chips Enabling On-Device Analytics | +2.9% | Global, with R&D concentration in United States, Taiwan, and South Korea | Medium term (2-4 years) |
| Government-Funded Remote Elder Care Pilots | +2.3% | Europe (Hungary, Netherlands, Finland); Asia Pacific (Japan, South Korea); North America (Canada) | Long term (≥ 4 years) |
| Source: Mordor Intelligence | |||
Rapid Feature-Rich Upgrades by Leading OEMs
Apple secured De Novo clearance for sleep-apnea screening on the Watch Series 10 in September 2024, followed by Samsung’s clearance for the Galaxy Watch 7 within six months, reinforcing an upgrade cadence that keeps premium buyers on a two-year replacement cycle.[1]U.S. Food and Drug Administration, “Digital Health Center of Excellence,” fda.gov Garmin and Huawei then broadened the spec race with dual-frequency GPS and ±2 bpm heart-rate precision, signaling that regulated health features now drive brand differentiation. Achieving medical-grade status adds engineering and compliance overhead that only companies with integrated silicon, algorithm, and legal teams can absorb, effectively raising entry barriers. The result is a smartwatch market in which top-tier OEMs maintain gross margins of 40% while budget brands rely on volume at razor-thin spreads. Continuous feature rollouts, therefore, lift overall ASPs even as shipments climb.
Convergence of Health Monitoring with Telemedicine Platforms
Garmin’s October 2024 integration with Medixine enabled hospital clinicians in 200 European centers to stream continuous heart rate and oxygen saturation data directly into electronic medical records. Samsung opened its Health SDK in July 2024, securing partnerships with Teladoc and Amwell within four months. Masimo’s sensor licensing now enables Wear OS OEMs to pursue 510(k) clearance without building pulse-oximetry IP from scratch. This deep health-cloud connectivity became commercially viable once the U.S. Centers for Medicare and Medicaid Services began reimbursing remote physiologic monitoring that relies on smartwatch data in January 2025. Platforms capable of HIPAA compliance, ISO 13485 audits, and multi-jurisdictional data residency requirements now convert raw sensor streams into billable services, driving attach-rate-driven revenue that exceeds hardware margins.
Growing Corporate Wellness and Insurance-Linked Incentive Programs
UnitedHealthcare’s Motion program covered 4 million policies by the end of 2024, reducing premiums by up to USD 1,500 for members who met daily biometric goals. Vitality’s international rollout showed a 34% lower incidence of cardiovascular admissions among smartwatch participants, prompting Aetna and Humana to co-brand incentive schemes. U.S. regulators capped employer incentives at 30% of total plan costs in May 2024, providing a clear framework that legitimized mandatory wearables in workplace benefits. Deloitte’s 2024 survey found that 62% of multinationals plan to ingest wearable data into occupational-health dashboards by 2026, allocating budgets that swell the corporate procurement channel. These programs create a feedback loop where actuarial savings subsidize devices, nudging late adopters into the smartwatch market.
Rising Smartwatch Adoption in Emerging Middle-Income Asia Pacific Cities
China produced 80.954 million smartwatches in 2024, a 20% jump year-over-year, as HarmonyOS cross-sells and e-commerce flash sales reached tier-3 locales. India’s sub-INR 1,700 (USD 18.91) segment exploded after ASPs fell by 62% in three years, yet premium bands above INR 20,000 (USD 222.45) grew 147%, illustrating market bifurcation. Noise seized a 26% share in the entry tier by partnering with chain retailers that dominate offline distribution in smaller cities. The United Arab Emirates, with high smartphone penetration and state-backed wellness apps, generated USD 395 million in smartwatch sales in 2024. Meanwhile, installment schemes on Southeast Asian marketplaces are now lowering the threshold for first-time buyers. These diverse yet interconnected trends funnel millions of new users into the smartwatch market annually.
Restraints Impact Analysis*
| Restraint | (~) % Impact on CAGR Forecast | Geographic Relevance | Impact Timeline |
|---|---|---|---|
| Data-Privacy Regulations Tightening Health-Data Flows | -2.1% | Europe (GDPR, ePrivacy Regulation); China (PIPL); California (CPRA) | Medium term (2-4 years) |
| Battery-Life Limitations Due to Continuous Sensing | -1.8% | Global, with acute impact on cellular-enabled models | Short term (≤ 2 years) |
| Supply-Chain Fragility for Advanced OLED Panels | -1.4% | Global, with bottlenecks in South Korea and China OLED fabs | Short term (≤ 2 years) |
| Plateauing Differentiation in Mid-Tier Price Band | -1.2% | Asia Pacific and Latin America, where USD 50-150 segment saturates | Medium term (2-4 years) |
| Source: Mordor Intelligence | |||
Data-Privacy Regulations Tightening Health-Data Flows
The European Union’s GDPR treats heart-rate and sleep data as special-category information, requiring granular opt-in and human oversight for automated decisions. A forthcoming ePrivacy Regulation will introduce consent layers by data type in 2027, likely delaying feature rollouts until country-level approvals are obtained. China’s Personal Information Protection Law bars cross-border transfers without adequacy assessments, complicating global cloud architectures for smartwatch vendors. California’s CPRA prohibits insurers from adjusting premiums with biometric data unless members re-consent annually. Maintaining parallel compliance stacks raises costs and fragments user experiences, acting as a headwind on smartwatch market penetration in highly regulated regions.
Battery-Life Limitations Due to Continuous Sensing
Optical sensors for 24-hour blood-oxygen tracking drain 8-12 mAh per day from 300-400 mAh cells, halving real-world endurance once LTE and always-on displays are activated.[2] IEEE, “Power Consumption in Wearable Photoplethysmography,” ieeexplore.ieee.org Apple Watch Series 10 still advertises only 18 hours because multi-day batteries would require a thicker case that consumers reject. Solid-state prototypes promise 50% better density but face cycle-life hurdles that keep mass production beyond 2028. Solar bezels extend life by 10-15% yet add USD 100 to costs and appeal mostly to outdoor enthusiasts. Power budgets, therefore, remain the gating factor on sensor richness and standalone cellular functions, tempering adoption among users who cannot charge midday.
*Our forecasts treat driver/restraint impacts as directional, not additive. The impact forecasts reflect baseline growth, mix effects, and variable interactions.
Segment Analysis
By Operating System: Ecosystem Control Versus Price-Driven Gains
The watchOS retained 29.12% smartwatch market share in 2025 thanks to Apple’s vertically integrated hardware, software, and services stack that converts each device into a recurring Fitness+ subscription. HarmonyOS, however, is growing at a 8.01% CAGR as Huawei bundles smartwatches priced between CNY 800 (USD 110) and CNY 2,500 (USD 345) across China’s 800 million-user smartphone base.
Wear OS remains fragmented across Snapdragon, Exynos, and MediaTek silicon, resulting in inconsistent battery life that hinders uptake, even after Fitbit’s sensor IP infusion. Proprietary real-time operating systems from Garmin and Polar trade app stores for 14-day endurance, satisfying endurance athletes who value GPS precision over ecosystems. The FDA’s March 2024 guidance now classifies algorithmic health upgrades as new medical device submissions, a rule that favors platforms capable of aligning software and hardware release cycles. In China, streamlined provincial approvals enable HarmonyOS to deploy Class II features more quickly than its foreign rivals, thereby maintaining its price-performance edge.[3]National Medical Products Administration China, “Class II Device Registration,” nmpa.gov.cn


By Display Technology: AMOLED Sets the Baseline while Micro-LED Targets Ultra-Premium
AMOLED commanded 68.46% of 2025 shipments as Samsung Display and BOE drove panel costs below USD 12, enabling always-on screens in watches priced under USD 150. The smartwatch market size for AMOLED models continues to widen even though supply chain bottlenecks can extend lead times to 12 weeks during flagship phone launches.
Micro-LED is projected to grow at a 9.21% CAGR through 2031, following PlayNitride's achievement of 99.99% mass-transfer yields, which have pushed production costs below USD 15 per square inch. Apple’s prototype Watch Ultra with Micro-LED boasts 2,000-nit brightness and 30% lower power draw, enticing pilots and sailors who need daylight visibility. TFT-LCD now clings to sub-USD 50 kids’ watches because price parity has eliminated its edge. Yet supply concentration in two Korean OLED giants elevates risk, forcing brands like Garmin to downgrade resolutions when allocations tighten.
By Connectivity: Cost-Efficient Bluetooth Dominates as 5G Prepares for Health-Grade Uplinks
Bluetooth-only models held 62.67% of global shipments in 2025, demonstrating that most users stay within 10 meters of a smartphone and would rather save USD 50-100 than pay for a separate line. That discount preserves volume leadership in the smartwatch market.
Cellular smartwatches carve out niches among families and athletes, and planned 5G network slicing promises low-latency medical alerts, positioning wearables as regulatory-grade endpoints. Qualcomm’s wearable modem lowers transmit power below 500 mW, shaping an 7.96% CAGR for 5G-enabled units through 2031. Verizon and T-Mobile eliminated smartwatch line fees in August 2024, effectively bundling devices into their existing unlimited plans and stimulating uptake among parents who track their children. China’s ban on consumer eSIMs compels local models to use nano-SIM trays, adding thickness and sealing challenges that slow cellular penetration.
By Application: Fitness Plateau Meets Medical-Care Acceleration
Fitness and wellness contributed 48.74% of volumes in 2025, but commoditization from free smartphone apps tempers momentum. Medical and chronic-care use cases, in contrast, are expanding at a 8.74% CAGR as CPT 99454 reimburses USD 64 per patient monthly for wearable physiologic monitoring, lifting the smartwatch market size in healthcare beyond fitness-only demand.
FDA clearances for atrial fibrillation algorithms across Apple, Fitbit, Samsung, and Amazfit demonstrate that Class II pathways are achievable, unlocking billable chronic care programs at Mayo and Cleveland Clinics that reduce readmissions by up to 22%. NFC-based payments and voice-assistant tasks grow in parallel with the rising penetration of tokenized credentials, yet these features remain additive rather than primary purchase drivers. Enterprise and industrial tracking occupies less than 5% of units but secures higher ASPs because ruggedization and software integrations justify premiums.
Geography Analysis
The Asia Pacific region accounted for 39.36% of 2025 shipments, with China delivering 45.8 million units in the first nine months of 2024, as vendor subsidies and livestream commerce drove demand from lower-tier cities. India experienced a 30% contraction when ASPs declined, although the premium band above INR 20,000 still doubled, underscoring a two-speed market. Japan and South Korea are leveraging aging-society health budgets for elder-care pilots that involve placing smartwatches on at-risk seniors, channeling unit growth despite high smartphone saturation.
The Middle East is expected to record the fastest growth rate of 10.57% through 2031, as the United Arab Emirates links Dubai’s 10X Health program to step-count incentives and Saudi Arabia dedicates SAR 2 billion to digital health hardware.[4]Saudi Ministry of Health, “Vision 2030 Digital Health Investments,” moh.gov.sa Offline retail dominates sales, favoring vendors with mall kiosks that offer Arabic-language demos and instant warranty service. Turkey’s 55% import surge illustrates pent-up demand once installment plans spread payments across 6-12 months.
North America’s installed base surpassed 100 million units by mid-2025, meaning growth now depends on induced replacement cycles. WatchOS 11 dropped support for Series 4 and older, nudging five-year users to upgrade. Canada expands insurance coverage for glucose sensors that pair with smartwatches, enlarging the clinical addressable base. Europe’s GDPR slows feature parity, evidenced by a six-month delay for Samsung’s sleep-apnea detection rollout while legal agreements were finalized. Mexico’s 21% growth rides e-commerce financing, though counterfeit imports account for up to 20% of units and erode brand trust.

Competitive Landscape
Apple and Samsung together ship close to half of all units, yet capture more than 70% of revenue because ASPs average above USD 400 and vertical integration locks in service income. Huawei holds 18% share in its domestic market by combining HarmonyOS with 5,000 branded stores that substitute for absent Google services. Garmin differentiates through multi-week battery life and FDA-cleared health metrics that now integrate into European hospital dashboards, sustaining ASPs above USD 450.
In the sub-USD150 tier, fragmentation prevails. Noise rose from zero to a 26% Indian share by occupying offline shelves in tier-2 cities, while Zepp Health’s FDA clearance introduces regulated features at USD 200 price points, which threaten incumbent mid-range brands. Patent activity indicates that Apple is targeting non-invasive glucose sensing and tendon-based gesture control, whereas Samsung’s Masimo partnership grants exclusive pulse-oximetry IP through 2029. Fossil’s 2024 operating loss, surpassing USD 100 million, suggests further consolidation as fashion license brands exit the wearables market.
Zebra Technologies and Honeywell supply MIL-STD-certified devices that scan barcodes in warehouses, a functionality absent from consumer models. Carriers see attach-rate upside; Verizon’s 2024 bundle waived smartwatch line fees, creating new channels that hardware vendors cannot access independently. Supply-chain fragility around OLED and regulatory churn around health data remain common risks, but strategic control over silicon, sensors and cloud bolsters the moat for market leaders.
Smartwatch Industry Leaders
Apple Inc.
Samsung Electronics Co. Ltd
Garmin Ltd
Fitbit Inc.
Fossil Group Inc.
- *Disclaimer: Major Players sorted in no particular order

Recent Industry Developments
- May 2025: Apple reported USD 7.5 billion in Q2 wearables revenue and confirmed broader production shifts to India and Vietnam.
- March 2025: European Commission ordered Apple to open iOS interfaces for third-party smartwatches, targeting full compliance by 2026.
- January 2025: Pison and STMicroelectronics partnered with Timex to commercialize neural-sensor watches launching in spring 2025.
- January 2025: KAIST and University of Michigan published a study demonstrating depression prediction from smartwatch circadian data.


Research Methodology Framework and Report Scope
Market Definitions and Key Coverage
Our study defines the smartwatch market as wrist-worn, app-capable devices that host their own operating system, integrate wireless radios, and collect or display real-time data such as health metrics, notifications, voice commands, or payments. Shipments measured include brand-new consumer and enterprise units sold through all retail and carrier channels.
Scope exclusion: Basic step counters, analog or quartz watches lacking an embedded OS, and modular smart bands sold without a watch housing are not counted.
Segmentation Overview
- By Operating System
- WatchOS
- Wear OS
- HarmonyOS
- Proprietary / RTOS
- By Display Technology
- AMOLED
- Micro-LED
- TFT-LCD
- By Connectivity
- Bluetooth-only
- Cellular (4G/LTE)
- 5G-enabled
- By Application
- Fitness and Wellness
- Medical and Chronic-care
- Personal Assistance and Payments
- Other Applications
- By Geography
- North America
- United States
- Canada
- Mexico
- South America
- Brazil
- Argentina
- Rest of South America
- Europe
- Germany
- United Kingdom
- France
- Italy
- Spain
- Russia
- Rest of Europe
- Asia Pacific
- China
- Japan
- South Korea
- India
- Australia
- New Zealand
- Rest of Asia Pacific
- Middle East
- United Arab Emirates
- Saudi Arabia
- Turkey
- Rest of Middle East
- Africa
- South Africa
- Nigeria
- Kenya
- Rest of Africa
- North America
Detailed Research Methodology and Data Validation
Primary Research
Mordor analysts conduct structured interviews with contract manufacturers across Asia, chipset suppliers in the United States, leading health-app developers, and cardiologists in Europe to test unit mix assumptions, replacement cycles, and sensor accuracy thresholds. Regional panel surveys of urban consumers and carrier channel partners further ground our estimates on usage patterns and subsidy effects.
Desk Research
We begin by mapping the universe of shipments and average selling prices through publicly available statistics from organizations such as the International Data Corporation, the World Trade Organization's customs portal, national telecom regulators, and trade associations like the Bluetooth SIG. Annual reports filed on EDGAR and European business registries give us company-level revenues that are cross-checked in D&B Hoovers, while news flows in Dow Jones Factiva flag production shifts or regulatory approvals that may change supply. Academic journals covering wearable biosensors and patents retrieved from Questel help validate technology adoption inflection points. This list illustrates, but does not exhaust, the secondary inputs reviewed.
Market-Sizing & Forecasting
A top-down reconstruction starts with country-level production, import, and retail-activation data, which are then aligned to smartphone install bases to infer attainable smartwatch penetration. Results are pressure-tested through selective bottom-up roll-ups of tier-one brand shipments and sampled ASP × volume checks. Key drivers, such as smartphone penetration, median retail ASP erosion, launch cadence of FDA-cleared health features, corporate wellness subsidies, and channel inventory days, feed a multivariate regression that projects demand to 2030. Where bottom-up trails public data, interpolation uses moving-average smoothing before final reconciliation.
Data Validation & Update Cycle
Outputs undergo anomaly scans, peer review, and a senior analyst sign-off. We refresh every twelve months and reopen the model mid-cycle if product recalls, tariff shifts, or blockbuster launches move the market materially.
Why Mordor's Smartwatch Baseline Earns Trust
Published numbers often diverge because firms toggle between revenue and unit lenses, bundle adjacent wearables, or stretch forecasts without testing assumptions in live channels.
Key gap drivers include metric choice (units versus dollars), inclusion of hybrid or kids' watches, unverified ASP trajectories, and less frequent dataset refreshes.
Benchmark comparison
| Market Size | Anonymized source | Primary gap driver |
|---|---|---|
| 230.11 million units | Mordor Intelligence | - |
| USD 38.53 billion | Global Consultancy A | Relies on retail-revenue roll-up, limited primary validation |
| USD 108.31 billion | Trade Journal B | Bundles hybrid wearables and wellness subscriptions |
| USD 32.01 billion | Industry Association C | Uses conservative ASPs and partial regional coverage |
These comparisons show that Mordor Intelligence anchors its baseline in transparent shipment evidence, tempered by real-world pricing inputs, giving decision-makers a balanced, reproducible starting point.


Key Questions Answered in the Report
How fast is the smartwatch market expected to grow between 2026 and 2031?
The smartwatch market is projected to expand from 208.81 million units in 2026 to 293.75 million units in 2031, a 7.06% CAGR based on Mordor Intelligence estimates.
Which operating system is gaining ground the quickest?
HarmonyOS shows the fastest momentum, forecast at a 8.01% CAGR through 2031 as Huawei leverages its large smartphone base in China.
What display technology will define premium smartwatches over the next five years?
Micro-LED is poised to move into ultra-premium models thanks to cost reductions below USD 15 per square inch and 30% lower power draw than OLED.
Why are insurers interested in smartwatches?
Reimbursement codes such as CPT 99454 let providers bill USD 64 per month for wearable monitoring, enabling insurers to fund devices in exchange for lower hospitalization costs.
Which region will post the highest growth rate to 2031?
The Middle East is projected to lead with a 10.57% CAGR as Gulf-state wellness mandates and high smartphone penetration drive adoption.
What remains the biggest technical limitation for broader smartwatch adoption?
Battery life, especially when continuous health sensing and cellular connectivity run simultaneously, still caps device appeal for users unwilling to charge daily.
Page last updated on:


