
Smart Utilities Management Market Size and Share
Market Overview
| Study Period | 2020 - 2031 |
|---|---|
| Market Size (2026) | USD 20.38 Billion |
| Market Size (2031) | USD 41.84 Billion |
| Growth Rate (2026 - 2031) | 15.45 % |
| Fastest Growing Market | Asia Pacific |
| Largest Market | North America |
| Market Concentration | Medium |
Major Players *Disclaimer: Major Players sorted in no particular order Image © Mordor Intelligence. Reuse requires attribution under CC BY 4.0. | |
Smart Utilities Management Market Analysis by Mordor Intelligence
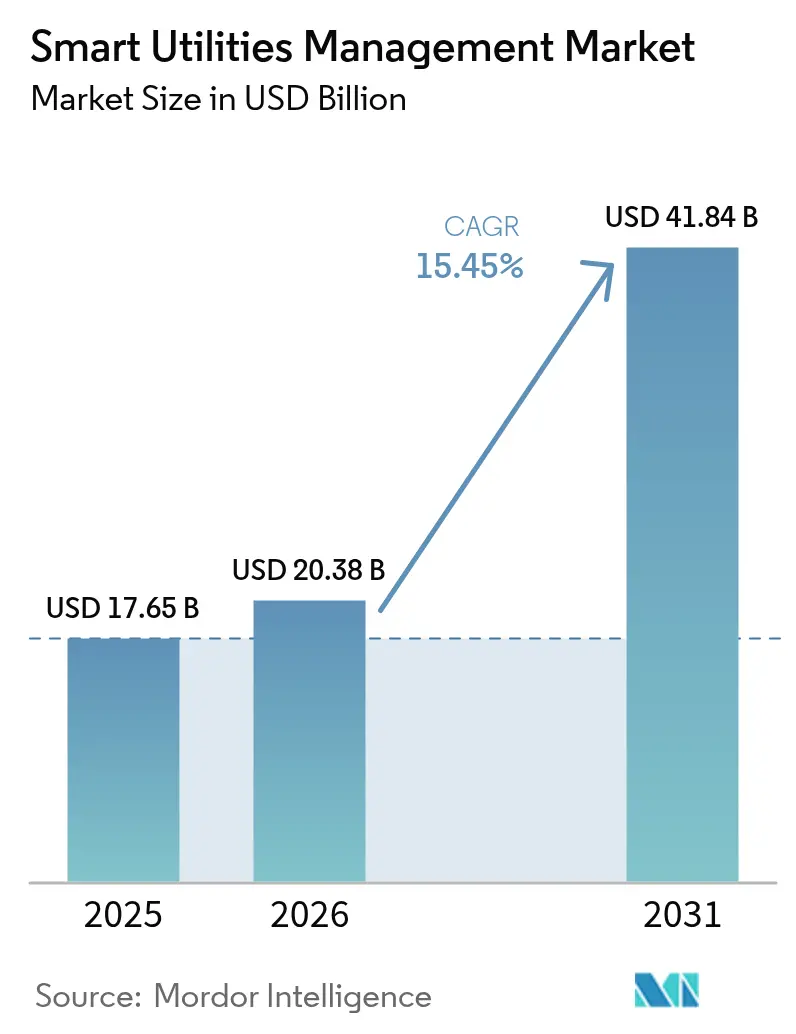
The smart utilities management market size was valued at USD 17.65 billion in 2025 and estimated to grow from USD 20.38 billion in 2026 to reach USD 41.84 billion by 2031, at a CAGR of 15.45% during the forecast period (2026-2031). Accelerated rollouts of advanced metering infrastructure (AMI), large-scale digital-twin deployments, and edge-enabled analytics are the chief forces sustaining this trajectory. North America remains the largest regional hub on the back of supportive regulation and grid-modernization budgets, while Asia-Pacific registers the fastest expansion as China and India direct record utility capex toward next-generation transmission and distribution. Utilities are also adopting microgrids and distributed energy resource (DER) orchestration platforms to harden networks against climate-driven outages and optimize behind-the-meter assets. Software solutions dominate procurement plans, yet managed services are rising fastest as utilities outsource complex system integration and cybersecurity oversight.
Key Report Takeaways
- By component, software captured 57.12% revenue in 2025, whereas services are poised to advance at a 15.95% CAGR through 2031.
- By type, meter data management systems held 47.85% of smart utilities management market share in 2025; advanced outage management systems are projected to expand at 15.55% CAGR to 2031.
- By utility, the electricity segment accounted for 57.62% share of the smart utilities management market size in 2025, while water utilities are forecast to grow 16.25% annually to 2031.
- By deployment, on-premise platforms represented 66.74% of spending in 2025; cloud rollouts are set to register a 16.7% CAGR over the same horizon.
- By geography, North America led with a 38.25% revenue share in 2025; Asia-Pacific is projected to surge at a 15.72% CAGR through 2031.
Note: Market size and forecast figures in this report are generated using Mordor Intelligence’s proprietary estimation framework, updated with the latest available data and insights as of 2026.
Market Trends and Insights
Drivers Impact Analysis of Smart Utilities Management Market*
| Driver | (~) % Impact on CAGR Forecast | Geographic Relevance | Impact Timeline |
|---|---|---|---|
| Rise in smart city deployment | +3.2% | Global, early traction in Singapore, China, India | Medium term (2-4 years) |
| Government mandates for AMI | +4.1% | North America, EU, core APAC | Short term (≤ 2 years) |
| Integration of DERs and microgrids | +2.8% | North America, Europe, spill-over APAC | Long term (≥ 4 years) |
| Improvements in energy efficiency | +2.3% | Global | Medium term (2-4 years) |
| Expansion of IoT-edge analytics | +1.9% | North America, Europe, emerging APAC | Medium term (2-4 years) |
| Digital-twin adoption for water and gas | +1.4% | North America, Europe, pilot APAC | Long term (≥ 4 years) |
| Source: Mordor Intelligence | |||
Rise in Smart City Deployment
Smart-city programs are accelerating end-to-end utility digitalization as municipal planners demand integrated power, water, transport, and waste operations. Singapore’s Punggol Digital District is deploying a district-level smart grid that unifies energy, cooling, and mobility data into a single command platform[1]JTC Corporation, “Punggol Digital District to Pilot First District-Level Smart Grid,” jtc.gov.sg. China’s vehicle-to-grid pilots are using connected electric vehicles to balance local distribution loads, signaling convergence between smart mobility and energy management. In the Middle East, Dubai Electricity and Water Authority committed USD 1.9 billion to its smart-grid roadmap, positioning utilities as digital backbones for city-wide optimization. These initiatives create strong network effects: once foundational telemetry is in place, additional city functions—from traffic lights to waste logistics—can ride on the same data spine, amplifying demand for unified utility platforms.
Government Mandates for Advanced Metering Infrastructure
Legislation is the single most powerful catalyst for near-term rollouts. Australia now requires universal smart meters across the National Electricity Market by 2030, declaring them “non-negotiable” for high-renewable grids. In the United States, the Energy Act of 2020 obliges federal facilities to install advanced water meters capable of daily readings. France’s nationwide Linky program showcases how a mandate can hit 90% household coverage within five years, setting performance benchmarks that ripple into export markets. Guaranteed volume commitments give vendors scale to cut unit costs and conform products to common standards, thereby lowering adoption risk for late-moving utilities.
Integration of Distributed Energy Resources (DERs) and Microgrids
DER proliferation is pushing utilities from one-way power delivery to bidirectional orchestration. San Diego Gas and Electric recently energized four islandable microgrids totaling 39 MW of solar generation and 180 MWh of storage to maintain service during wildfire disruptions. EPRI’s open-architecture work with Kraken is distilling new interoperability guidelines so utilities can enroll batteries, EVs, and flexible loads into virtual power plants without vendor lock-in. California Energy Commission studies indicate that small commercial sites pairing rooftop PV with storage can cut annual bills by up to USD 2,500 while enhancing voltage stability. Successful orchestration requires real-time situational awareness, automated dispatch, and settlement engines—capabilities intrinsic to the smart utilities management market.
Improvements in Energy Efficiency
Digital demand-side tools are delivering measurable kilowatt-hour savings. New York ISO logged a 16% uplift in registered demand-response capacity for summer 2025 after streamlining enrollment and analytics. California’s WaterWatch platform trimmed electricity use at Moulton Niguel Water District by 4.03%, validating the role of cross-utility data in optimizing pump schedules[2]California Energy Commission, “Building-Scale Solar and Storage Can Cut Bills by USD 2,500,” energy.ca.gov. Residential heuristic control algorithms are now cutting HVAC energy without sacrificing comfort, removing a historical barrier to consumer uptake. Together, these proof points strengthen the business case for broader rollouts of analytics-rich utility platforms.
Restraints Impact Analysis of Smart Utilities Management Market*
| Restraint | (~) % Impact on CAGR Forecast | Geographic Relevance | Impact Timeline |
|---|---|---|---|
| High Cost, Security and Integration Challenges for Smart Meters | -2.1% | Global, particularly acute in developing markets | Short term (≤ 2 years) |
| Complex, Evolving Data-Privacy Regulations | -1.8% | EU, North America, emerging in APAC | Medium term (2-4 years) |
| Interoperability Gaps from Proprietary Ecosystems | -1.5% | Global, with concentration in mature markets | Medium term (2-4 years) |
| Rural Dependence on Aging Telecom Infrastructure | -1.2% | Rural areas globally, acute in developing regions | Long term (≥ 4 years) |
| Source: Mordor Intelligence | |||
High Cost, Security and Integration Challenges for Smart Meters
Total-cost-of-ownership hurdles persist, especially where per-customer revenue is low. Full AMI conversions often require substation upgrades, head-end replacements, and new cybersecurity layers, driving up capex beyond meter hardware. Research published in the National Library of Medicine warns that each connected meter introduces an additional attack vector, expanding the grid’s threat surface. Interoperability suffers when vendors restrict APIs or apply proprietary firmware, as illustrated by Australian debates over closed battery ecosystems that limit participation in grid services. Component shortages, driven by semiconductor supply tightness, are prolonging lead times and inflating prices—factors that utilities in cost-sensitive economies must absorb or pass through to consumers.
Complex, Evolving Data-Privacy Regulations
Utilities straddling multiple jurisdictions face diverging consent, retention, and localization mandates. The U.S. Federal Communications Commission recently clarified that demand-response text alerts do not trigger extra consent hurdles, giving domestic operators breathing space. In contrast, Europe’s GDPR imposes strict opt-in requirements and stiff penalties for violations, obliging utilities to anonymize granular consumption profiles. Emerging Asian frameworks mirror GDPR but add local-storage clauses, compelling multi-cloud strategies that raise architecture complexity. Database re-engineering and continuous compliance audits add recurring opex that can erode return on investment if not budgeted upfront.
*Our forecasts treat driver/restraint impacts as directional, not additive. The impact forecasts reflect baseline growth, mix effects, and variable interactions.
Smart Utilities Management Market Segment Analysis
By Type:
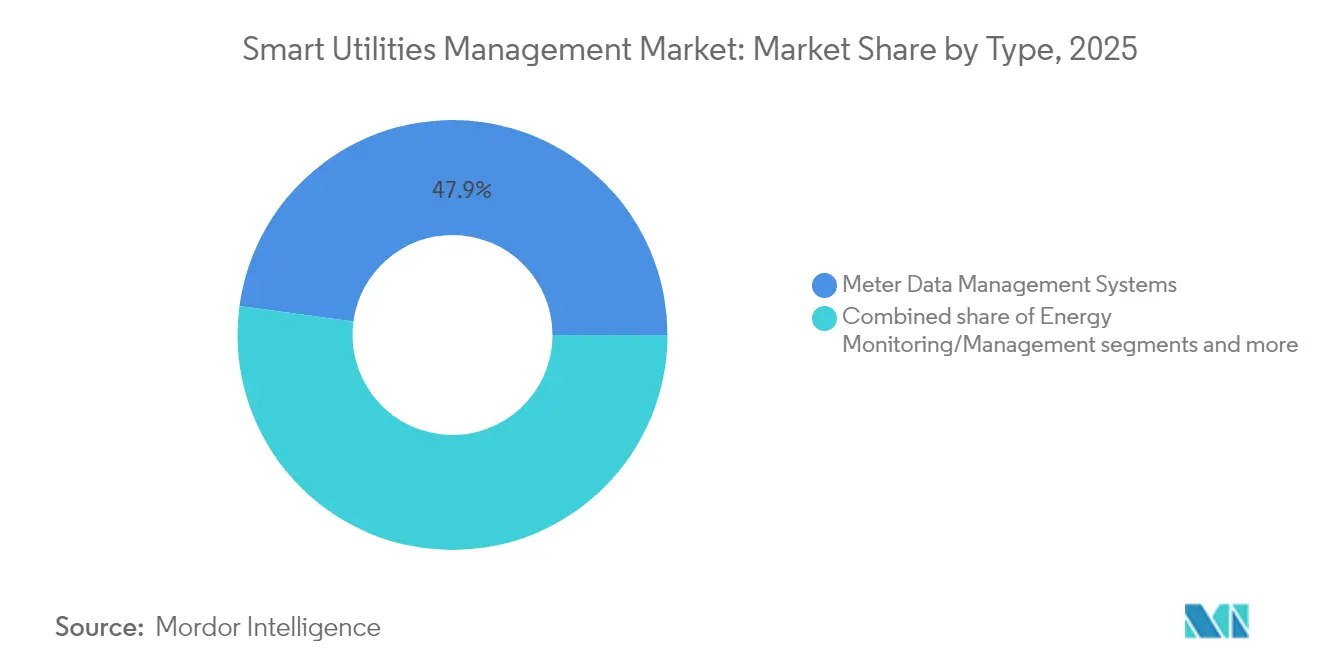
Advanced Systems Drive Operational IntelligenceMeter data management systems (MDMS) retained leadership with 47.85% revenue in 2025, underscoring utilities’ priority to collect, validate, and analyze interval readings at scale. The segment’s size also positions it as the anchor for broader analytics modules that feed outage, workforce, and asset-health applications, reinforcing vendor lock-in and fueling platform stickiness. Advanced outage management systems are accelerating at a 15.55% CAGR as utilities confront climate-driven extreme-weather events; AI-enabled topology modeling is shrinking fault-location windows from hours to minutes. CenterPoint Energy’s post-hurricane partnership with Neara highlights how utilities procure cloud-native simulation tools to stress-test networks before storm seasons. As multi-application convergence continues, purchasing decisions increasingly factor a vendor’s ability to harmonize MDMS with SCADA, geographic information systems, and DERMS, driving integrators to bundle modules in unified licenses.
A second-order effect of this convergence is the widening skills gap inside utilities. Operators accustomed to legacy SCADA must now interpret probabilistic forecasts and machine-learning outputs, steering utilities toward training programs or managed-operations contracts. Vendors that position MDMS as the kernel for operational intelligence are capturing downstream revenues in customer engagement, field-service automation, and cyber-response, strengthening the long-term cash-flow profile of the smart utilities management market.



By Component:
Software Leadership Drives Service GrowthSoftware accounted for 57.12% of spending in 2025, reflecting the high value assigned to analytics, visualization, and automation layers. Core utility software now embeds no-code dashboards, role-based access, and AI-assisted configuration, reducing commissioning cycles from months to days. Simultaneously, utilities are migrating license models from perpetual to subscription, smoothing opex but enlarging lifetime customer value for vendors. Services, although smaller, are expanding at 15.95% CAGR because integration and cybersecurity demands fall outside traditional utility competencies. Veolia’s collaboration with Mistral AI is emblematic: the firm is embedding generative AI chat interfaces so plant managers can query asset efficiency in natural language, essentially converting domain data into decision support.
Hardware sales remain critical for grid-edge visibility—particularly in emerging markets embarking on first-wave smart-meter rollouts—but margins are tightening. Suppliers, therefore, bundle firmware licenses, extended warranties, and managed-upgrade programs to lock in recurring revenue. In parallel, cloud hyperscalers court utilities with sector-specific environments certified for NERC CIP and ISO 27001, lowering perceived risk and accelerating the cloud pivot inside the smart utilities management market.
By Utility Type:
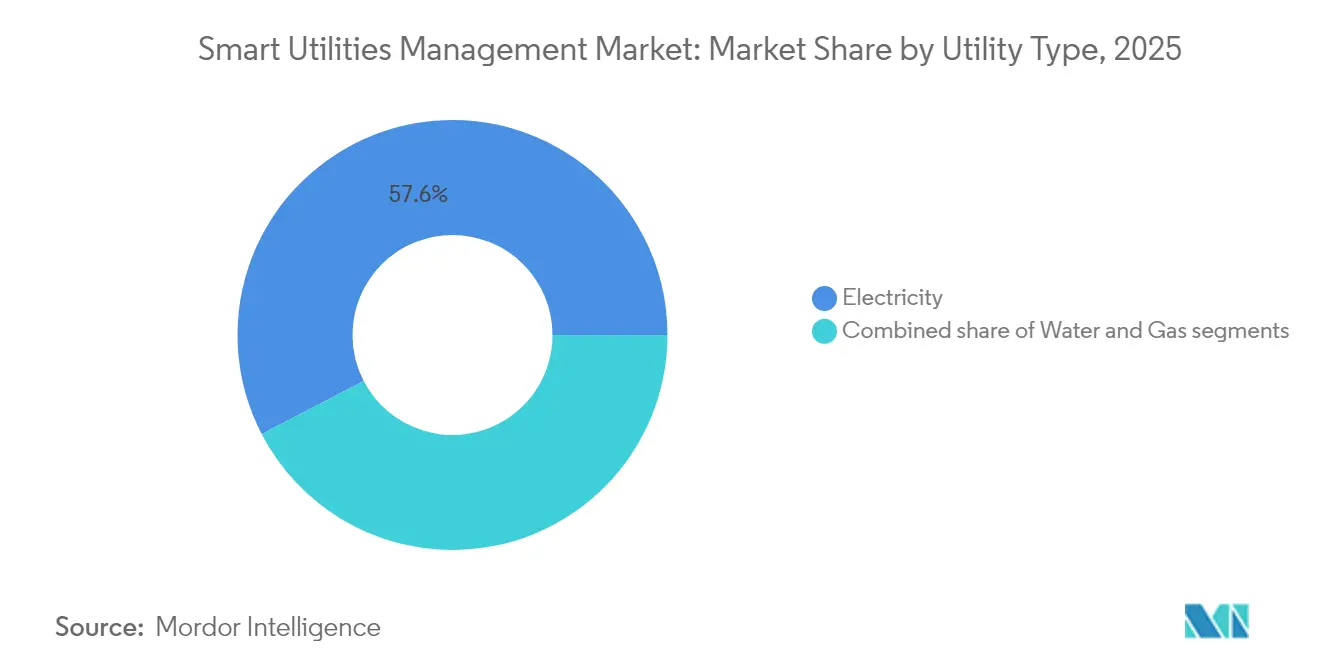
Electricity Leads While Water AcceleratesElectric utilities controlled 57.62% share of the smart utilities management market size in 2025 as transmission-upgrade cycles, DER-orchestration requirements, and EV-charging build-outs demanded advanced grid software. Regulatory cost-recovery mechanisms in North America and Europe further shorten payback periods, sustaining capital inflows. Water utilities, though traditionally under-digitized, are forecast to grow 16.25% annually as drought pressures and leakage penalties climb. Cairns Regional Council’s roll-out of NB-IoT smart meters illustrates how cloud-native telemetry unlocks daily visibility into consumption anomalies, automating customer alerts and maintenance dispatch.
Gas utilities continue focusing digital budgets on safety: remote pressure monitoring, automatic shut-off valves, and methane-leak detection drones. Although gas remains a smaller revenue pool, cross-vector convergence is rising. Multi-utility conglomerates now negotiate enterprise-wide licenses encompassing power, gas, and water, streamlining analytics across vectors and lowering vendor count. This bundling strategy expands total addressable spending per customer, reinforcing the scale advantages already embedded in the smart utilities management market.
By Deployment Mode:
Cloud Migration AcceleratesOn-premise installations still held 66.74% spending in 2025, reflecting cybersecurity mandates that push critical-infrastructure operators to retain physical control. However, the cloud sub-segment’s 16.7% CAGR signals a decisive migration trend as hyperscalers secure FedRAMP, GDPR, and NERC CIP attestations. Utilities now split workloads: real-time control loops and latency-sensitive protection stay on-site, whereas machine-learning training, historical analytics, and customer portals sit in the cloud. Hybrid architectures also leverage edge gateways to preprocess high-volume sensor feeds, a design that preserves data sovereignty while enabling cloud-based AI refinements.
Cloud economics favor smaller municipal or cooperative utilities that lack the scale to sustain redundant Tier III data centers. Pay-as-you-go compute converts capital expenditure into operating expenses aligned with tariff cycles, easing regulatory approvals. Furthermore, built-in disaster-recovery zones exceed most in-house capabilities, enhancing overall resilience. Collectively, these factors support sustained momentum in cloud adoption, deepening the total lifetime value of the smart utilities management market.
Geography Analysis
North America and Europe Smart Utilities Management Market
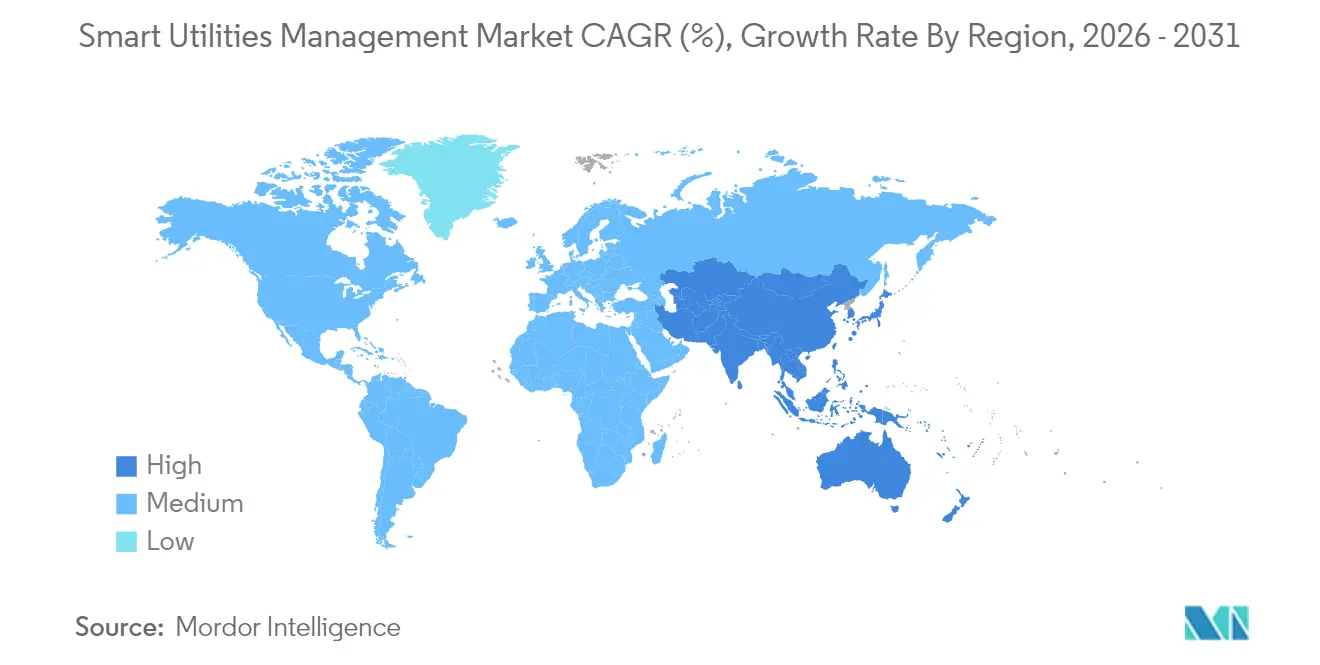
North America retained 38.25% revenue in 2025 thanks to a synchronized cycle of federal grants, state-level resiliency mandates, and aggressive investor-owned utility (IOU) capex plans. Penetration of AMI exceeds 80% of all meters, shifting attention to DERMS, outage prediction, and customer-centric time-of-use pricing. Europe continues to prioritize decarbonization and energy independence, championing digital twins for capacity planning and cybersecurity hardening across cross-border interties.
APAC Smart Utilities Management Market
Asia-Pacific, however, posts the fastest 15.72% CAGR, anchored by China’s USD 88.7 billion State Grid budget for 2025 and India’s USD 109 billion transmission upgrade blueprint. Governments in the region view digital networks as a prerequisite for large-scale renewable integration and urbanization policies. Vendor strategies, therefore, emphasize cost-optimized hardware, multilingual interfaces, and local-services partnerships to navigate tender rules. Smaller Southeast Asian markets replicate early mover playbooks, compressing adoption curves and sustaining above-average growth for the smart utilities management market.

Regulatory Landscape
Policy and reliability requirements continue to shape utility digitization, with mandates extending beyond meter rollouts into cybersecurity, interoperability, and system planning. In the United Kingdom, the post-2025 smart metering policy framework tightens supplier obligations and introduces more formalized planning, including requirements for annual smart meter deployment plans submitted to Ofgem. Australia is also accelerating AMI adoption through Australian Energy Market Commission rulemaking on smart meter deployment, reinforcing smart meters as foundational infrastructure for higher-renewables operation.
In the United States, grid modernization is increasingly tied to compliance upgrades for cyber resilience. In March 2026, FERC approved updates to Critical Infrastructure Protection (CIP) reliability standards, including CIP-003-11, supporting secure adoption of newer approaches such as virtualization while strengthening baseline controls for lower-impact BES cyber systems. In June 2026, FERC also issued show-cause orders to all six RTOs/ISOs on large-load integration rules, increasing the urgency for improved data, forecasting, and coordination tooling as AI data centers and other concentrated loads shift distribution and transmission planning assumptions.
Value Chain Analysis
The value chain covers grid-edge sensing and control hardware (smart meters, communications modules, relays, substation devices), connectivity providers (RF mesh, cellular/NB-IoT/5G, fiber), and software layers (head-end systems, meter data management systems, outage and distribution management, DERMS, digital twins, analytics, and cybersecurity). System integrators and managed service providers sit between vendors and utilities, managing OT/IT integration with SCADA, GIS, customer information, and field workforce systems, followed by commissioning, operations support, upgrades, and compliance reporting. Procurement is increasingly structured around hybrid architectures, with latency-critical functions remaining on-premise while advanced analytics and customer engagement workloads move to cloud environments.
Upstream constraints in grid equipment and critical materials affect deployment cadence and procurement behavior, with bottlenecks in transformers and other high-voltage components pushing utilities toward earlier design finalization and longer-term framework sourcing. At the same time, the software and services layer is gaining strategic weight as utilities use digital twins and DER analytics to extract more capacity from existing assets and reduce reliance on immediate physical upgrades. Vendor moves in 2026, such as Schneider Electric partnering with Kraken on flexibility and grid software integration and Corinex teaming with Plexigrid on digital-twin-driven visibility, point to ecosystem partnerships as a practical route for assembling end-to-end capabilities across sensing, modeling, and operational decisioning.
Competitive Landscape
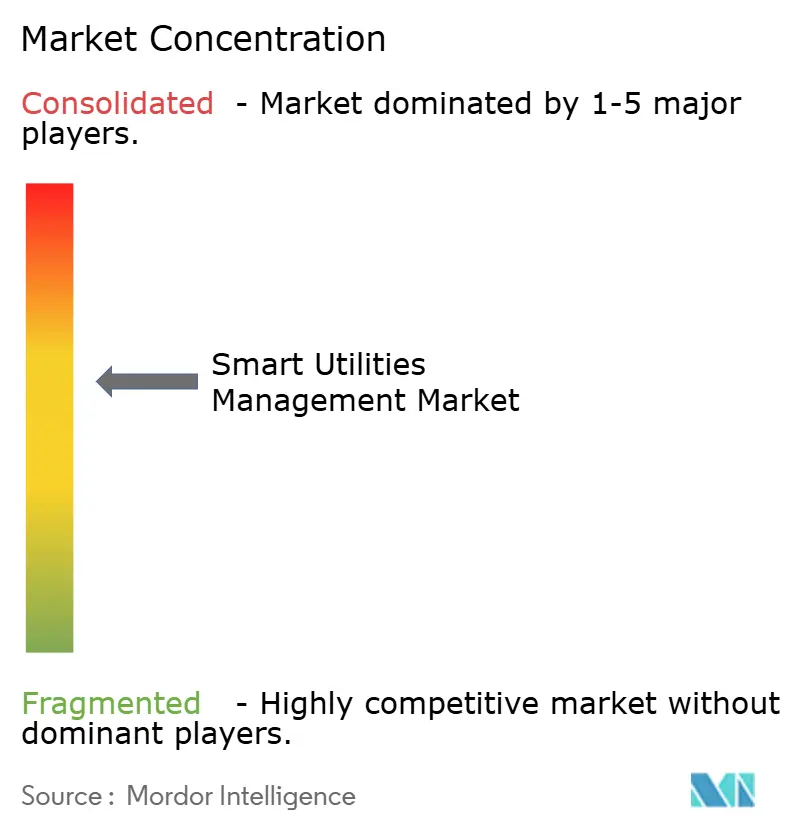
The smart utilities management market is moderately consolidated: a cadre of multinational incumbents anchor portfolios spanning meters, head-end software, and advanced analytics, yet specialist disruptors are gaining share in edge AI, cybersecurity, and virtual power plant orchestration. Large players such as Itron, Siemens, and Honeywell scale via technology alliances—NVIDIA for AI inference at the grid edge, EnergyHub for distributed-resource flexibility, or Verizon for 5G connectivity—reducing time-to-market for niche capabilities while preserving system-integration revenue.
Investment flows confirm the trend: ABB’s Electrification Ventures stake in Edgecom underscores incumbent appetite for generative-AI startups that complement existing OT-grade software[3]ABB, “ABB Electrification Ventures Invests in Edgecom,” abb.com. Meanwhile, cloud hyperscalers position industry-specific stacks—complete with digital-twin engines and event-driven data lakes—to win platform deals as utilities enter renewal cycles. Competitive intensity, therefore, revolves less around hardware differentiation and more around ecosystem breadth, partner certification, and cybersecurity credentials.
In emerging markets, local system integrators and meter assemblers thrive on price-sensitive tenders, often licensing firmware from global vendors while manufacturing domestically to satisfy localization mandates. This dynamic shifts high-margin software and services revenue toward multinational vendors but keeps hardware volumes local. As utilities pursue multi-vector strategies across electricity, gas, and water, vendors offering truly converged platforms stand to command premium valuations, reinforcing the scale advantages already at play in the smart utilities management market.
Smart Utilities Management Industry Leaders
IBM Corporation
Atos SE
Honeywell International Inc.
ABB Ltd
Siemens AG
- *Disclaimer: Major Players sorted in no particular order
Smart Utilities Management Market Companies Covered in this Report
- IBM Corporation
- Siemens AG
- Honeywell International Inc.
- ABB Ltd
- Cisco Systems Inc.
- Atos SE
- Itron Inc.
- Schneider Electric SE
- Oracle Corp.
- Landis+Gyr AG
- Aclara Technologies LLC
- Sensus (Xylem Inc.)
- Kamstrup A/S
- Trilliant Holdings
- Powel ASA
- GE Digital
- Eaton Corp. plc
- Silver Spring Networks (Itron)
- Enel X
- Huawei Technologies Co.

Market Opportunities and Future Outlook
Cybersecurity and compliance-driven modernization is widening the addressable scope beyond AMI into secure operations platforms and device governance. With EU Member States incorporating NIS2 into national law in 2026 and the Cyber Resilience Act setting cybersecurity requirements for products with digital elements, utilities and vendors are reshaping procurement toward auditable security controls, patchability, and interoperable data handling. This is increasing demand for managed security, identity, and compliance tooling embedded into utility software stacks.
Large, funded grid digitization programs and national monitoring initiatives also create deployment whitespace for unified operations, digital twins, and DER orchestration. In June 2026, the CINEA-backed Danube InGrid project (supported by EUR 135 million in CEF Energy funding) demonstrated multi-utility modernization at scale, including automatic on-load tap changer transformer operation in Hungary and remote monitoring for more than 680,000 supply points in Košice, Slovakia. In July 2026, the UAE Ministry of Energy and Infrastructure launched the Emirates Monitoring Center using Siemens Spectrum Power for real-time national network oversight, while in Vietnam, EVNHANOI reported replacement of mechanical meters with electronic meters connected to remote data collection and automation of 220 kV and 110 kV substations under Resolution 57-NQ/TW. Alongside operator-side programs, platform consolidation is emerging as a product-led opportunity, illustrated by GE Vernova launching GridOS for Distribution in February 2026 to unify DER management, network modeling, and real-time operations as utilities look to retire siloed legacy systems.
Recent Industry Developments in Smart Utilities Management Market
- May 2026: Siemens announced the next generation of its Gridscale X platform, adding AI-driven capabilities aimed at improving transmission planning workflows. The release supports utilities and grid operators seeking faster planning cycles and more automated decision support as load volatility increases and grid constraints tighten.
- August 2025: Honeywell acquired SparkMeter's data platform and utility software technologies, including Praxis, GridScan, and GridFin, expanding its utility solutions portfolio. The deal strengthens Honeywell's position in grid analytics and software-led offerings, complementing broader utility digitization and operational visibility initiatives.
- May 2024: Honeywell launched an AI-enabled Honeywell Forge software solution focused on accelerating modernization of utility grid assets. By emphasizing analytics and asset performance insights, the platform adds momentum to software-centric procurement, where utilities prioritize operational intelligence and lifecycle optimization over point hardware upgrades.


Smart Utilities Management Market Report Scope and Research Methodology
Market Definition and Coverage
This market covers software, connected hardware, and related services that help electricity, water, and gas utilities collect usage and operational data, convert it into insights, and run smarter field and customer workflows through digital tools.
Scope exclusions: We exclude power generation equipment, standalone grid scale storage, and purely manual asset management services from this market sizing.
Segments Covered in This Report
- By Type
- Meter Data Management Systems
- Energy Monitoring / Management
- Smart Distribution Management
- Advanced Outage Management Systems
- By Component
- Hardware
- Software
- Services
- By Utility Type
- Electricity
- Water
- Gas
- By Deployment Mode
- On-Premise
- Cloud
- By Geography
- North America
- United States
- Canada
- Mexico
- Europe
- Germany
- United Kingdom
- France
- Italy
- Spain
- Rest of Europe
- Asia-Pacific
- China
- Japan
- India
- South Korea
- Australia and New Zealand
- Rest of Asia-Pacific
- South America
- Brazil
- Argentina
- Rest of South America
- Middle East and Africa
- Middle East
- Saudi Arabia
- United Arab Emirates
- Turkey
- Rest of Middle East
- Africa
- South Africa
- Egypt
- Nigeria
- Rest of Africa
- Middle East
- North America
Data Sources, Market Sizing, and Validation
Desk Research
Desk research was used to set the market structure and to build starting demand signals that can be checked across regions. We reviewed public sources such as the US Energy Information Administration, Eurostat, World Bank, IEA publications, and utility regulator websites to understand utility connections, grid investment themes, and digitalization priorities.
To avoid building the model on one data stream, we also scanned company annual reports, investor presentations, earnings call notes, and reputable press coverage for product mix, implementation themes, and pricing language. Where needed, we used paid subscriptions for company financial intelligence, patent lookups, and shipment level import-export signals to cross check adoption timing for metering and communications hardware. These examples are not exhaustive, and other public and paid references were used for data collection, validation, and clarification.
Primary Interviews and Surveys
Primary work focused on interviews and surveys with utility digital leaders, operations and outage teams, IT and OT managers, system integrators, and product specialists across the value chain. We used the inputs to confirm what gets budgeted as smart utilities management, how cloud migrations are paced, and how utilities split spend across software, hardware, and services across major regions.
Distribution of primary research fieldwork respondents
| Company type | Respondent position | Region |
|---|---|---|
| Top tier: 26% | CXOs: 17% | APAC: 45% |
| Mid tier: 57% | Functional/Unit leaders: 40% | EMEA: 37% |
| Smaller Players: 17% | Managers: 43% | Americas: 18% |
Market-Sizing & Forecasting
Sizing starts with a top-down build where utility counts, metering penetration, and digital operations rollout rates are translated into an addressable spend pool, then filtered by what portion typically sits inside smart utilities management programs. For sanity checks, the totals are corroborated with selective bottom-up approximations like sampled contract values, estimated installed base refresh cycles, and a few supplier and channel checks on average selling prices and deployment volumes.
Key model inputs include AMI and smart meter rollout pace, cloud versus on-premise mix, outage and distribution automation adoption, utility capex and opex digital allocation trends, and services intensity during multi year implementations. When primary inputs varied by region, we used scenario analysis (base, conservative, and accelerated) and then anchored the final forecast to the base case supported by the most consistent expert consensus. Where bottom-up checks were limited, for example missing disclosure on services revenue, we used ratio-based benchmarks discussed in interviews and adjusted for utility type differences.
Data Validation & Update Cycle
Outputs are validated through triangulation across independent signals, including utility digital spend direction, rollout timelines, and known adoption constraints in data integration and cybersecurity. Variances are reviewed in steps, starting with analyst level checks on unit math and currency conversions, followed by peer review on assumptions and regional splits, and then a final sign off after rechecking outliers.
The report is refreshed annually, and interim updates are triggered when material events occur, such as major regulation shifts, rapid utility investment changes, or step changes in cloud adoption. Before delivery, we complete a fresh pass on the latest public releases and re-contact selected experts if the new information shifts key variables.
Mordor Intelligence's Smart Utilities Management Reinventing the Utility Business Market Size Measured Against Other Published Estimates
Published market numbers for smart utilities management often do not match because each publisher draws the lines differently and also uses different demand signals to scale the model. Differences also show up when one estimate leans more on vendor revenue rollups, while another is driven by broader smart grid spending proxies.
Standalone grid scale energy storage sits outside Mordor Intelligence's scope for this market, and that single inclusion choice can shift totals upward in studies that bundle storage, transformers, or other grid hardware under the same headline. Gaps also come from how firms treat services, where some count wider consulting and managed operations, and from refresh timing, where currency conversion dates and late-year utility budget resets can move the current-year value.
Benchmark comparison
| Source | Market Size | Gaps in Research Methodology |
|---|---|---|
| Mordor Intelligence | USD 20.38 B (2026) | |
| Trade Publisher A | USD 52.86 B (2025) | Uses a broader smart utilities scope that rolls up a wide hardware stack and related services across smart meters, AMI, smart grid equipment, and even storage, so the addressable pool is larger than a management-focused definition. |
| Industry Portal B | USD 30.00 B (2025) | Uses a looser definition that can pull in adjacent digital utility technologies and automation bundles, and the base year references appear inconsistent, which makes like-for-like reconciliation harder. |
The comparison shows that the biggest spread comes from whether the estimate stays centered on management software, connected enablement hardware, and implementation services, or whether it expands into broader smart grid equipment and storage. By keeping variables tied to utility management adoption signals and then cross-checking totals with grounded contract and pricing checks, the resulting number stays easier to trace and repeat year to year.


Key Questions Answered in the Report
What is the current size of the smart utilities management market?
The market is valued at USD 20.38 billion in 2026 and is projected to rise to USD 41.84 billion by 2031.
Which component segment is growing fastest?
Services lead growth with a 15.95% CAGR because utilities increasingly outsource integration, cybersecurity, and analytics expertise.
Why are water utilities adopting smart platforms more quickly now?
Rising drought pressures, leakage penalties, and NB-IoT metering pilots—such as Cairns Regional Council’s program—are accelerating digital investment in the water segment.
How are government mandates influencing adoption?
National rollouts like Australia’s 2030 smart-meter deadline and the U.S. federal metering requirements create guaranteed demand, enabling scale efficiencies and faster deployments.
What role does edge computing play in utility modernization?
Edge AI embedded in meters or substations minimizes decision latency, cuts backhaul bandwidth by up to 90%, and supports real-time applications such as EV-charging orchestration.
Which region is expected to grow fastest through 2031?
Asia-Pacific is forecast to expand at a 15.72% CAGR, buoyed by China’s record grid investment and India’s large-scale transmission upgrades.
Page last updated on:


 Your data is secure and never sold or shared.


