
Technology, Media and Telecom
5th MayPricing Strategy for Semiconductor Components
3 Min Read
Smart Contracts Market Report Segments the Industry Into by Contract Type (Application Logic Contracts, Smart Legal Contract and More), Enterprise Size (Small and Medium Enterprises, Large Enterprises), Deployment Model (Public Permissionless Chains, Private Consortium Chains and More), End-User Industry (Retail & E-Commerce, BFSI and More), and by Geography. The Market Forecasts are Provided in Terms of Value (USD).
Market Overview
| Study Period | 2020 - 2031 |
|---|---|
| Market Size (2026) | USD 3.12 Billion |
| Market Size (2031) | USD 7.73 Billion |
| Growth Rate (2026 - 2031) | 19.92 % CAGR |
| Fastest Growing Market | Asia Pacific |
| Largest Market | North America |
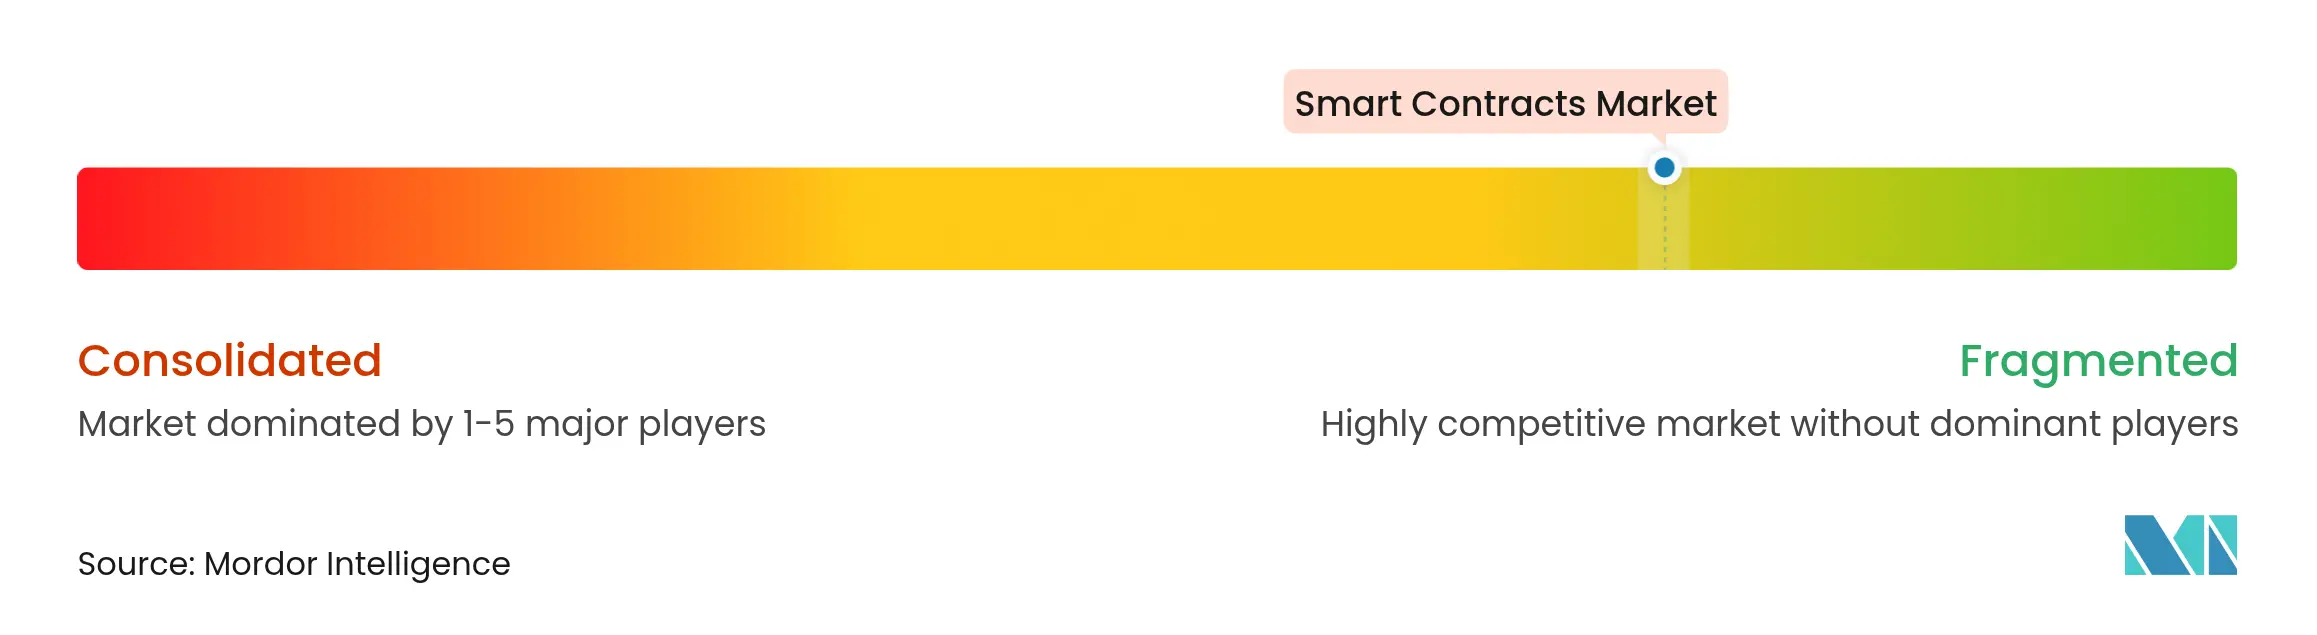
| Market Concentration | Low |
Major Players *Disclaimer: Major Players sorted in no particular order. Image © Mordor Intelligence. Reuse requires attribution under CC BY 4.0. |
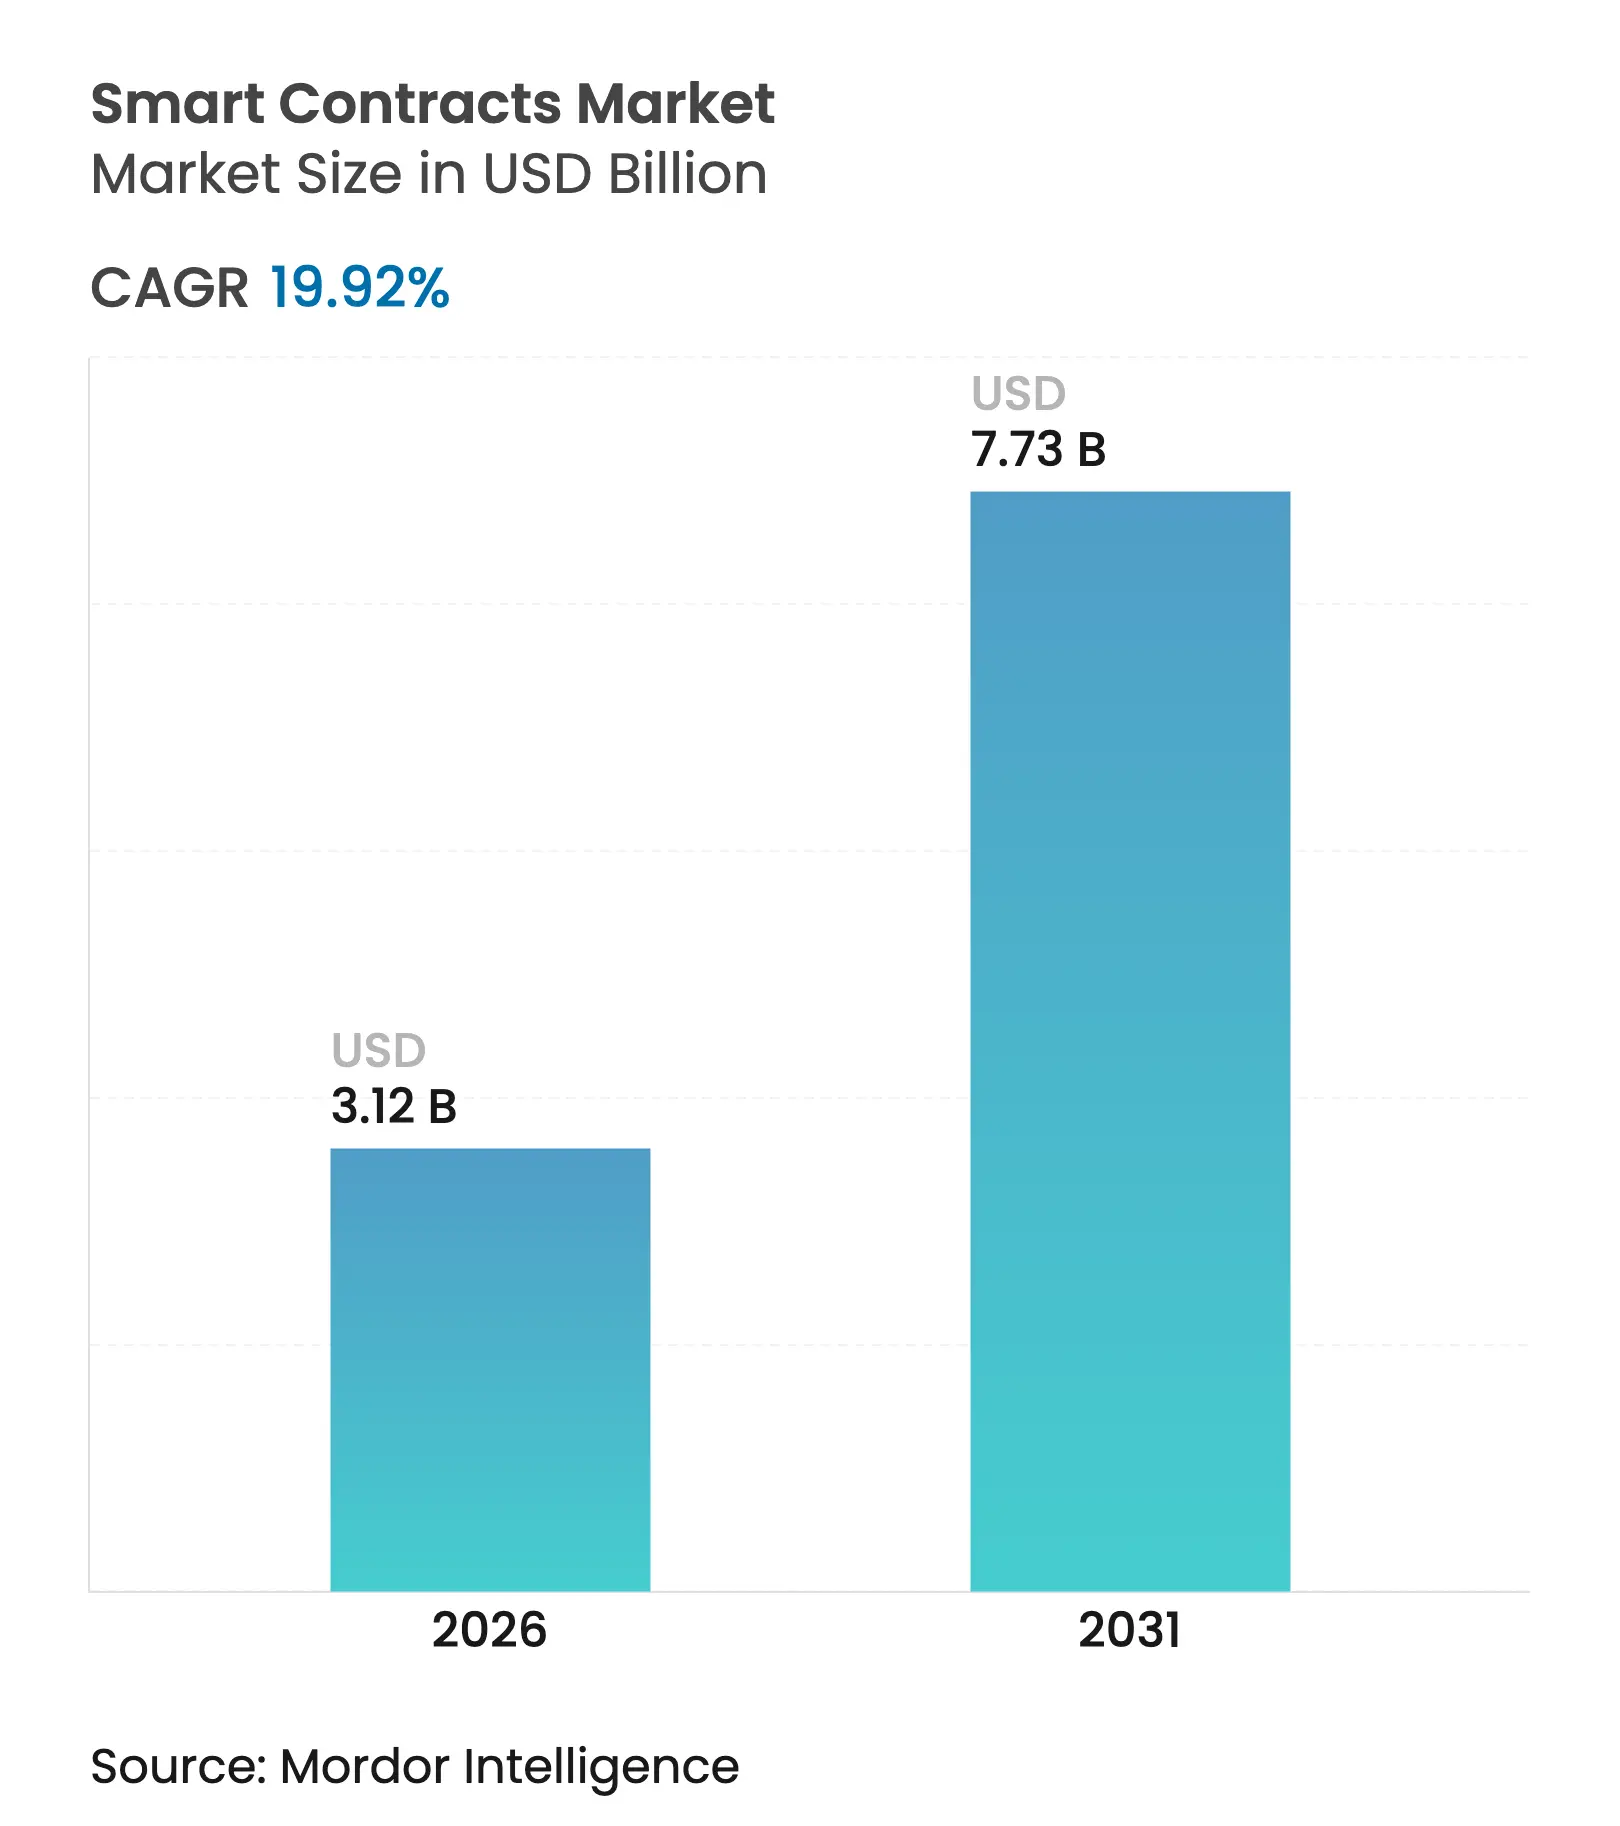
The smart contracts market size is expected to grow from USD 2.6 billion in 2025 to USD 3.12 billion in 2026 and is forecast to reach USD 7.73 billion by 2031 at 19.92% CAGR over 2026-2031. Mounting enterprise demand for automated, tamper-resistant workflows in banking, supply chains, and government services is moving the technology from proof-of-concept to core infrastructure. Large banks are running blockchain payment rails that clear high-value transfers in minutes, while multinational retailers pilot programmable stablecoins to shrink settlement windows and slash card fees. Interoperability protocols now link public and private ledgers, letting firms orchestrate multi-network transactions without the complexity that once stalled roll-outs. Parallel advances in formal verification, post-quantum encryption, and green consensus mechanisms further widen use cases and lower perceived risk for conservative sectors such as healthcare and utilities.
Regulatory clarity is another accelerant. The European Union’s Markets in Crypto-Assets (MiCA) framework and Wyoming’s forthcoming state-issued stable token give institutions a template for compliant deployment, trimming project lead times. Meanwhile, tokenization of real-world assets—from property deeds to carbon credits—offers fresh revenue pools that entice software vendors, auditors, and custodians to build complementary services, reinforcing the smart contracts market’s network effects.
Key Report Takeaways
Note: Market size and forecast figures in this report are generated using Mordor Intelligence's proprietary estimation framework, updated with the latest available data and insights as of 2026.
Drivers Impact Analysis
| Driver | (~) % Impact on CAGR Forecast | Geographic Relevance | Impact Timeline | |||
|---|---|---|---|---|---|---|
Rapid enterprise blockchain adoption
Rapid enterprise blockchain adoption
| +4.2% | North America, Asia-Pacific | Medium term (2–4 years) |
(~) % Impact on CAGR Forecast
:
+4.2%
|
Geographic Relevance
:
North America, Asia-Pacific
|
Impact Timeline
:
Medium term (2–4 years)
|
BFSI demand for secure automation
BFSI demand for secure automation
| +3.8% | Global financial hubs | Short term (≤ 2 years) | |||
Intermediary cost-out benefits
Intermediary cost-out benefits
| +3.1% | Emerging and developed markets | Medium term (2–4 years) | |||
Tokenization of real-world assets
Tokenization of real-world assets
| +2.9% | Europe, North America, Middle East | Long term (≥ 4 years) | |||
Maturation of formal verification tools
Maturation of formal verification tools
| +2.2% | Developed markets | Medium term (2–4 years) | |||
ESG-driven green blockchains
ESG-driven green blockchains
| +1.8% | Europe, North America | Long term (≥ 4 years) | |||
| Source: Mordor Intelligence | ||||||
Rapid Enterprise Blockchain Adoption
Production-grade deployments are rising as firms view smart contracts as mission-critical automation layers rather than experimental code. General Electric now tracks aerospace parts across continents on a permissioned ledger, automatically releasing payments once quality sensors confirm compliance, cutting reconciliation cycles from weeks to hours. In Asia, the Asian Development Bank’s Project Tridecagon links 13 national payment systems, letting member banks settle cross-border bond trades via smart contracts in near real time.[1]Asian Development Bank, “Project Tridecagon,” cbpn.currencyresearch.com Each new enterprise network increases interconnectivity and raises the overall smart contracts market ceiling.
BFSI Demand for Secure Automation
Banks and insurers replace multi-step, paper-heavy tasks with programmable finance rails. Citi’s token-based trade finance platform embeds regulatory checks into code, slashing document processing costs while satisfying multijurisdiction compliance rules.[2]Citi, “Token Services Platform,” citigroup.com Oracle services feed market data directly into contracts, letting custodians reconcile corporate actions in minutes instead of days. This secure automation propels adoption among risk-averse financial incumbents.
Intermediary Cost-Out Benefits
Smart contracts remove escrow agents, customs brokers, and manual verifiers. Chilean ports use blockchain cargo manifests that auto-release bills of lading once IoT sensors log container arrival, dropping administrative overhead by double-digit percentages. Lower friction expands margins for shippers and exporters, fueling broader roll-outs across commodity supply chains.
Tokenization of Real-World Assets
Regulated token offerings translate property, bonds, and even fine art into on-chain units that settle instantly and fractionalize ownership. Dubai’s Land Department is piloting blockchain title deeds targeting AED 60 billion (USD 16.3 billion) tokenized real estate by 2033.[3]Dubai Land Department, “Tokenization Pilot for Property Title Deeds,” dubailand.gov.ae Asset managers foresee multi-trillion-dollar liquidity migrating on-chain, swelling the smart contracts market for custody, valuation, and compliance services.
Restraints Impact Analysis
| Restraint | (~) % Impact on CAGR Forecast | Geographic Relevance | Impact Timeline | |||
|---|---|---|---|---|---|---|
Talent shortage in Solidity/Rust
Talent shortage in Solidity/Rust
| −2.4% | Emerging markets most acute | Short term (≤ 2 years) | (~) % Impact on CAGR Forecast:
−2.4%
|
Geographic Relevance
:
Emerging markets most acute
|
Impact Timeline
:
Short term (≤ 2 years)
|
Patchy regulatory alignment
Patchy regulatory alignment
| −1.9% | Global | Medium term (2–4 years) | |||
Quantum-threat to current cryptography
Quantum-threat to current cryptography
| −1.1% | High-security sectors | Long term (≥ 4 years) | |||
Legal-code immutability conflicts
Legal-code immutability conflicts
| −0.8% | Federal legal systems | Long term (≥ 4 years) | |||
| Source: Mordor Intelligence | ||||||
Talent Shortage in Smart-Contract Languages
Demand for audit-grade Solidity and Rust developers far outstrips supply. Specialized recruiters report vacancies remaining open for six months or more, inflating project costs and delaying launches. Upskilling initiatives exist, yet growth in use cases continues to outpace workforce expansion, limiting the short-term smart contracts market trajectory.
Regulatory Ambiguity Persists
Global firms must reconcile diverging token-classification rules. While MiCA offers certainty in the EU, cross-border projects still juggle overlapping securities, tax, and consumer-protection statutes. Wyoming’s state stable token illustrates progress, but federal adoption remains uncertain, and similar gaps appear across Asia and Africa.[4]QuillAudits, “Smart Contract Security Tools Guide,” quillaudits.com This complexity raises legal costs and tempers deployment velocity.
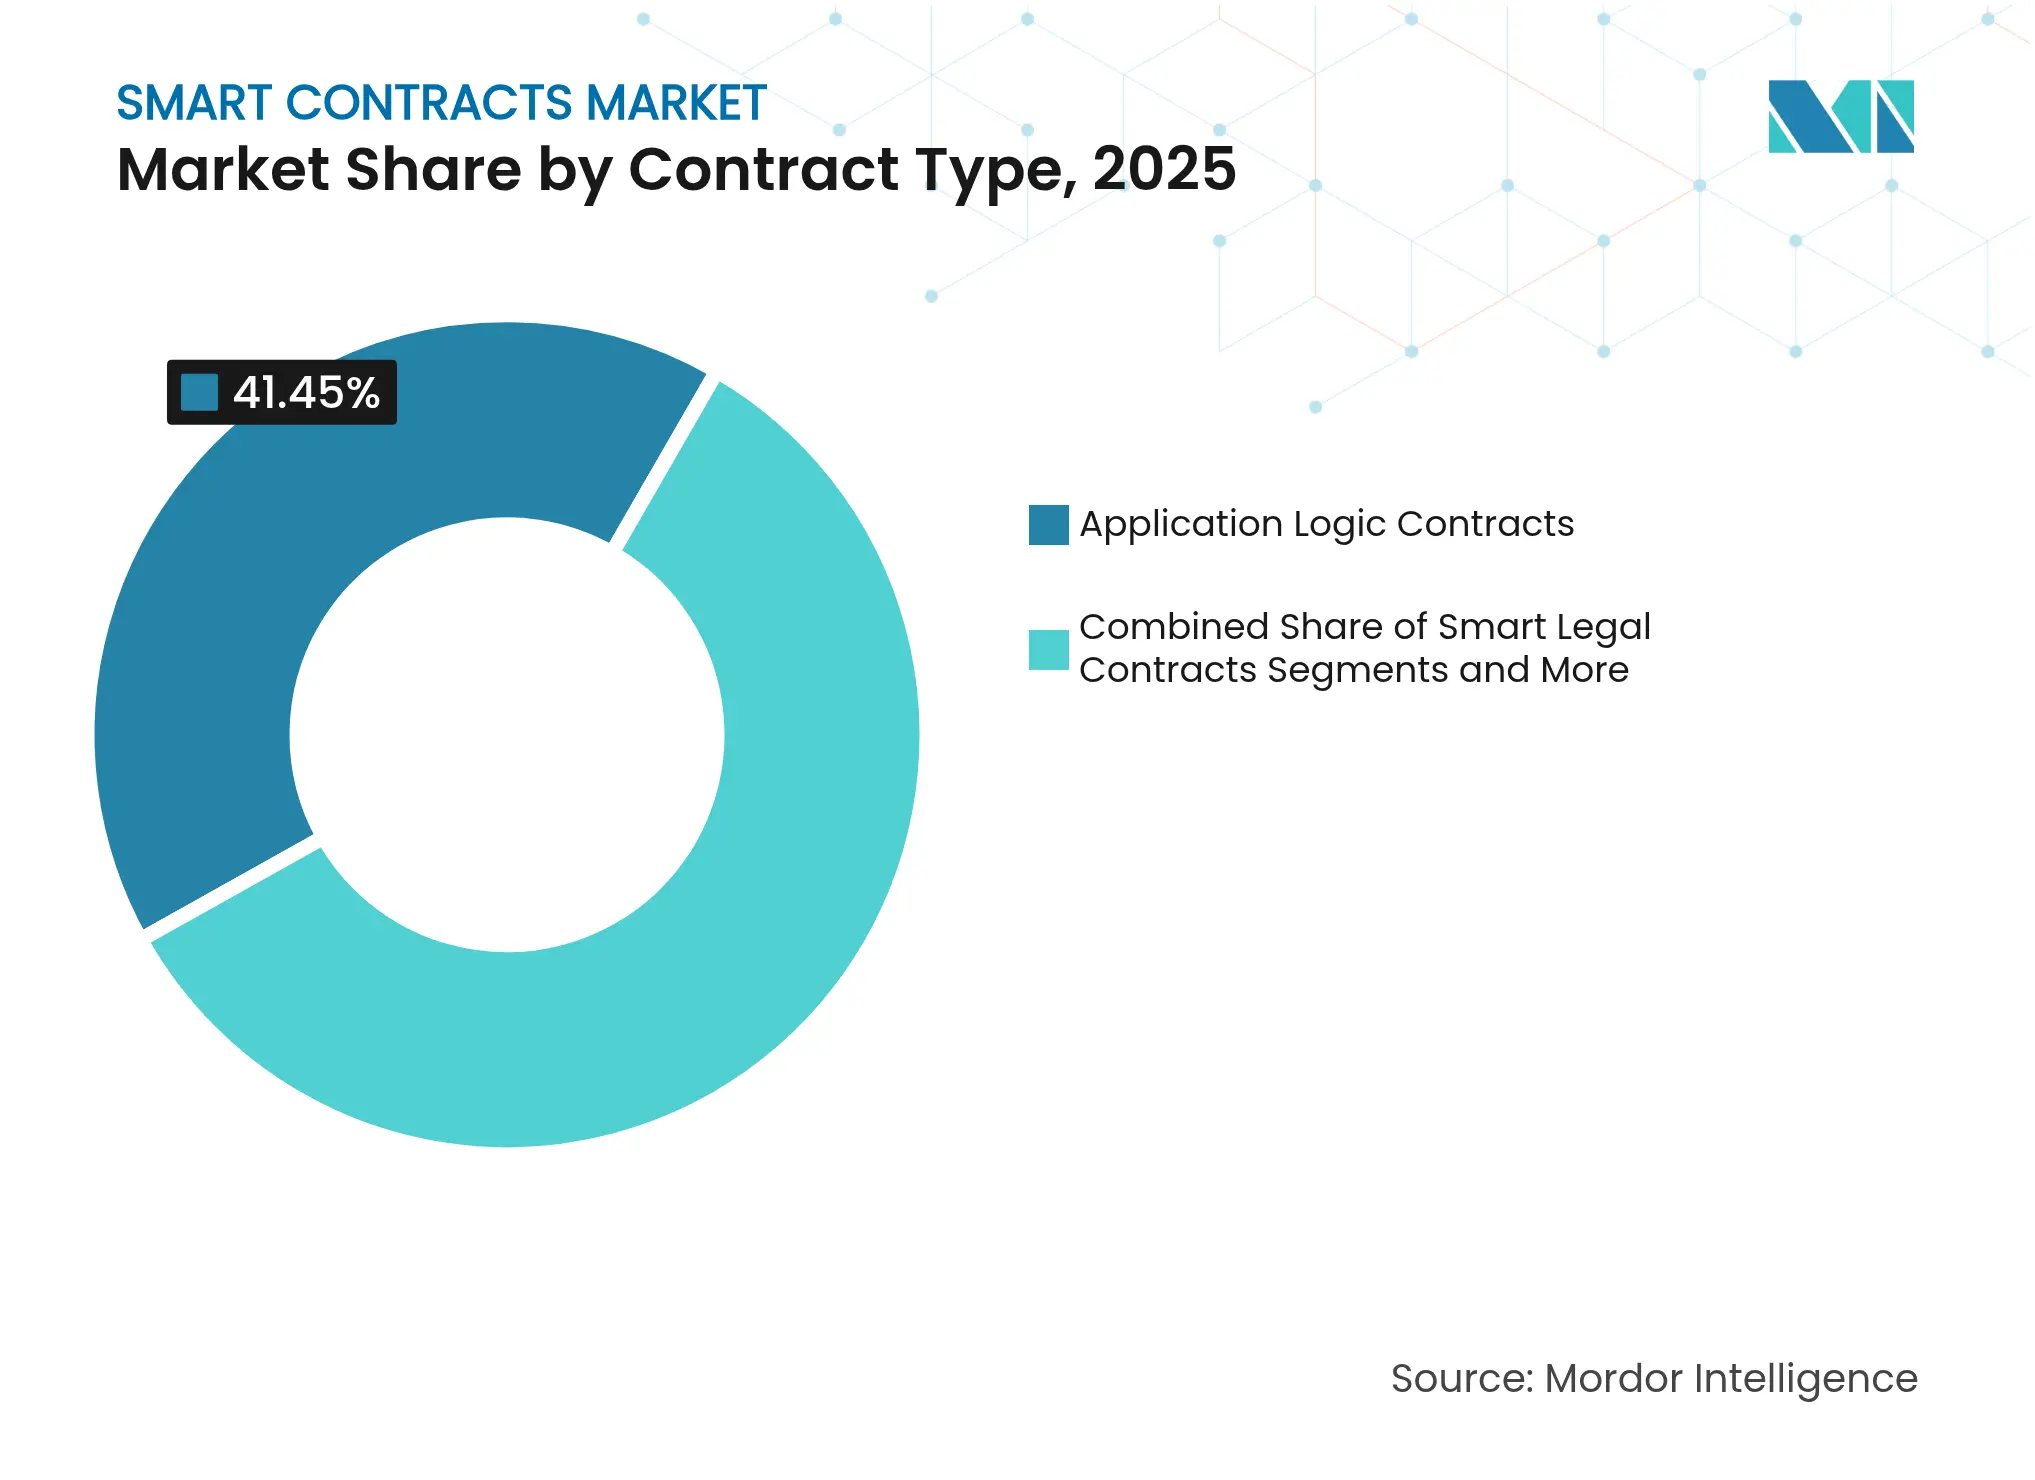
By Contract Type: Application Logic Dominates While DAOs Accelerate
Application Logic Contracts accounted for 41.45% of 2025 revenue, embedding multi-party rules that run escrow, invoicing, and compliance workflows. The segment’s smart contracts market size is projected to hit USD 3.05 billion by 2031. Enterprises prefer this contract type for its flexibility and integration hooks into legacy systems. Smart Legal Contracts are gaining traction as courts begin recognizing code-as-law clauses, though jurisdictional recognition remains uneven.
Decentralized Autonomous Organizations are the breakout performer, set to post a 30.24% CAGR to 2031. Corporate pilots blend token-based voting with traditional governance, letting shareholders ratify budget allocations in minutes. The Artificial Superintelligence Alliance merger showcased how DAOs pool treasuries and manage intellectual property without central boards. Rising demand for agile, community-driven governance positions this contract subtype as a prime growth lever inside the broader smart contracts market.
Note: Segment shares of all individual segments available upon report purchase
By Deployment Model: Layer-2 Solutions Outpace Layer-1 incumbents
Public, permissionless Layer-1 chains retained 45.90% revenue in 2025 thanks to hardened security and vast developer tooling. Yet congestion fees prompt enterprises to explore Layer-2 networks that compress hundreds of transactions into a single proof. The Layer-2 segment’s smart contracts market share is forecast to rise 10.4 percentage points by 2031 as optimistic and zero-knowledge rollups gain institutional endorsements.
Consortium blockchains still anchor privacy-sensitive processes in healthcare and defense, but interoperability bridges now let firms settle transactions across Layer-1, Layer-2, and private ledgers. Sony’s commitment to a high-throughput rollup for loyalty points validates the performance gains that Layer-2 offers without sacrificing Ethereum compatibility.
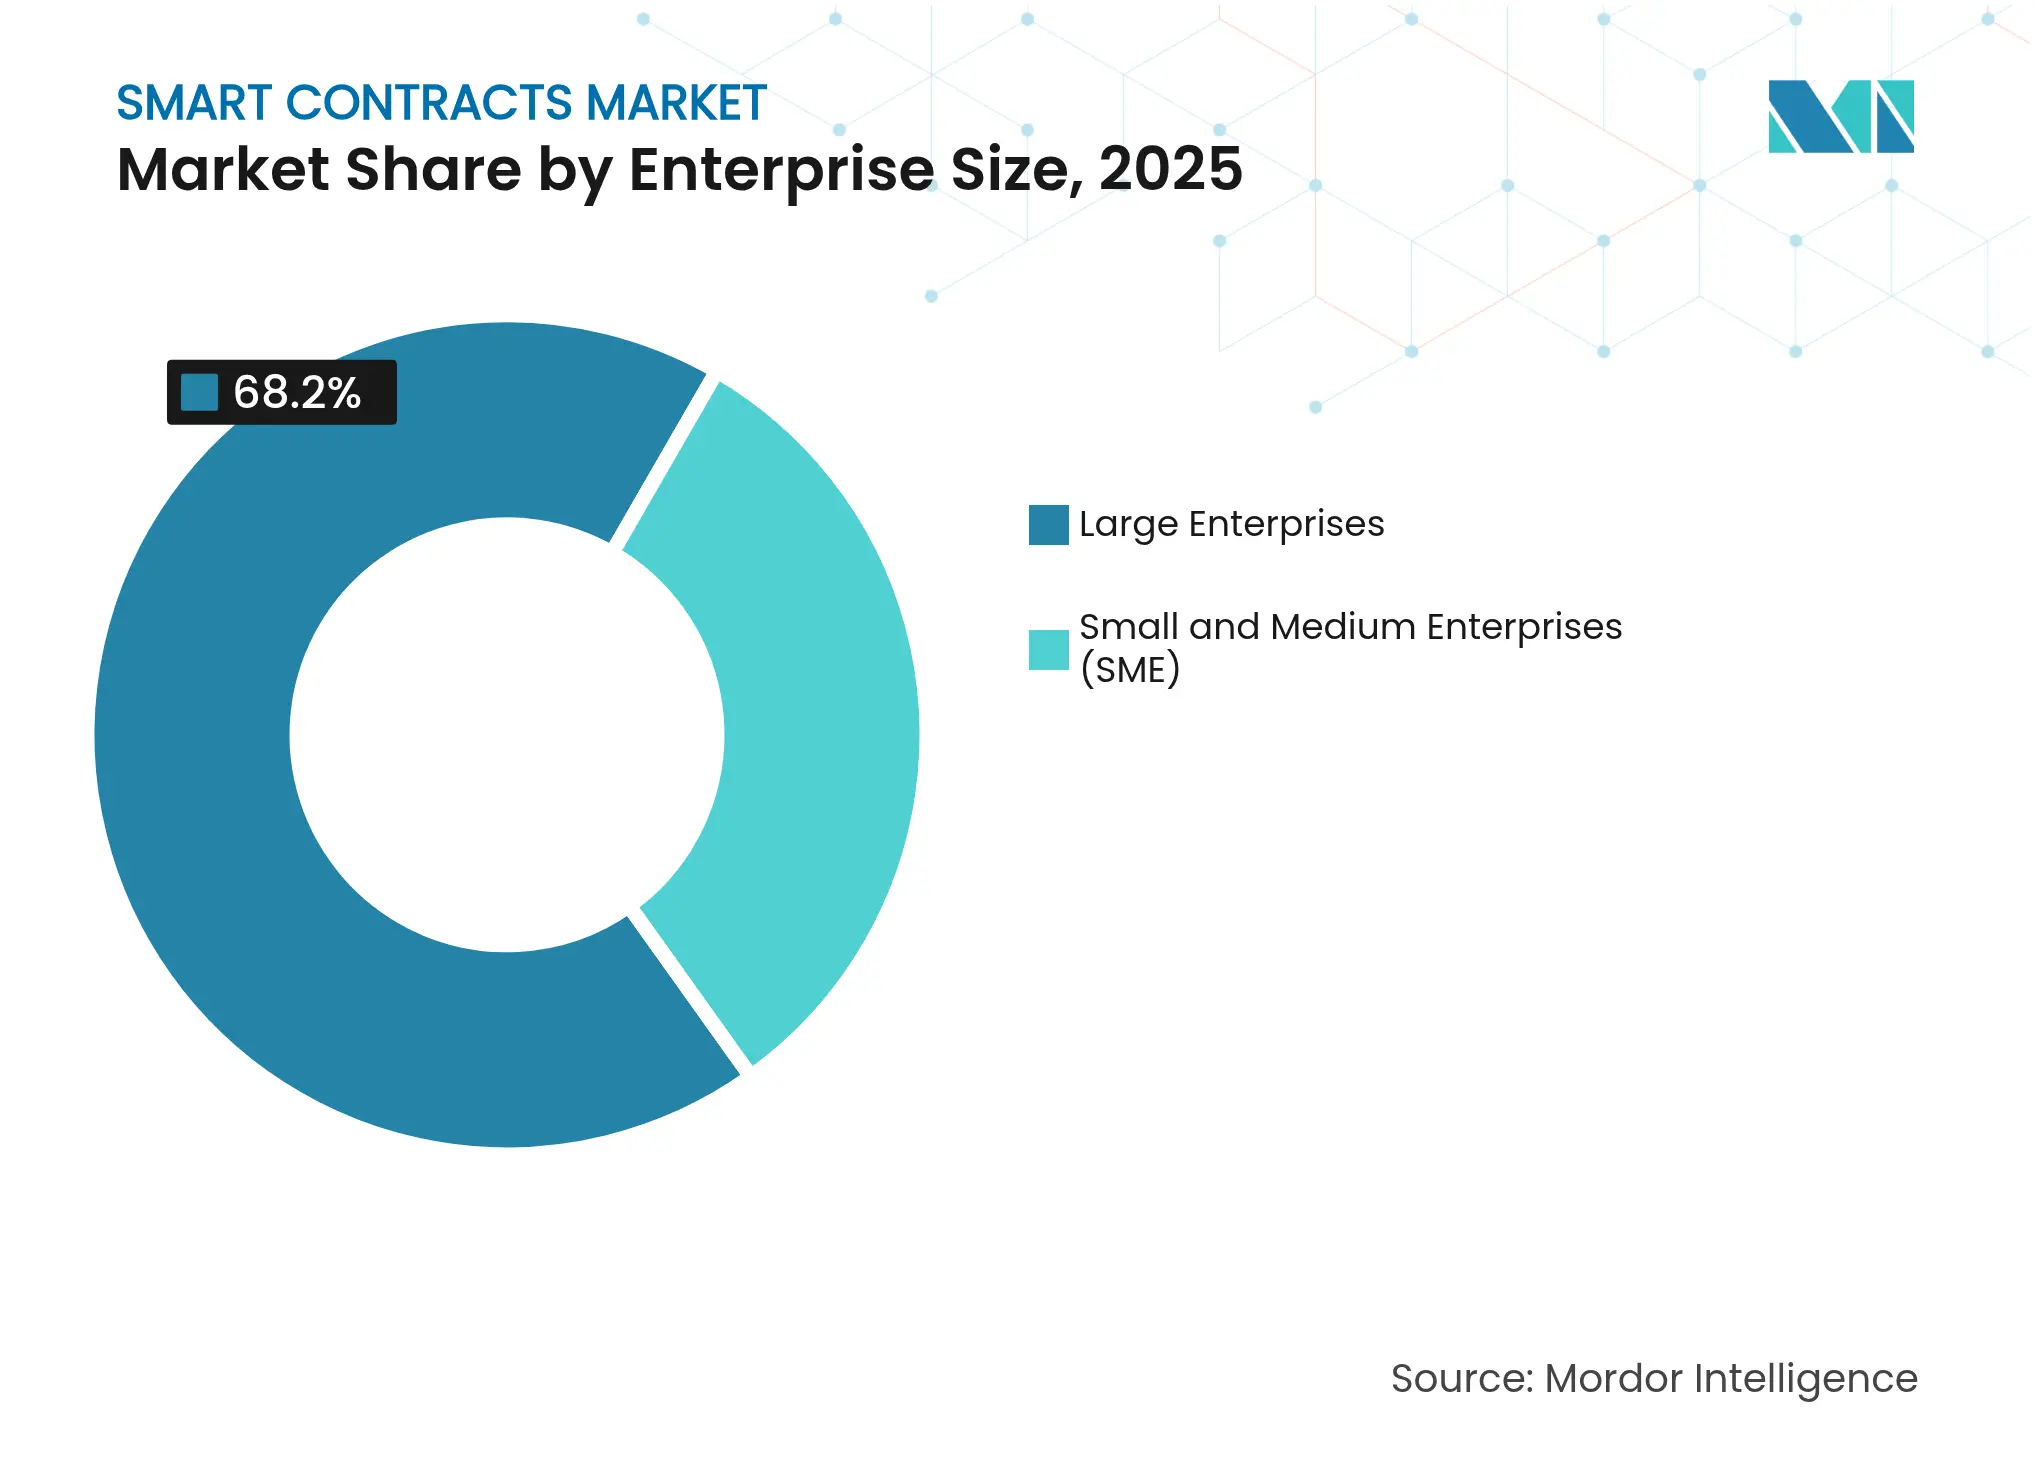
By Enterprise Size: SME Uptake Narrows the Gap
Large corporations held 68.20% of 2025 spending, yet SME adoption is the fastest-moving segment at 27.3% CAGR to 2031. Plug-and-play platforms translate complex Solidity code into drag-and-drop workflows, cutting entry costs. Coinbase Institute research shows automated receivables and collateral monitoring help small exporters secure cheaper working capital, making blockchain a practical finance tool rather than speculative add-on.
Note: Segment shares of all individual segments available upon report purchase
By End-User Industry: Gaming Leads Growth Curve
The BFSI vertical, with 26.60% revenue share, remains the anchor tenant, but Gaming and Entertainment is slated for a 28.1% CAGR as in-game assets, tournament payouts, and royalty splits migrate on-chain. Cross-platform non-fungible tokens boost player retention while revenue distribution happens transparently via smart contracts. Real Estate tokenization initiatives from Dubai to Toronto demonstrate parallel momentum in traditional asset classes, widening the total smart contracts market size under management.
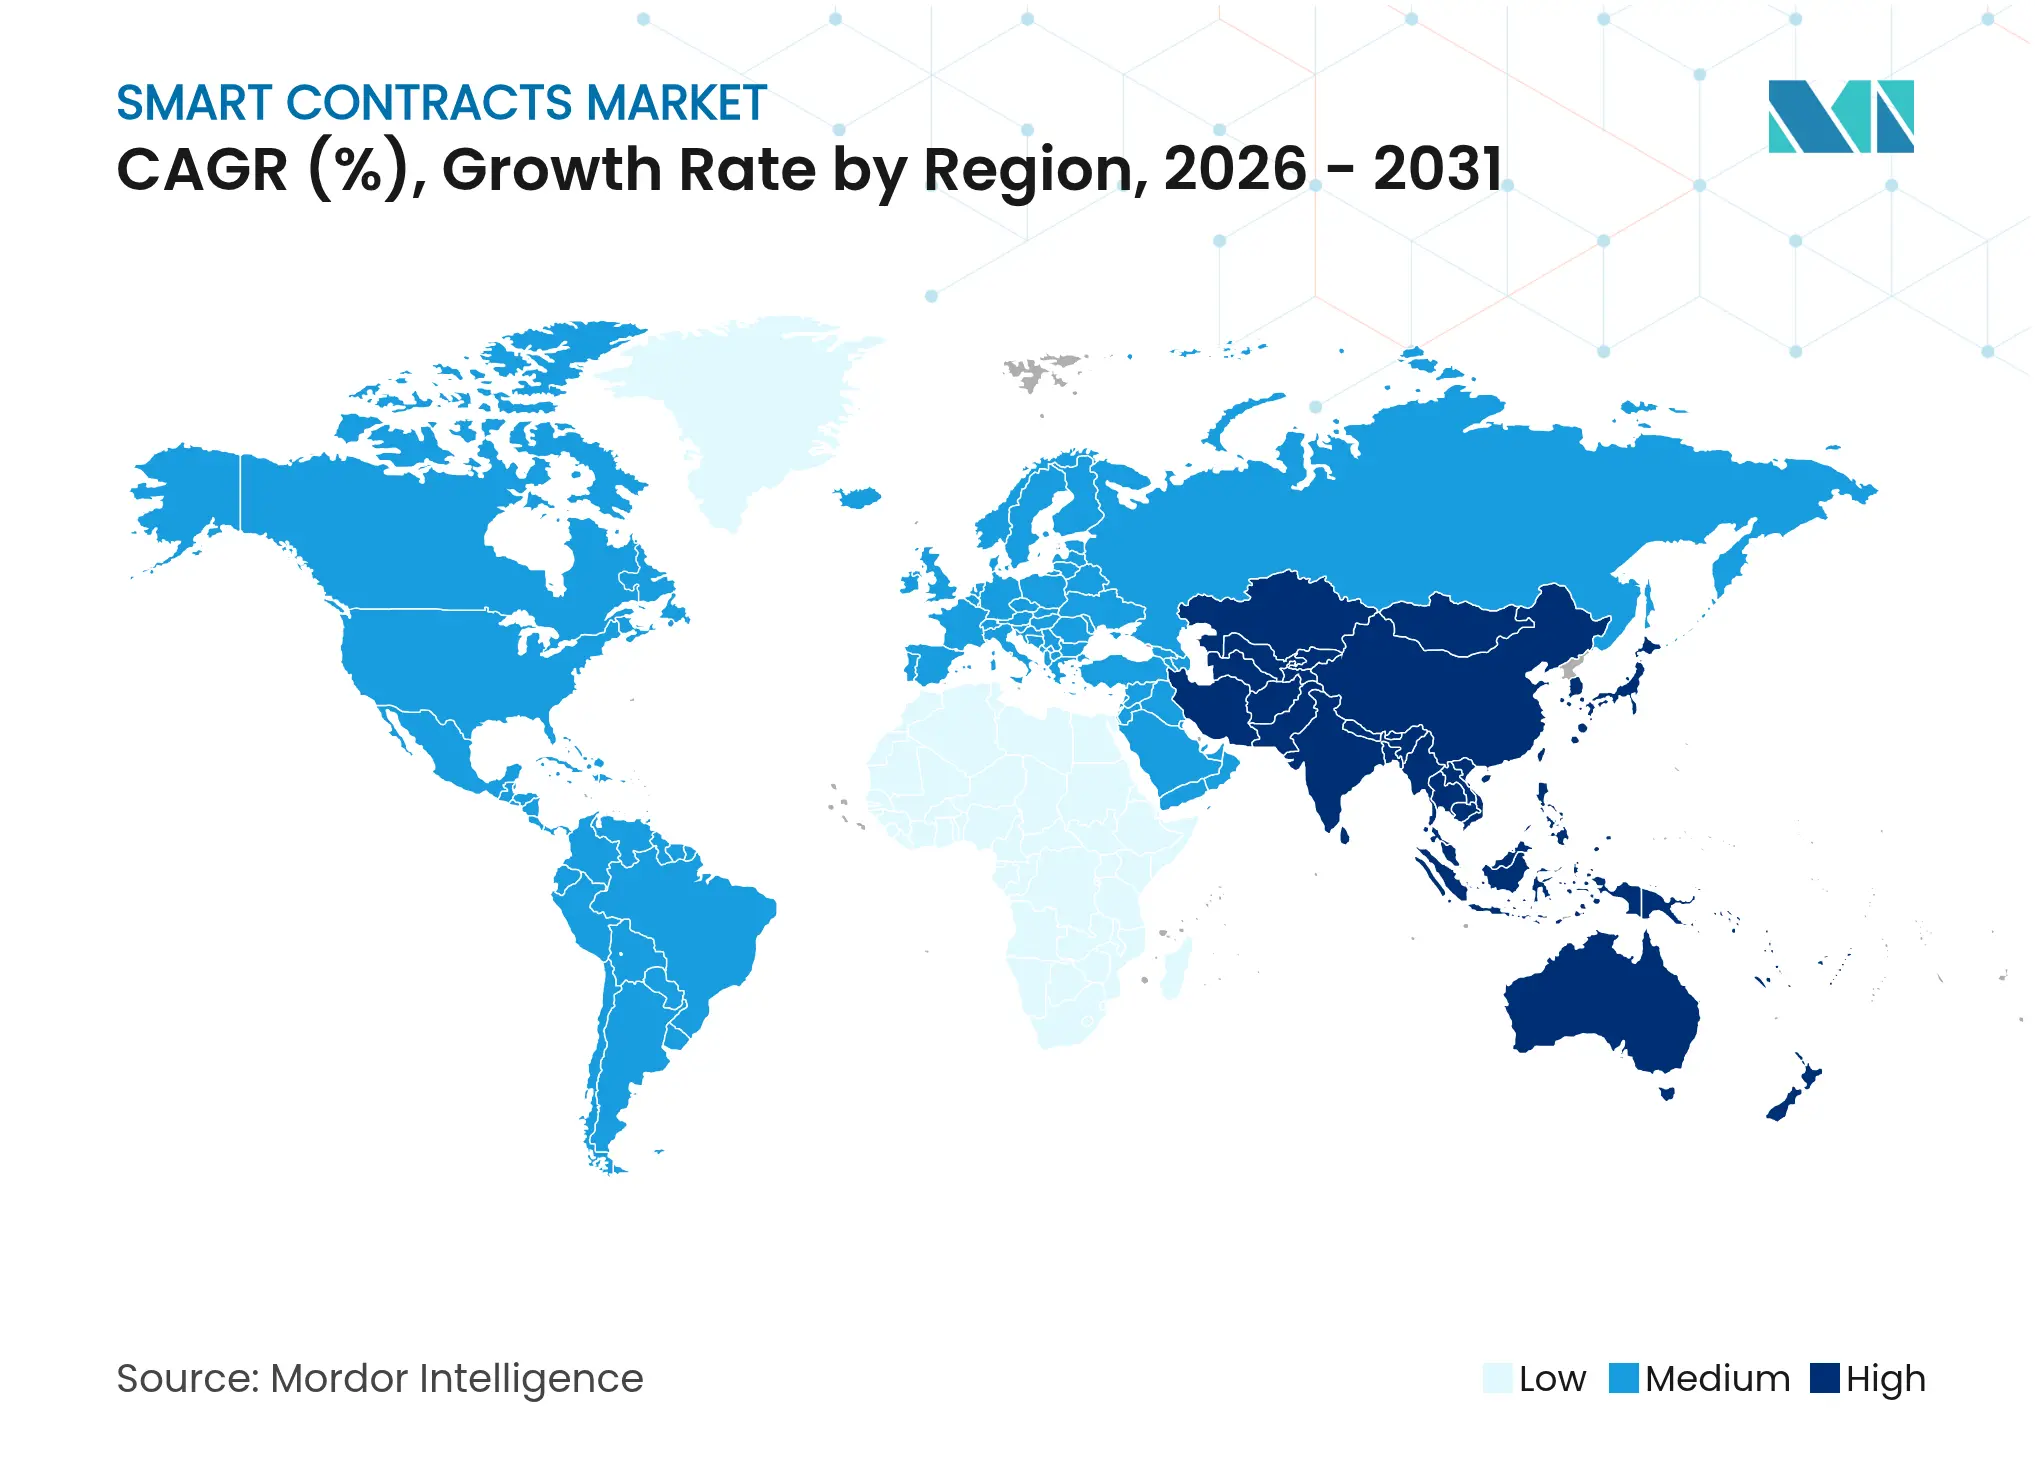
North American enterprises led initial scaling, but regulatory sandboxes in multiple U.S. states continue to foster experimentation. Canada’s USD 300 million on-chain residential-development deal underscores institutional confidence in tokenized real estate. The region’s 2026-2031 CAGR is expected to moderate to low-double digits as the market approaches early maturity, yet new niches such as post-quantum smart contracts and decentralized identity keep the pipeline robust.
Asia-Pacific posts the steepest growth curve. Japan’s thorough listing requirements and active blockchain partnerships from Sony and Fujitsu draw developer ecosystems that shorten product-to-market cycles. Singapore’s Monetary Authority provides clarity on stablecoin issuance and custodial duties, incentivizing regional banks to integrate smart-contract clearing for invoice financing. The Asian Development Bank’s Tridecagon network could displace legacy correspondent banking for ASEAN+3 trade, adding volume to the smart contracts market every time a cross-border invoice token hits the ledger.
Europe advances on the back of MiCA’s unified rulebook. Pilot use cases include the European Blockchain Service Infrastructure’s notarization services and member-state land registries ported to public ledgers. Middle East initiatives focus on property and carbon-credit tokenization, with Dubai aiming for AED 60 billion tokenized deeds by 2033. Africa and South America leverage blockchain to streamline remittances and identity verification, positioning emerging economies as long-tail growth contributors.
Market Concentration
The competitive field blends tech titans, specialist protocol teams, and cybersecurity boutiques. IBM, Microsoft, and Amazon Web Services fold managed blockchain modules into cloud suites, using pre-existing sales channels to win regulated industries. ConsenSys and Chainlink Labs dominate tooling and oracle middleware, licensing to both public networks and private consortiums. EY’s OpsChain platform confirms that professional-services firms see blockchain as a long-term revenue pillar despite earlier hesitancy.
Strategic consolidation is shaping market concentration. Merger activity, such as the Artificial Superintelligence Alliance, combines treasuries and developer communities at scale. Security remains a differentiation wedge; CertiK’s automated audits and Blockaid’s threat intelligence position them as gatekeepers for high-value deployments. Forward-looking vendors invest in quantum-resistant cryptography and ESG-compliant consensus, seeking early-mover advantage in the next evolution of the smart contracts market.

*Disclaimer: Major Players sorted in no particular order
1. INTRODUCTION
2. RESEARCH METHODOLOGY
3. EXECUTIVE SUMMARY
4. MARKET LANDSCAPE
5. MARKET SIZE AND GROWTH FORECASTS
6. COMPETITIVE LANDSCAPE
7. MARKET OPPORTUNITIES AND FUTURE OUTLOOK
Market Definitions and Key Coverage
Segmentation Overview
Detailed Research Methodology and Data Validation
Primary Research
Desk Research
Market-Sizing & Forecasting
Data Validation & Update Cycle
Why Our Smart Contracts Baseline Earns Strong Reliance
Benchmark comparison
| Market Size | Anonymized source | Primary gap driver | ||
|---|---|---|---|---|
USD 2.60 B (2025) | Mordor Intelligence | - | Anonymized source:Mordor Intelligence | Primary gap driver:- |
USD 2.69 B (2025) | Global Consultancy A | Includes unbundled advisory services; limited bottom-up cross-check | ||
USD 2.63 B (2024) | Industry Association B | Uses one-off survey, excludes layer-2 roll-ups, currency fixed at 2023 average |
Pricing Strategy for Semiconductor Components
3 Min Read
Accelerating Additive Manufacturing Adoption in India
3 Min Read
Wealth Management Intelligence for the Middle East
4 Min Read
When decisions matter, industry leaders turn to our analysts. Let’s talk.