Smart Power Market Size and Share
Market Overview
| Study Period | 2020 - 2031 |
|---|---|
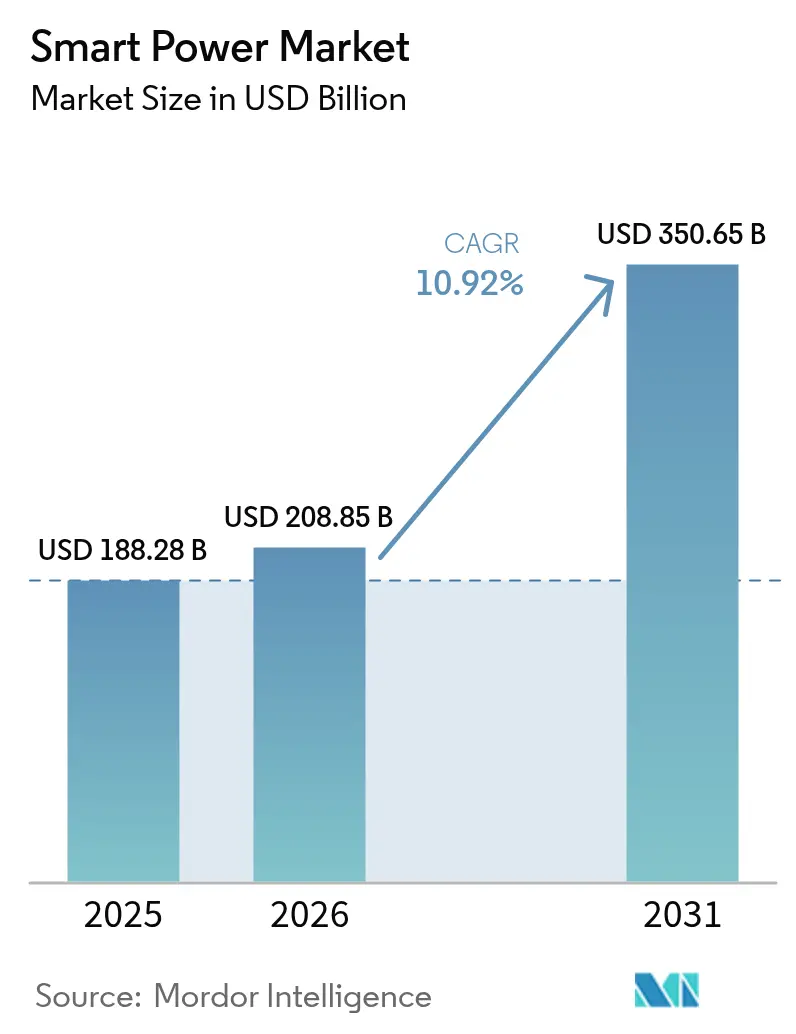
| Market Size (2026) | USD 208.85 Billion |
| Market Size (2031) | USD 350.65 Billion |
| Growth Rate (2026 - 2031) | 10.92% CAGR |
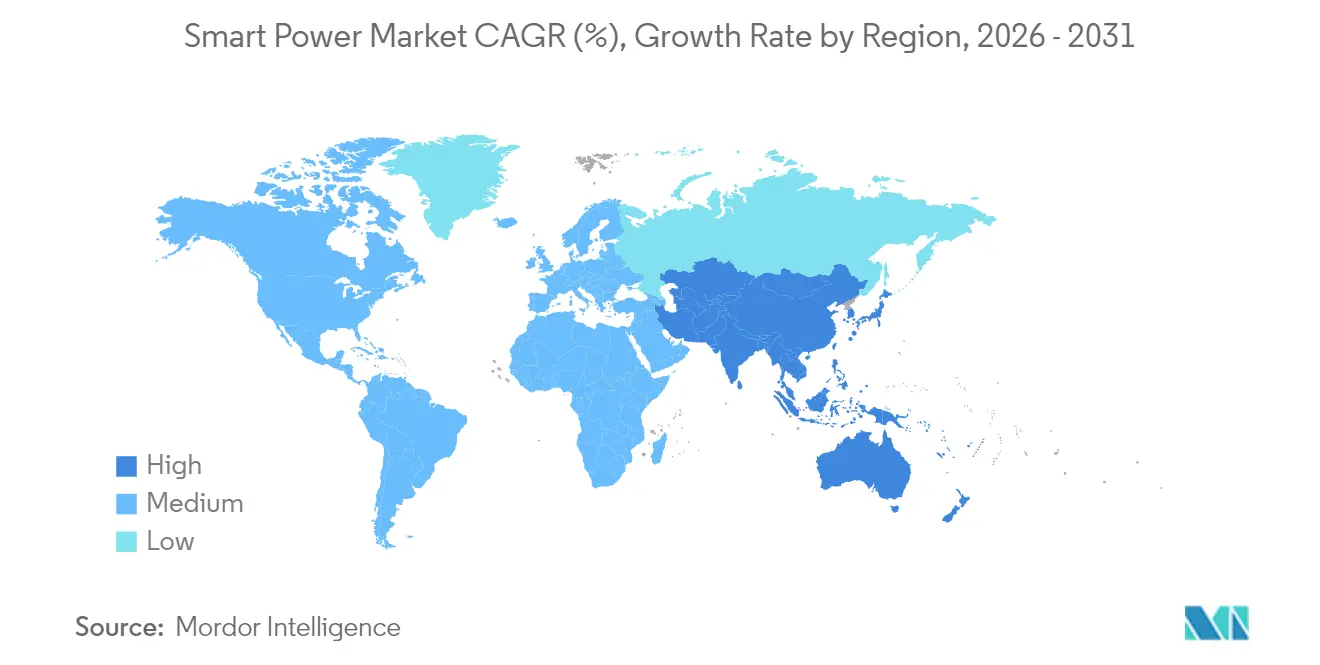
| Fastest Growing Market | Asia Pacific |
| Largest Market | Asia Pacific |
| Market Concentration | Medium |
Major Players *Disclaimer: Major Players sorted in no particular order Image © Mordor Intelligence. Reuse requires attribution under CC BY 4.0. | |
Smart Power Market Analysis by Mordor Intelligence
The smart power market size is expected to grow from USD 188.28 billion in 2025 to USD 208.85 billion in 2026 and is forecast to reach USD 350.65 billion by 2031 at 10.92% CAGR over 2026-2031. Heightened electrification of transportation, rapid grid digitalization, and the miniaturization of power electronics into consumer devices collectively drive demand. Wide-bandgap semiconductors replace legacy silicon in automotive inverters and fast chargers, while Qi2 wireless charging is scaling from wearables to laptops. Utilities deploy distributed energy resources that need intelligent power modules, and governments on three continents subsidize local semiconductor fabrication. Together, these forces sustain double-digit revenue expansion for component makers, system integrators, and energy service providers, even as price pressure persists in lower tiers of the consumer hardware chain.[1]International Energy Agency, “Digitalization and Energy 2024,” iea.org.
Key Report Takeaways
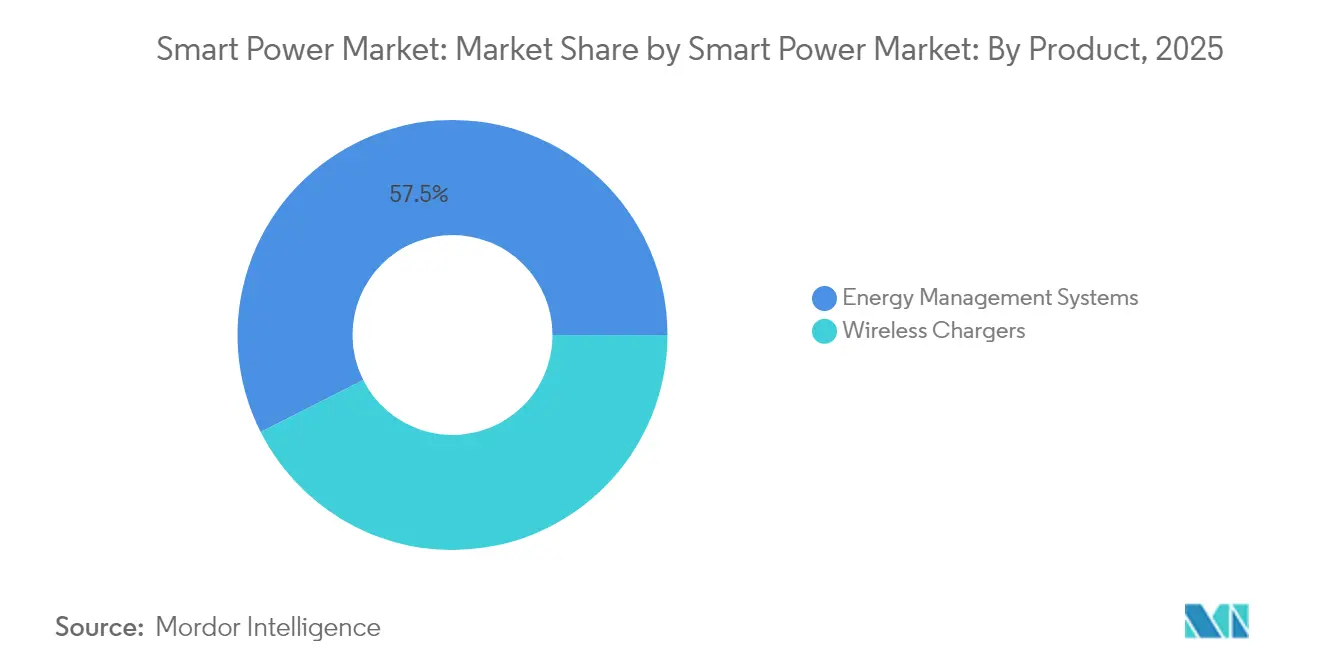
- By product, wireless chargers led with 42.55% revenue share in 2025; energy management systems are forecast to expand at a 12.05% CAGR through 2031.
- By technology, inductive and magnetic resonance held 54.60% of the smart power market share in 2025, while wide-bandgap power electronics are projected to grow at a 14.10% CAGR through 2031.
- By application, consumer electronics accounted for 47.55% of the smart power market size in 2025, while automotive and e-mobility are projected to advance at a 14.75% CAGR through 2031.
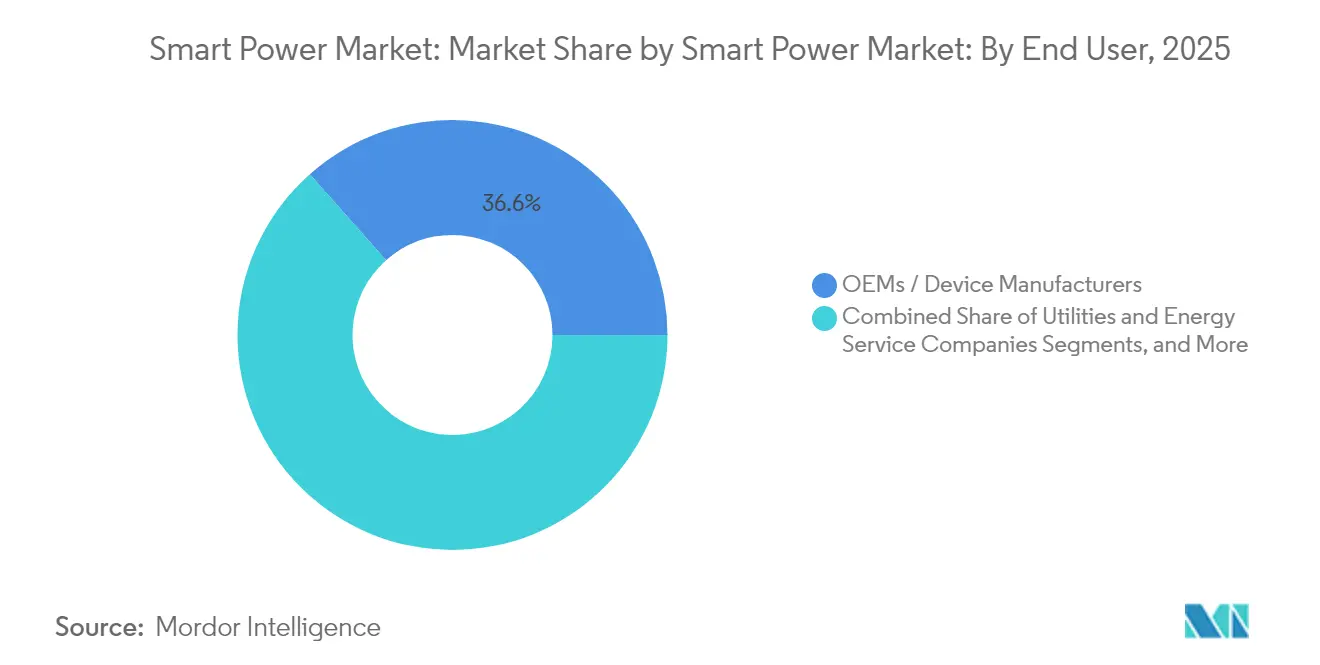
- By end user, OEMs and device manufacturers accounted for 36.55% of revenue in 2025, whereas utilities and energy service companies are projected to post a 13.85% CAGR from 2026 to 2031.
- By power device type, power management ICs captured a 45.40% share in 2025; smart power modules are expected to expand at a 11.75% CAGR over the forecast horizon.
- By geography, Asia Pacific held 37.80% of revenue in 2025 and is growing at a 12.25% CAGR through 2031.
Note: Market size and forecast figures in this report are generated using Mordor Intelligence’s proprietary estimation framework, updated with the latest available data and insights as of 2026.
Global Smart Power Market Trends and Insights
Drivers Impact Analysis*
| Driver | (~) % Impact on CAGR Forecast | Geographic Relevance | Impact Timeline |
|---|---|---|---|
| Rising adoption of wireless charging in consumer electronics | +2.1% | Global with focus in North America, Europe, Asia Pacific | Medium term (2-4 years) |
| Proliferation of power management ICs in 5G smartphones and IoT devices | +1.8% | Asia Pacific core, spillover to North America and Europe | Short term (≤ 2 years) |
| Rapid growth of electric vehicles requiring high-efficiency power electronics | +2.3% | Global, led by China, Europe, North America | Long term (≥ 4 years) |
| Government incentives for smart grid modernization | +1.9% | North America, Europe, select Asia Pacific markets | Medium term (2-4 years) |
| Integration of smart power modules into modular furniture | +0.7% | North America and Europe | Medium term (2-4 years) |
| AI-enhanced power management algorithms reducing standby losses | +0.9% | Global, early in data centers and smart buildings | Short term (≤ 2 years) |
| Source: Mordor Intelligence | |||
Rising Adoption of Wireless Charging in Consumer Electronics
Qi2 certification in early 2024 reduced magnetic misalignment losses below 5%, a milestone that made 15-watt inductive pads practical for tablets and laptops. Apple and Samsung shipped more than 250 million Qi2-enabled phones in 2024, catalyzing a USD 4 billion accessory ecosystem. Automakers followed, adding in-cab charging pads that curb cable wear and accent premium interiors. Hotel groups are embedding Qi2 modules in approximately half a million guest rooms by 2026 to enhance convenience and reduce maintenance costs. The switch away from wired ports also supports sealed, water-resistant designs for industrial IoT devices, boosting unit demand in harsh-environment segments.[2]Wireless Power Consortium, “Qi2 Specification Release,” wirelesspowerconsortium.com.
Proliferation of Power Management ICs in 5G Smartphones and IoT Devices
Standalone 5G networks double the number of power amplifiers per phone, lifting PMIC die area and value content. Flagship chipsets that shipped in late 2024 incorporate dynamic voltage scaling, which saves 25% of battery life, driving adoption across mid-range tiers in 2025. IoT edge nodes, forecast to reach 30 billion units by 2030, require a sub-1-microamp sleep current, prompting semiconductor manufacturers to develop nanowatt converters. India earmarked USD 2 billion to localize PMIC fabrication, shortening supply chains for regional handset brands. Safety standard IEC 62368-1 tightens fault protection rules, sending more control functions inside the PMIC and raising the bill-of-materials value.[3]Texas Instruments, “BQ25180 Product Announcement,” ti.com.
Rapid Growth of Electric Vehicles Requiring High-Efficiency Power Electronics
Global EV sales broke 14 million units in 2024, with 800-volt drivetrains proliferating across Chinese and European platforms. SiC inverters now achieve 350-kilowatt fast charging, which recharges 80% of the battery capacity in under 18 minutes, aligning refueling times with those of combustion vehicles. China mandates 95% inverter efficiency from 2025, effectively solidifying the use of SiC in high-capacity packs. Automakers that co-design modules report 40% reductions in switching losses and 25-kilometer range gains per charge. Onboard AC chargers are increasingly adopting GaN transistors that switch at 500 kilohertz, shrinking magnetics by 60% and enabling power levels of up to 11 kilowatts in compact crossovers.[4]International Energy Agency, “Global EV Outlook 2024,” iea.org.
Government Incentives for Smart Grid Modernization
The United States committed USD 10.5 billion of infrastructure funding to advanced metering and distribution automation, directly expanding the buyer pool for communication-enabled power modules. The European Union earmarked EUR 43 billion (USD 47 billion) for digitization that will lift smart meter penetration to 80% by 2028. India’s Revamped Distribution Sector Scheme allocates INR 3.03 trillion (USD 36.5 billion) to install 250 million smart meters by 2026, stipulating IEEE 2030.5 or equivalent interoperability. Utilities running these programs tend to favor solutions with embedded cybersecurity and remote firmware upgrade capability, features that are easiest to implement in integrated smart power modules.
Restraints Impact Analysis*
| Restraint | (~) % Impact on CAGR Forecast | Geographic Relevance | Impact Timeline |
|---|---|---|---|
| High cost of wide-bandgap materials such as GaN and SiC | -1.4% | Global, most acute in Asia Pacific consumer segments | Medium term (2-4 years) |
| Interoperability and standards fragmentation | -1.1% | Global, regulatory complexity in Europe and North America | Long term (≥ 4 years) |
| Thermal management challenges in high-density PMICs | -0.8% | Asia Pacific and North America | Short term (≤ 2 years) |
| Tariff volatility on semiconductor components | -0.6% | Global supply chains, peak impact in North America and Europe | Short term (≤ 2 years) |
| Source: Mordor Intelligence | |||
High Cost of Wide-Bandgap Materials Such as GaN and SiC
SiC wafers priced near USD 1,500 for 150-millimeter diameters in 2024 contrast sharply against USD 300 silicon equivalents, squeezing module margins and confining adoption to premium drivetrain and industrial categories. With three vendors controlling more than 70% of boule capacity, multi-year supply deals lock in elevated pricing through 2027. GaN epitaxy yields of 85% on 200-millimeter substrates still trail the 95% target for mainstream consumer cost points, resulting in defect premiums that brands ultimately pass on to consumers. Material costs form 40-50% of the finished SiC MOSFET expense, limiting large-scale price drops unless breakthroughs in crystal growth occur. Lead times of 12-18 months push automakers to dual-source silicon and SiC inverters, diluting volume leverage.
Interoperability and Standards Fragmentation
Qi and AirFuel protocols differ in their coil geometries and foreign-object detection capabilities, which impede cross-device compatibility and force brands to support multiple SKUs or integrate two receiver coils per product. In the grid domain, North American, European, and Chinese utilities each mandate distinct communication stacks, resulting in certification costs exceeding USD 500,000 per product line. Smart-home connectivity adds further fragmentation with Zigbee, Thread, and Matter pursuing parallel market entries. The lack of unified standards delays time-to-market for smaller suppliers and concentrates volume among vertically integrated incumbents. Although IEC 63110 aims to harmonize wireless power transfer rules, implementation may extend beyond 2027.
*Our forecasts treat driver/restraint impacts as directional, not additive. The impact forecasts reflect baseline growth, mix effects, and variable interactions.
Segment Analysis
By Product: Energy Systems Push Growth Ahead of Chargers
Wireless chargers held a 42.55% share of the smart power market size in 2025, driven by more than 800 million accessory shipments. Energy management systems are forecast to outpace at a 12.05% CAGR through 2031, leveraging time-of-use tariff optimization in homes and demand-response automation in commercial buildings. California and Texas utilities installed 2 million smart thermostats during 2024 under flexibility programs that reward peak-load curtailment. Machine-learning algorithms within new platforms can reduce building energy intensity by up to 25%, enhancing payback and generating recurring software revenue. Wireless charging is now being incorporated into furniture sold to hospitality and office clients, yet handset replacement cycles that stretch beyond three years temper accessory reorder volume.
The ongoing rooftop solar boom accelerates demand for intelligent inverters and controllers that integrate batteries into virtual power plants. Residential solar-plus-storage installs in the United States exceeded 500,000 units in 2024, each requiring multi-port energy hubs that orchestrate generation, storage, and flexible loads. Corporates pursue ISO 50001 certification, driving procurement of systems that deliver granular monitoring and automatic fault detection. Wireless chargers migrate beyond phones into two-in-one laptops and handheld gaming devices, but saturation in the premium smartphone tier suggests slower incremental growth compared with energy management rollouts.


By Technology: Wide-Bandgap Devices Gain Momentum
Inductive and magnetic resonance technologies accounted for 54.60% of 2025 revenue, primarily due to the deployment of Qi2 across flagship smartphones. Still, wide-bandgap power electronics are expected to post a 14.10% CAGR, the fastest among technology buckets. SiC modules now feature in more than 60% of new 800-volt EV platforms, delivering efficiency gains that cascade into smaller batteries and longer driving range. GaN transistors power 100-watt USB-C chargers that are 40% lighter than silicon-based units, securing design slots with accessory leaders. Data-center operators are testing GaN power stages for 48-volt server racks, aiming for 98% conversion efficiency, which could significantly reduce the cooling load.
Radio frequency and infrared wireless power transfer remain niche, with a share under 5%, confined to asset tracking and medical implant use. Yet the first 1-watt over-the-air certification received in 2024 hints at expanded retail signage and warehouse sensor opportunities. Inductive pads retain dominance in near-field charging as coil coupling surpasses 85% and supports metal device housings. Nonetheless, the march toward higher switching frequencies enabled by GaN and SiC reduces coil dimensions, thereby curbing electromagnetic interference and enhancing form factor flexibility.
By Application: Automotive Electrification Drives the Upswing
Consumer electronics accounted for 47.55% of 2025 revenue, but growth is moderating as smartphone refresh cycles elongate. The automotive and e-mobility segment is tracking a 14.75% CAGR and is poised to surpass consumer devices by 2031. Each battery electric vehicle adds approximately USD 1,200 in power electronics content, including traction inverters, onboard chargers, and DC-DC converters, compared to USD 150 in combustion cars. Level-3 automated driving needs up to 20 regulated rails for radar, lidar, and vision processors, magnifying PMIC demand. New mild hybrids at 48 volts expand addressable volume in markets where full battery electric penetration lags.
Industrial automation holds a near 20% share, supported by collaborative robots and motor drives that integrate regeneration and predictive maintenance. Residential and commercial energy management comprises the balance, notably smart thermostats, inverter-based heat pumps, and building-scale storage. As consumer electronics volume plateaus, suppliers are pivoting their design resources to mobility and industrial opportunities that promise richer margins and longer product lifecycles. Regulatory action backing zero-emission transport in the European Union and parts of the United States cements a durable growth runway for automotive power electronics suppliers.
By End User: Utilities Accelerate Grid-Edge Investment
OEMs and device makers captured 36.55% of the smart power market share in 2025 by embedding power control into finished goods. Utilities and energy service companies are set for a 13.85% CAGR to 2031 as distributed solar, stationary storage, and flexible loads migrate behind the meter. More than 150 utilities launched virtual power plant initiatives during 2024, enlivening demand for sub-second response energy management systems. Hospitality and retail channels together accounted for roughly 10% of revenue, utilizing wireless charging furniture to enhance the customer experience.
Government and defense remain small in volume but command premium pricing for ruggedized and cyber-secure supplies. Utilities are increasingly stipulating IEEE 2030.5 and OpenADR 2.0b compliance, fostering interoperable ecosystems that reduce integration risk. OEMs in smartphones and vehicles accelerate the vertical integration of power design to protect margins and differentiate themselves on efficiency, while utilities outsource software-defined control to vendors capable of delivering turnkey platforms.
By Power Device Type: Integrated Modules Rise
Power management ICs accounted for 45.40% of revenue in 2025, reflecting their widespread adoption across wearables and server motherboards. Smart power modules, forecast to grow at a 11.75% CAGR, combine SiC switches, gate drivers, and sensors in a single package that simplifies design and aligns with functional safety standards. Automotive inverter makers save board space and shorten validation cycles, while industrial drives benefit from embedded telemetry that supports predictive maintenance.
Discrete wide-bandgap devices operate reliably above 1,700 volts, where package inductance in modules compromises switching performance. Switching-mode power supplies dominate low-cost consumer gear, but now integrate GaN to reach 95% efficiency at 500 kilohertz, enabling fanless laptop adapters with a standby draw of less than 30 milliwatts. Design-for-integration trends favor modules, yet the discrete catalog remains vital for ultra-high-voltage and custom topologies in renewable energy and traction.
Geography Analysis
The Asia Pacific region held 37.80% of 2025 revenue and is advancing at a 12.25% CAGR, the strongest among all regions. China produced more than 9 million battery electric vehicles that year, each loaded with SiC inverters and GaN chargers. India’s Production Linked Incentive scheme propelled electronics output to USD 115 billion in 2024, supporting domestic PMIC fabs that reduce import reliance. Japan added 8 gigawatts of renewable capacity, sparking demand for 4 million residential energy systems that sync rooftop solar with grid signals. South Korea’s semiconductor equipment exports surpassed USD 20 billion, reflecting capital outlays on advanced packaging of heterogeneous PMICs and processors.
North America and Europe each held a near 25% share. In the United States, the Inflation Reduction Act’s USD 7,500 EV tax credit has accelerated sales of models featuring SiC drivetrains. Utilities installed 10 gigawatt-hours of grid-scale batteries in 2024, each using multi-megawatt inverters built on SiC power stages. Europe’s REPowerEU has earmarked EUR 43 billion (USD 47 billion) for the digitization of distribution networks through 2028. The Energy Performance of Buildings Directive, effective from 2025, mandates smart readiness indicators that promote integrated management systems in new construction.
The Middle East and Africa contributed under 10% but enjoy pockets of high growth, especially in Gulf Cooperation Council smart meter rollouts and South African renewable tenders that demand advanced grid-support inverters. Latin America remains an emerging opportunity as Brazil and Mexico explore time-of-use tariffs and utility-backed rooftop solar credits that encourage energy management system uptake. Although advanced semiconductor fabrication is limited in these regions, policy incentives for distributed renewables create downstream demand for smart power hardware and software.

Competitive Landscape
The smart power market remains moderately fragmented, with the top ten suppliers accounting for a significant share of the revenue. Vertical integration is gaining traction as Tesla fabricates SiC modules in-house and Apple designs custom PMICs tailored to its silicon-on-package strategy. Traditional semiconductor majors, namely Texas Instruments, Infineon, and STMicroelectronics, leverage broad automotive-qualified portfolios plus decades-long customer pipelines. Niche GaN players, such as Navitas and GaN Systems, compete on device performance and speed to iterate, particularly in fast chargers and data-center converters.
Patent filings for wide-bandgap devices exceeded 2,500 in 2024, led by Infineon, Wolfspeed, and Rohm. Disruptors chase cost gaps: Efficient Power Conversion has released a 15-milliohm GaN transistor that enables 99% efficiency in 48-volt converters, while Chinese entrants Sanan IC and Hangzhou Silan scale 6-inch SiC wafer lines with cost-reduction roadmaps. Standards alignment helps temper fragmentation; Qi2 and IEEE 2030.5 reduce technical barriers for accessory and grid products, yet tariff volatility and export controls cloud supply continuity for advanced tooling.
Furniture and hospitality wireless charging remains an under-penetrated niche, with unit adoption below 5% across global hotel chains, presenting white-space for integrators that combine charging pads, occupancy sensors, and energy analytics. Energy management software providers compete to own the utility interface layer; Siemens, Schneider Electric, and new cloud-native entrants race to secure data rights for virtual power plants. Multiyear grid modernization budgets in the United States and Europe provide durable runway, though procurement cycles favor vendors able to bundle hardware, software, and field services.
Smart Power Industry Leaders
Texas Instruments Incorporated
Infineon Technologies AG
STMicroelectronics N.V.
ON Semiconductor Corporation
Qualcomm Incorporated
- *Disclaimer: Major Players sorted in no particular order


Recent Industry Developments
- February 2025: Infineon Technologies announced its USD 830 million acquisition of GaN Systems to consolidate 650-volt intellectual property and accelerate data-center and automotive design wins.
- January 2025: Texas Instruments introduced the BQ25308 charger delivering 5 ampere current at 97% efficiency for wearables and hearables.
- December 2024: STMicroelectronics and Geely committed USD 500 million to a Ningbo joint venture that will assemble 2 million SiC modules annually by 2027.


Global Smart Power Market Report Scope
The Smart Power Market Report is Segmented by Product (Wireless Chargers, Energy Management Systems), Technology (Inductive/Magnetic Resonance, Radio Frequency/Infrared, Wide-Bandgap Power Electronics), Application (Consumer Electronics, Automotive and E-Mobility, Industrial Automation, Residential and Commercial Energy Management), End User (OEMs/Device Manufacturers, Utilities and Energy Service Companies, Hospitality and Retail, Government and Defense), Power Device Type (Power Management ICs, Smart Power Modules, Discrete Wide-Bandgap Devices, Switching Mode Power Supplies), and Geography (North America, South America, Europe, Asia Pacific, Middle East and Africa). The Market Forecasts are Provided in Terms of Value (USD).
| Wireless Chargers |
| Energy Management Systems |
| Inductive / Magnetic Resonance |
| Radio Frequency / Infrared |
| Wide-Bandgap Power Electronics (GaN, SiC) |
| Consumer Electronics |
| Automotive and E-Mobility |
| Industrial Automation |
| Residential and Commercial Energy Management |
| OEMs / Device Manufacturers |
| Utilities and Energy Service Companies |
| Hospitality and Retail |
| Government and Defense |
| Power Management ICs |
| Smart Power Modules |
| Discrete Wide-Bandgap Devices |
| Switching Mode Power Supplies |
| North America | United States | |
| Canada | ||
| Mexico | ||
| South America | Brazil | |
| Mexico | ||
| Rest of South America | ||
| Europe | Germany | |
| United Kingdom | ||
| France | ||
| Spain | ||
| Italy | ||
| Rest of Europe | ||
| Asia Pacific | China | |
| India | ||
| Japan | ||
| Australia | ||
| South Korea | ||
| Rest of Asia Pacific | ||
| Middle East and Africa | Middle East | Saudi Arabia |
| United Arab Emirates | ||
| Qatar | ||
| Turkey | ||
| Rest of Middle East | ||
| Africa | South Africa | |
| Nigeria | ||
| Rest of Africa | ||
| By Product | Wireless Chargers | ||
| Energy Management Systems | |||
| By Technology | Inductive / Magnetic Resonance | ||
| Radio Frequency / Infrared | |||
| Wide-Bandgap Power Electronics (GaN, SiC) | |||
| By Application | Consumer Electronics | ||
| Automotive and E-Mobility | |||
| Industrial Automation | |||
| Residential and Commercial Energy Management | |||
| By End User | OEMs / Device Manufacturers | ||
| Utilities and Energy Service Companies | |||
| Hospitality and Retail | |||
| Government and Defense | |||
| By Power Device Type | Power Management ICs | ||
| Smart Power Modules | |||
| Discrete Wide-Bandgap Devices | |||
| Switching Mode Power Supplies | |||
| By Geography | North America | United States | |
| Canada | |||
| Mexico | |||
| South America | Brazil | ||
| Mexico | |||
| Rest of South America | |||
| Europe | Germany | ||
| United Kingdom | |||
| France | |||
| Spain | |||
| Italy | |||
| Rest of Europe | |||
| Asia Pacific | China | ||
| India | |||
| Japan | |||
| Australia | |||
| South Korea | |||
| Rest of Asia Pacific | |||
| Middle East and Africa | Middle East | Saudi Arabia | |
| United Arab Emirates | |||
| Qatar | |||
| Turkey | |||
| Rest of Middle East | |||
| Africa | South Africa | ||
| Nigeria | |||
| Rest of Africa | |||


Key Questions Answered in the Report
How fast is global demand for smart power hardware growing?
Revenue in the smart power market is projected to rise from USD 208.85 billion in 2026 to USD 350.65 billion by 2031, reflecting an 10.92% CAGR based on Mordor Intelligence data.
Which region drives the highest share of smart power sales?
Asia Pacific led with 37.80% of 2025 revenue and is expanding the fastest, at a 12.25% CAGR through 2031.
What application segment shows the quickest growth trajectory?
Automotive and e-mobility solutions are advancing at a 14.75% CAGR owing to the rapid shift toward electric drivetrains and 48-volt hybrids.
Why are wide-bandgap semiconductors important to future power designs?
GaN and SiC devices switch faster and at higher temperatures than silicon, enabling lighter chargers, more efficient inverters, and 350-kilowatt EV fast charging.
Page last updated on:


