Small Animal Imaging Market Size and Share
Market Overview
| Study Period | 2019 - 2030 |
|---|---|
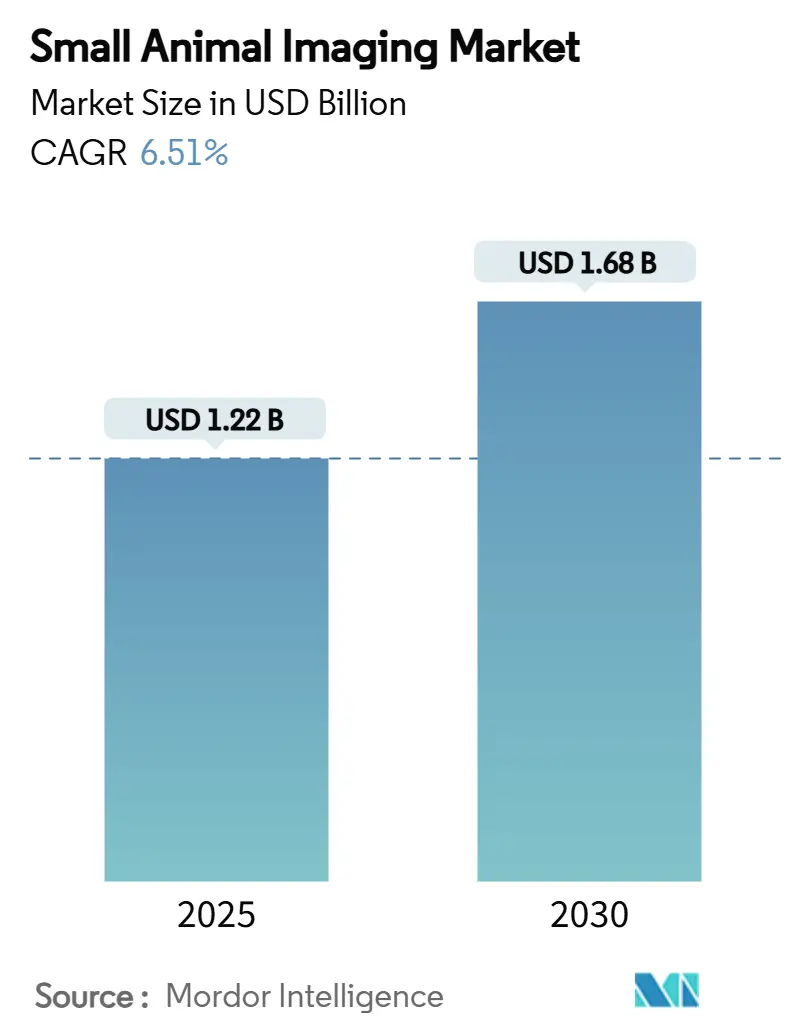
| Market Size (2025) | USD 1.22 Billion |
| Market Size (2030) | USD 1.68 Billion |
| Growth Rate (2025 - 2030) | 6.51% CAGR |
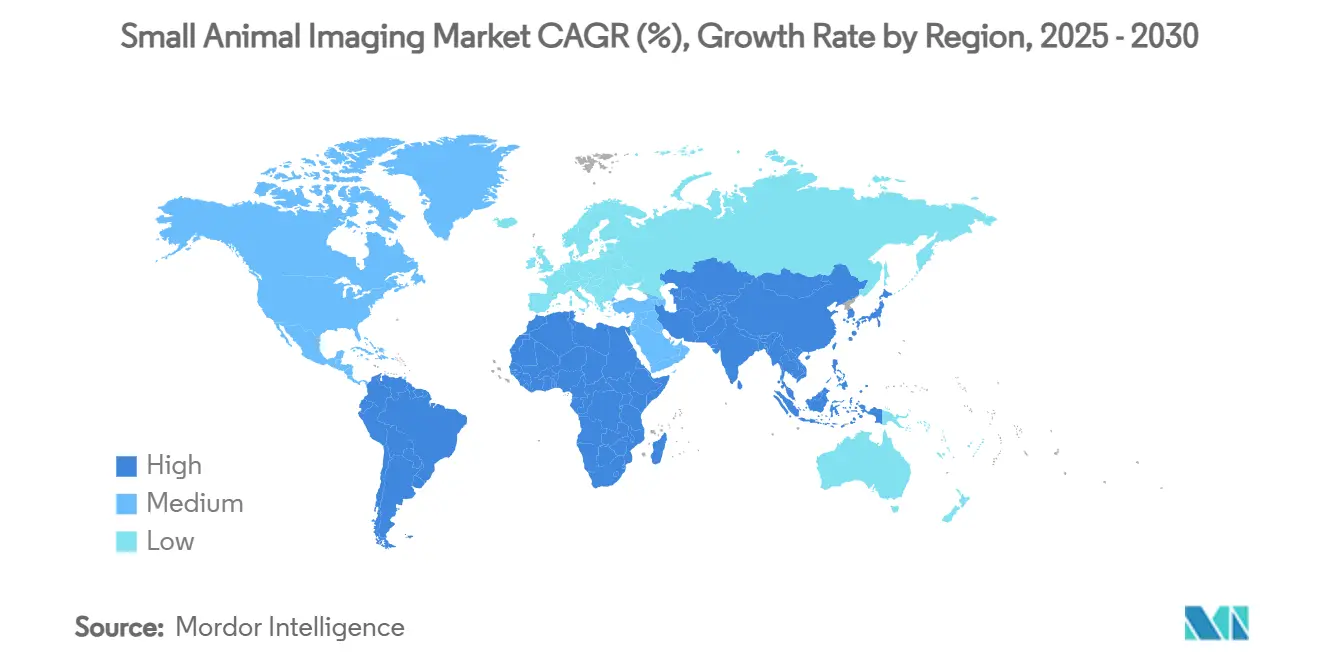
| Fastest Growing Market | Asia Pacific |
| Largest Market | North America |
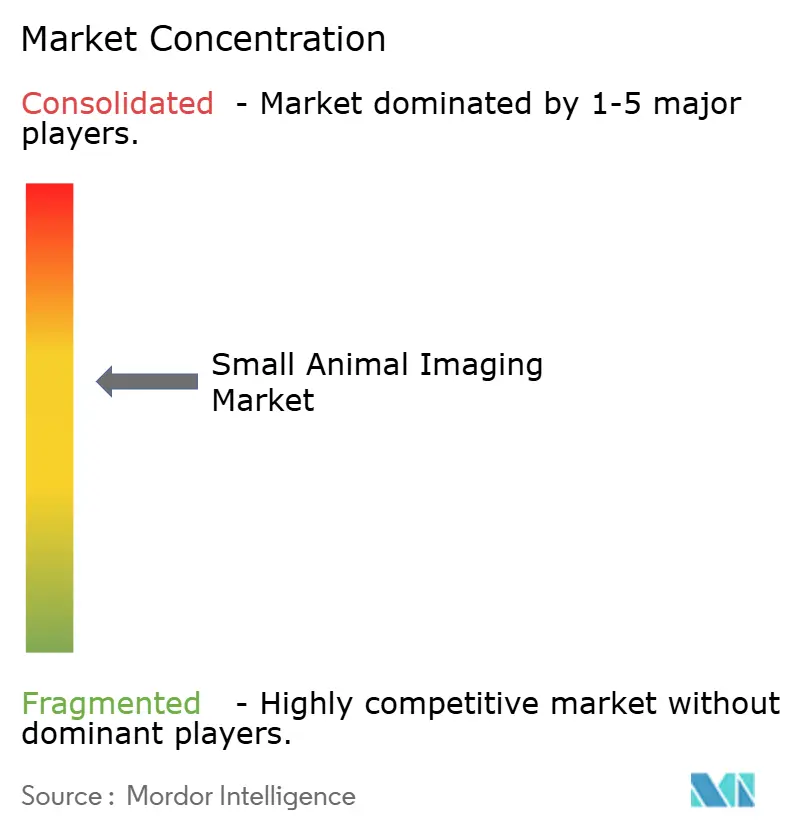
| Market Concentration | Medium |
Major Players *Disclaimer: Major Players sorted in no particular order Image © Mordor Intelligence. Reuse requires attribution under CC BY 4.0. | |
Small Animal Imaging Market Analysis by Mordor Intelligence
The small animal imaging market size is USD 1.22 billion in 2025 and is forecast to reach USD 1.68 billion by 2030, advancing at a 6.51% CAGR. This expansion stems from pharmaceutical companies using high-resolution preclinical imaging to de-risk pipelines, curb late-stage attrition and accelerate translational decision-making. Hybrid instruments that fuse optical, radionuclide and micro-CT technologies widen investigative scope while compressing study timelines. Contract research organizations (CROs) strengthen global capacity by adding turnkey imaging suites, and artificial-intelligence (AI) workflows unlock faster reconstructions, lower radiation doses and tighter study reproducibility. At the same time, capital expenditure hurdles and sporadic radioisotope supply pose near-term friction, yet performance gains per animal continue to tilt budgets toward advanced modalities rather than traditional histology.
Key Report Takeaways
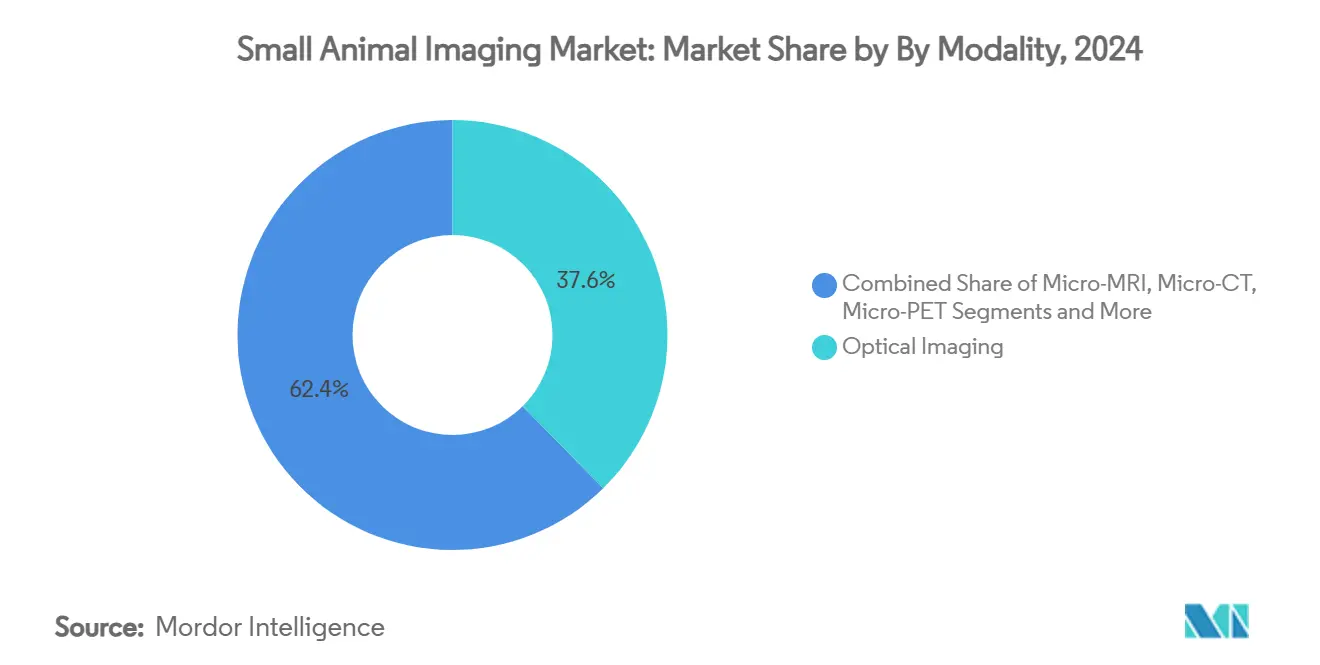
- By Modality, Optical imaging led with a 37.63% revenue share of the small animal imaging market in 2024, while photon-counting micro-CT is projected to expand at a 9.23% CAGR to 2030.
- By Component, Instruments accounted for 62.37% of the small animal imaging market size in 2024; software and services are projected to climb at a 10.24% CAGR through 2030.
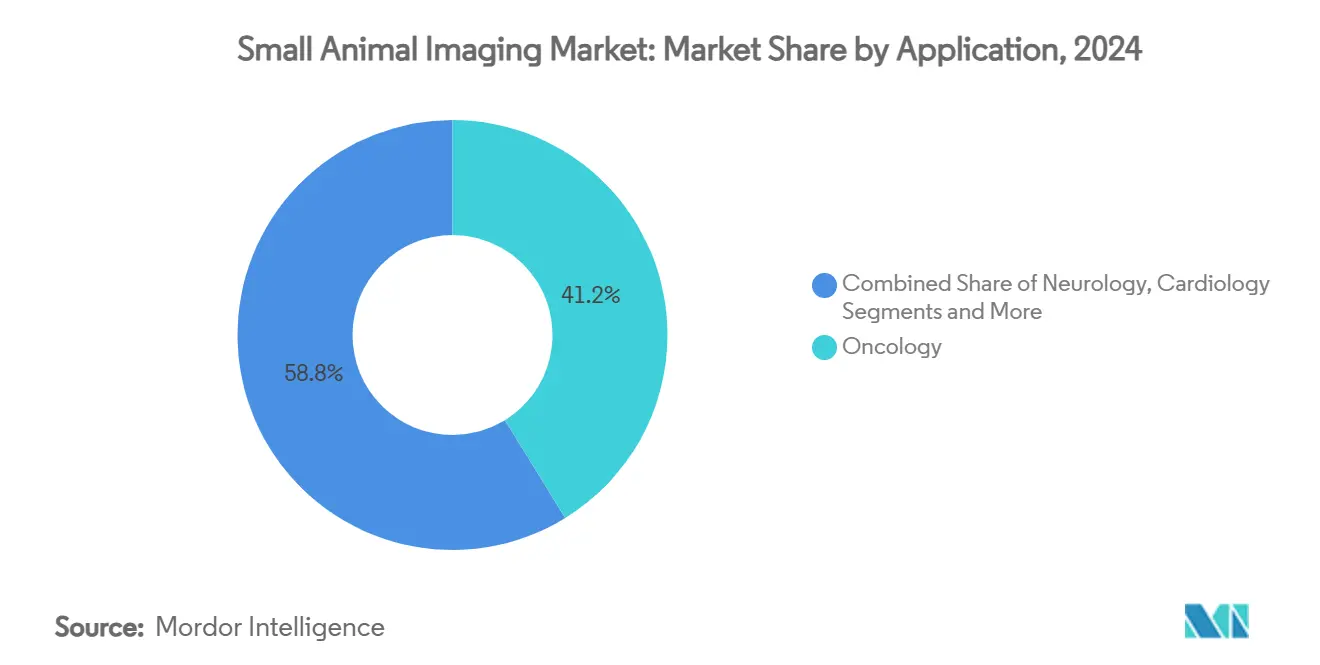
- By Application, Oncology commanded 41.22% of the small animal imaging market share in 2024, and stem-cell and regenerative medicine is forecast to post an 8.49% CAGR to 2030.
- By End User, Pharmaceutical and biotechnology companies controlled 44.63% of end-user spending in 2024, while CRO revenue is set to grow at an 8.04% CAGR through 2030.
- By Geography, North America contributed 38.93% of global revenue in 2024; Asia-Pacific is on track for a 9.02% CAGR, the fastest regional trajectory.
Global Small Animal Imaging Market Trends and Insights
Drivers Impact Analysis*
| Driver | (~) % Impact on CAGR Forecast | Geographic Relevance | Impact Timeline |
|---|---|---|---|
| Rising Pre-Clinical Oncology Research Demand For Translational Imaging | + 1.2% | Global, with concentration in North America & EU | Medium term (2-4 years) |
| Technological Advances In Hybrid Micro-PET/CT & Micro-SPECT/CT Systems | + 0.8% | North America & EU core, spill-over to APAC | Long term (≥ 4 years) |
| Growing Investment By CROs & Pharma In Drug Discovery Studies | + 1.1% | Global, with early gains in APAC emerging markets | Short term (≤ 2 years) |
| AI-Enabled Micro-CT Dose Reduction & Image Quality Gains | + 0.9% | North America & EU, expanding to APAC | Medium term (2-4 years) |
| Photon-Counting Micro-CT Enabling Multi-Contrast K-Edge Imaging | + 1.3% | North America & EU, limited APAC adoption | Long term (≥ 4 years) |
| Radiolabeled Cell-Tracking For Cell-Therapy Safety Studies | + 1.0% | Global, with regulatory focus in North America & EU | Medium term (2-4 years) |
| Source: Mordor Intelligence | |||
Rising Pre-Clinical Oncology Research Demand For Translational Imaging
Oncology drives 41.22% of current revenue because longitudinal imaging verifies tumor biology more reliably than xenograft end-points. Pharmaceutical developers rely on multimodal scans to observe progression, metastasis and therapy response in real time, aligning with the FDA preference for imaging-based biomarkers that correlate with clinical efficacy.[1]Weidong Yang, “Landscape of Nuclear Medicine in China and Its Progress on Theranostics,” Journal of Nuclear Medicine, jnm.snmjournals.org FAP-2286 exemplifies the shift toward mechanism-specific tracers that increase tumor retention and shrink cohort sizes while boosting statistical power. Theranostic conjugates that double as therapy vectors give sponsors simultaneous efficacy and dosimetry insight, accelerating protocol design. As a result, the small animal imaging market sees consistent capital allocation despite cost pressures because oncology programs demand repeatable, high-fidelity output.
Technological Advances In Hybrid Micro-PET/CT & Micro-SPECT/CT Systems
Hybrid scanners remove duplicate anesthesia and handling cycles by merging functional and anatomic views within a single acquisition. Mediso’s nanoScan platform integrates multi-pinhole collimation to image several rodents simultaneously, raising throughput without compromising sensitivity. Automation of reconstruction and quantification curbs operator variability and elevates cross-site reproducibility—critical when studies feed regulatory submissions. Increasing incorporation of theranostic isotopes lets researchers calculate therapeutic dose on the same system used for diagnostic tracking, cementing hybrid workflows within core labs. Consequently, capital budgets lean toward multi-modality lines that future-proof laboratories, sustaining premium pricing inside the small animal imaging market.
Growing Investment By CROs & Pharma In Drug-Discovery Studies
CROs register an 8.04% CAGR as drug sponsors outsource imaging-intensive phases to streamline fixed costs. Tighter 2025 R&D budgets and the U.S. Biosecure Act’s restrictions on China open lanes for Indian vendors, which add advanced scanners to lure displaced projects. Full-service models bundle radiopharmacy, imaging and analytics under one fee, minimizing client administration. Competition intensifies as CROs differentiate on modality breadth, isotope availability and AI post-processing speed, reinforcing service-led expansion within the small animal imaging market.
AI-Enabled Micro-CT Dose Reduction & Image Quality Gains
AI reconstruction slashes radiation per scan yet preserves resolution by suppressing noise and sharpening low-dose datasets. Vendors embed automated segmentation and trend-analysis dashboards that export standardized metrics, satisfying 3R expectations by extracting more data per animal.[2]Corporate Communications, “Leading the Way in Veterinary Imaging,” Siemens Healthineers, siemens-healthineers.com Cross-disciplinary algorithms such as AI-enhanced infrared thermography now track physiologic changes continuously, widening non-invasive monitoring options. These gains cut repeat imaging, lower study variance and shorten protocol timelines, further embedding AI modules into every tier of the small animal imaging market.
Restraints Impact Analysis*
| Restraint | (~) % Impact on CAGR Forecast | Geographic Relevance | Impact Timeline |
|---|---|---|---|
| High Equipment Procurement & Maintenance Cost | -0.7% | Global, with acute impact in emerging markets | Short term (≤ 2 years) |
| Shortage Of Trained Personnel For Multimodal Systems | -0.5% | Global, with concentration in APAC emerging markets | Medium term (2-4 years) |
| 3R Regulatory Pressure Reducing Animal Usage | -0.4% | North America & EU regulatory focus, expanding globally | Long term (≥ 4 years) |
| Radioisotope Supply Bottlenecks For PET Tracers | -0.2% | Global, with acute impact in regions dependent on reactor-produced isotopes | Short term (≤ 2 years) |
| Source: Mordor Intelligence | |||
High Equipment Procurement & Maintenance Cost
Initial outlays range from USD 150,000 for benchtop X-ray CT to USD 2 million for high-end micro-CT, while annual service contracts consume 10–15% of purchase price. Academic centers often pool grants to create shared cores, yet scheduling conflicts limit agility for time-critical oncology or infection models. Leasing eases upfront cash but raises total ownership cost, reinforcing the need for meticulous utilization planning. Consequently, smaller institutions may delay upgrades, tempering the small animal imaging market’s penetration rate in resource-constrained regions.
Radioisotope Supply Bottlenecks For PET Tracers
Aging reactors, such as the High Flux Reactor in the Netherlands, periodically curtail Mo-99 output, reducing downstream Tc-99m and related SPECT tracer availability. FDA stability mandates demanding longer shelf-life testing complicate logistics further. Cyclotron-based Gallium-68 production reduces generator dependence and delivers >95% radiochemical purity, but facility access remains uneven.[3]Ivan Wang, “Cyclotron Produced Gallium-68 to Manufacture Clinical Gallium-68 Tracers Without Commercial Kits,” Journal of Nuclear Medicine, jnm.snmjournals.org Supply insecurity forces study rescheduling and raises contingency budgets, narrowing the adoption curve for radionuclide-centric protocols within the small animal imaging market.
*Our forecasts treat driver/restraint impacts as directional, not additive. The impact forecasts reflect baseline growth, mix effects, and variable interactions.
Segment Analysis
By Modality: Optical Dominance Faces Hybrid Competition
Optical imaging produced 37.63% of 2024 revenue by offering radiation-free, real-time tumor visualization, a trait aligning with 3R mandates. Yet the small animal imaging market sees photon-counting micro-CT ascending at a 9.23% CAGR, leveraging K-edge analytics to map elemental composition unreachable by fluorescence. Micro-MRI and micro-PET maintain steady uptake where high-resolution anatomy or sub-nanomolar sensitivity is non-negotiable. Hybrid PET/CT systems consolidate workloads, allowing sponsors to compress study days and standardize reconstruction templates across centers.
Second-generation ultrasound and photoacoustic platforms satisfy vascular and perfusion studies, while magnetic-particle imaging provides emerging opportunities for iron-oxide-based cell tracking. In aggregate, demand favors systems that integrate multi-contrast streams, ensuring the small animal imaging market retains a technological arms race dynamic that rewards modularity and upgrade paths.


By Component: Software Growth Outpaces Hardware
Hardware retained 62.37% of 2024 spending because scanners still dictate budget magnitude; nonetheless, software and services will grow 10.24% annually through 2030 as AI earns line-item status. Subscription analytics, cloud-enabled reconstruction and cross-site data harmonization attract premiums by compressing study readout windows. The reagents segment delivers recurring sales of radionuclides, contrast agents and fluorescent probes, anchoring vendor-client relationships beyond initial capital deals.
Integration of predictive maintenance and remote diagnostics into service wraps improves uptime and unlocks outcome-based warranties. These practices reshape procurement conversations from unit cost toward lifecycle value, sustaining revenue momentum for software-centric offerings inside the small animal imaging market.
By Application: Oncology Leadership Challenged By Regenerative Medicine
Oncology held 41.22% of 2024 turnover because every cancer therapy pipeline relies on serial imaging to validate mechanism, dose scheduling and resistance emergence. However, stem-cell and regenerative medicine applications are on track for an 8.49% CAGR, catalyzed by breakthrough designations for cell therapies that need long-term biodistribution proof. Neurology and cardiology remain resilient as neurodegeneration and ischemia studies demand sub-100 µm detail and functional overlays.
Inflammation research gains from high-sensitivity PET probes that visualize immune-cell kinetics with nanomolar precision. Consequently, diversified modality stacks that can pivot between tumor biology and stem-cell fate tracking hold strategic advantage in the evolving small animal imaging market.
By End User: CRO Acceleration Reflects Outsourcing Trends
Pharmaceutical and biotechnology firms accounted for 44.63% of 2024 outlays because in-house imaging secures IP and scheduling. Yet CRO revenue will expand at 8.04% annually as sponsors externalize non-core functions and seek variable-cost models. Indian and Southeast Asian vendors leverage competitive labor and growing isotope access to win programs previously routed to China. Academic labs sustain government-backed projects but wrestle with refresh cycles; start-ups tap venture capital to access imaging through incubator core facilities.
Government and defense institutes apply scanners to infectious-disease countermeasures, reinforcing baseline demand across geopolitical cycles. These dynamics ensure multi-stakeholder purchasing continues to diversify the small animal imaging market’s customer mix.
Geography Analysis
North America owned 38.93% of 2024 turnover, supported by dense pharmaceutical headquarters, NIH grants and a mature CRO ecosystem. Europe follows with harmonized directives that streamline cross-border trials, while Japan pioneers detector physics, reinforcing domestic consumption and export sales. The small animal imaging market size in Asia-Pacific is growing fastest at a 9.02% CAGR through 2030 as manufacturing migration and supportive regulation boost capital spending.
China now counts 1,200 nuclear-medicine-ready hospitals and aims to double service capacity by 2035. India’s regulatory overhaul and growing medical-device base, highlighted by Fujifilm exceeding 50,000 installations, signals an infrastructure boom. Shimadzu’s planned Karnataka factory by 2027 demonstrates durable OEM commitment, while regional isotope supply agreements, such as Shine–Primo for Lu-177, shore up tracer pipelines. Collectively, these initiatives tilt center-of-gravity eastward, reshaping capital allocations across the small animal imaging market.

Competitive Landscape
Established suppliers cultivate depth rather than scale, resulting in moderate fragmentation. Bruker augments its modality range with launches like the nVista 2P microscope and the d-DNP Polarizer, while selective acquisitions fill portfolio gaps. GE HealthCare’s planned purchase of MIM Software pairs AI analytics with existing hardware, underscoring an industry pivot toward workflow packages over standalone boxes. Vertical integration persists as vendors embed radiopharmacy, scanners, cloud analytics and field service into single contracts that elevate switching costs for customers.
Photon-counting CT and magnetic-particle imaging start-ups attack niche pain points where incumbents lag, often partnering with CROs to validate functionality in large study volumes. AI platforms—ranging from automated lesion-segmentation to longitudinal animal tracking—become the primary battlefield for differentiation. Consequently, future share shifts inside the small animal imaging market will likely hinge on software velocity and isotope supply security rather than hardware footprint alone.
Small Animal Imaging Industry Leaders
Bruker Corporation
Revvity
FUJIFILM Corporation
Mediso Medical Imaging Systems
MR Solutions Ltd.
- *Disclaimer: Major Players sorted in no particular order

Recent Industry Developments
- June 2024: Insight Mobile Veterinary Diagnostics launched Australia’s first truck-mounted CT scanner to deliver on-site imaging across Victoria, expanding access for animal patients.
- March 2024: The University of Edinburgh’s Dick Vet Equine Hospital installed a standing CT unit to complement its MRI suite, enhancing limb imaging for large-animal patients.


Global Small Animal Imaging Market Report Scope
| Optical Imaging |
| Micro-MRI |
| Micro-CT |
| Micro-PET |
| Micro-SPECT |
| Hybrid PET/CT |
| Ultrasound |
| Photoacoustic Imaging |
| Magnetic Particle Imaging |
| Instruments |
| Reagents & Probes |
| Software & Services |
| Oncology |
| Neurology |
| Cardiology |
| Inflammation & Infectious Diseases |
| Drug Discovery / Pharmacology |
| Stem Cell & Regenerative Medicine |
| Pharmaceutical & Biotechnology Companies |
| Academic & Research Institutes |
| Contract Research Organizations (CROs) |
| Start-ups & Spin-offs |
| Government & Military Research Facilities |
| North America | United States |
| Canada | |
| Mexico | |
| Europe | Germany |
| United Kingdom | |
| France | |
| Italy | |
| Spain | |
| Rest of Europe | |
| Asia-Pacific | China |
| Japan | |
| India | |
| Australia | |
| South Korea | |
| Rest of Asia-Pacific | |
| Middle East and Africa | GCC |
| South Africa | |
| Rest of Middle East and Africa | |
| South America | Brazil |
| Argentina | |
| Rest of South America |
| By Modality | Optical Imaging | |
| Micro-MRI | ||
| Micro-CT | ||
| Micro-PET | ||
| Micro-SPECT | ||
| Hybrid PET/CT | ||
| Ultrasound | ||
| Photoacoustic Imaging | ||
| Magnetic Particle Imaging | ||
| By Component | Instruments | |
| Reagents & Probes | ||
| Software & Services | ||
| By Application | Oncology | |
| Neurology | ||
| Cardiology | ||
| Inflammation & Infectious Diseases | ||
| Drug Discovery / Pharmacology | ||
| Stem Cell & Regenerative Medicine | ||
| By End User | Pharmaceutical & Biotechnology Companies | |
| Academic & Research Institutes | ||
| Contract Research Organizations (CROs) | ||
| Start-ups & Spin-offs | ||
| Government & Military Research Facilities | ||
| By Geography | North America | United States |
| Canada | ||
| Mexico | ||
| Europe | Germany | |
| United Kingdom | ||
| France | ||
| Italy | ||
| Spain | ||
| Rest of Europe | ||
| Asia-Pacific | China | |
| Japan | ||
| India | ||
| Australia | ||
| South Korea | ||
| Rest of Asia-Pacific | ||
| Middle East and Africa | GCC | |
| South Africa | ||
| Rest of Middle East and Africa | ||
| South America | Brazil | |
| Argentina | ||
| Rest of South America | ||


Key Questions Answered in the Report
What is the projected value of the small animal imaging market in 2030?
It is forecast to reach USD 1.68 billion by 2030, growing at a 6.51% CAGR.
Which imaging modality currently generates the most revenue?
Optical imaging leads with a 37.63% revenue share in 2024.
Which region is expanding fastest in preclinical imaging demand?
Asia-Pacific is advancing at a 9.02% CAGR through 2030.
Why are CROs gaining share in small-animal imaging studies?
Pharmaceutical firms outsource imaging-heavy work to CROs for cost flexibility and access to specialized multimodal equipment.
What factor most limits wider PET tracer use?
Intermittent radioisotope supply and reactor downtime restrict availability of key isotopes such as Mo-99 and Tc-99m.
Which application segment is projected to grow quickest?
Stem-cell and regenerative medicine studies are expected to climb at an 8.49% CAGR to 2030.
Page last updated on:


