Hybrid Imaging Market Size and Share
Market Overview
| Study Period | 2019 - 2030 |
|---|---|
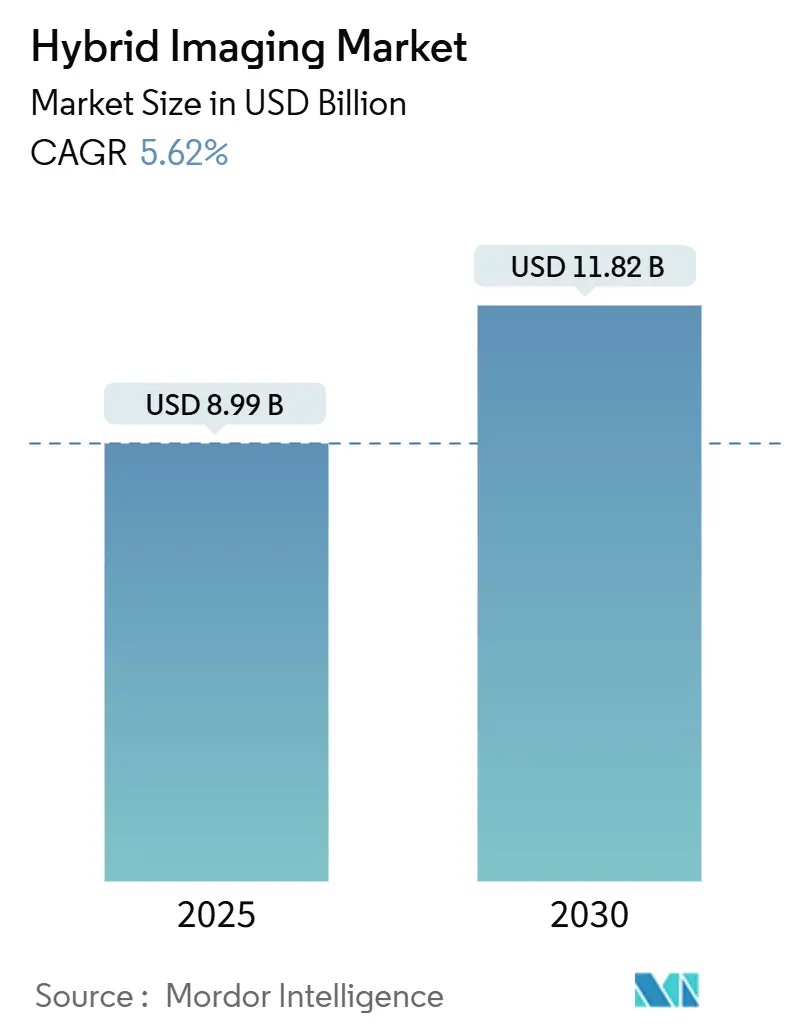
| Market Size (2025) | USD 8.99 Billion |
| Market Size (2030) | USD 11.82 Billion |
| Growth Rate (2025 - 2030) | 5.62% CAGR |
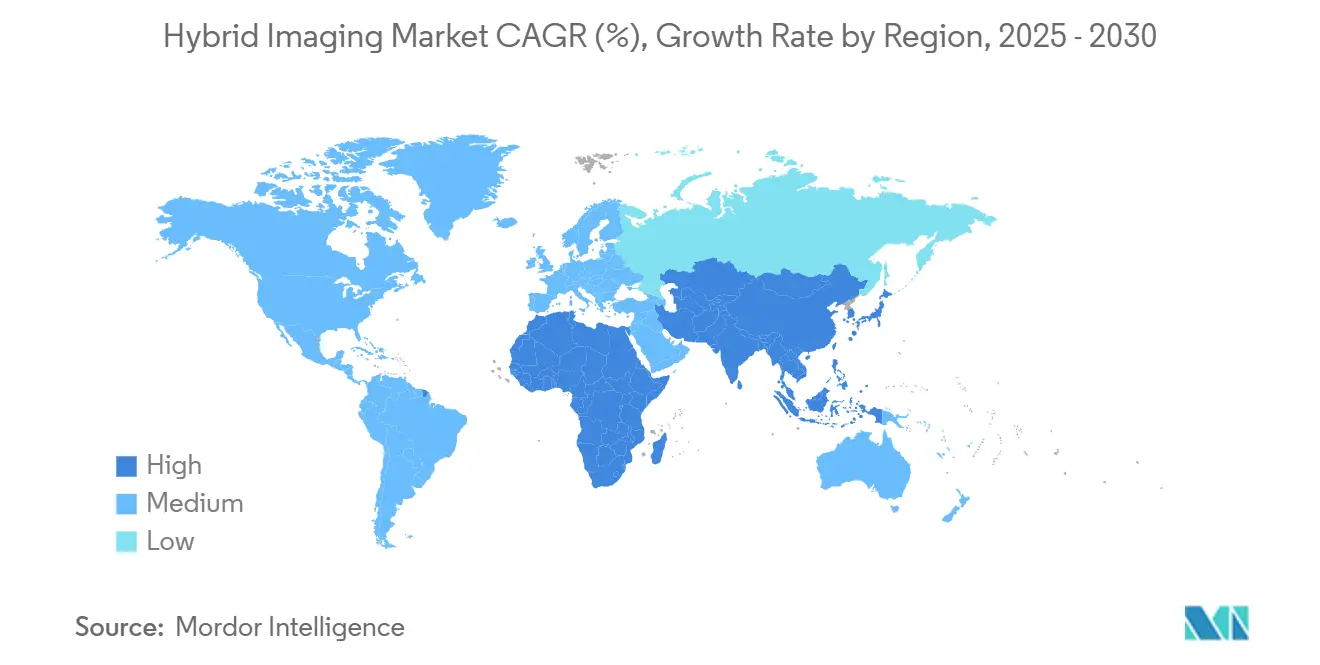
| Fastest Growing Market | Asia Pacific |
| Largest Market | North America |
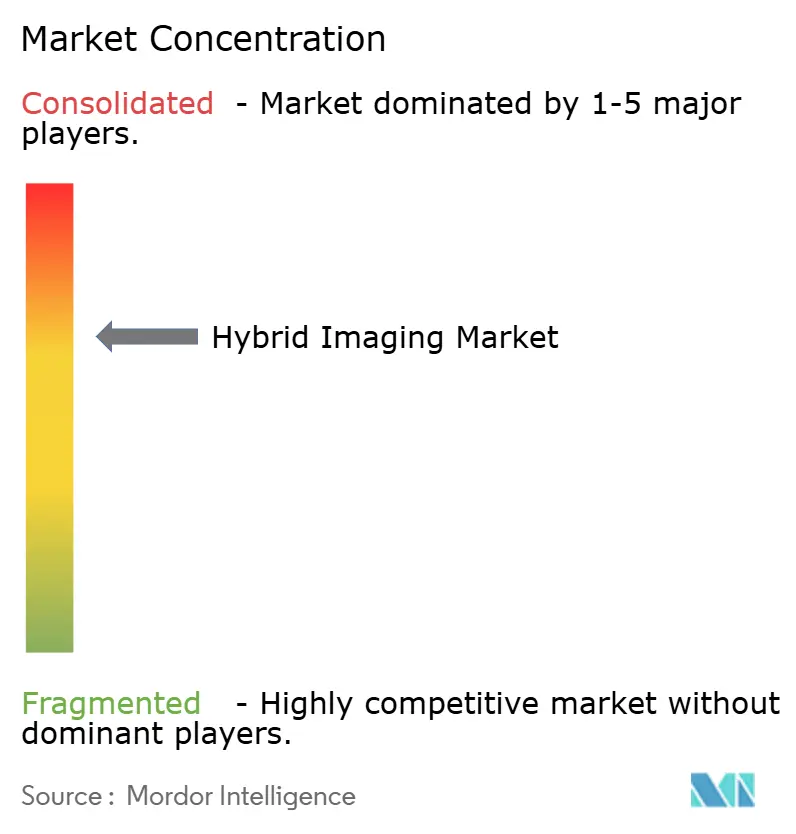
| Market Concentration | Medium |
Major Players *Disclaimer: Major Players sorted in no particular order Image © Mordor Intelligence. Reuse requires attribution under CC BY 4.0. | |
Hybrid Imaging Market Analysis by Mordor Intelligence
The hybrid imaging market size stood at USD 8.99 billion in 2025 and is expected to reach USD 11.82 billion by 2030, expanding at a 5.62% CAGR. Demand for precision oncology, reimbursement reforms that reward advanced radiopharmaceutical use, and steady gains in AI-driven workflow optimization form the core growth engine. Photon-counting detector rollouts have re-set performance expectations by boosting spatial resolution while lowering dose, which, combined with separate payment for high-cost tracers, is shortening pay-back periods for new scanners ACR.ORG. At the same time, domestic radioisotope capacity backed by federal funding is improving supply resilience, particularly in the United States. These forces, coupled with AI algorithms that cut exam times up to 50% and redistribute caseloads more evenly, are unlocking clinical capacity in radiology departments.
Key Report Takeaways
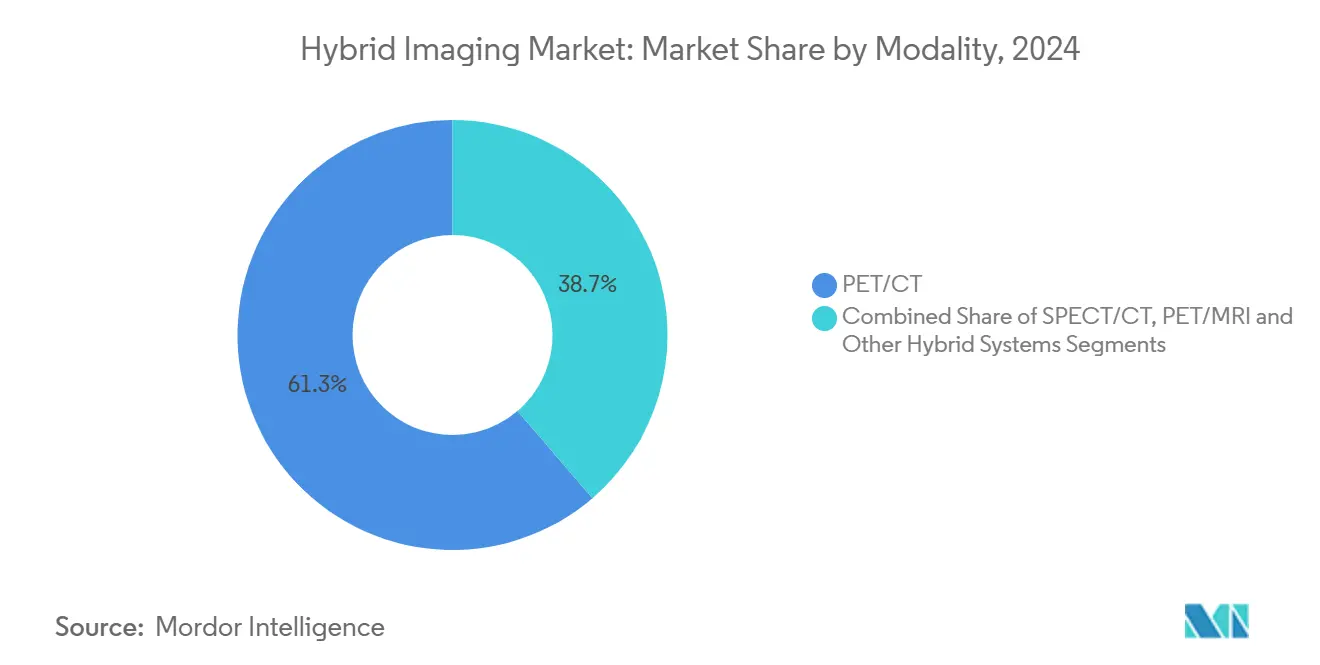
- By modality, PET/CT captured 61.28% of the hybrid imaging market share in 2024, while PET/MRI is projected to advance at a 9.72% CAGR through 2030.
- By application, oncology held 73.56% of the hybrid imaging market size in 2024; neurology is forecast to grow at 8.36% CAGR between 2025-2030.
- By end user, hospitals accounted for 54.67% share of the hybrid imaging market size in 2024, whereas academic and research institutes are set to expand at 8.84% CAGR to 2030.
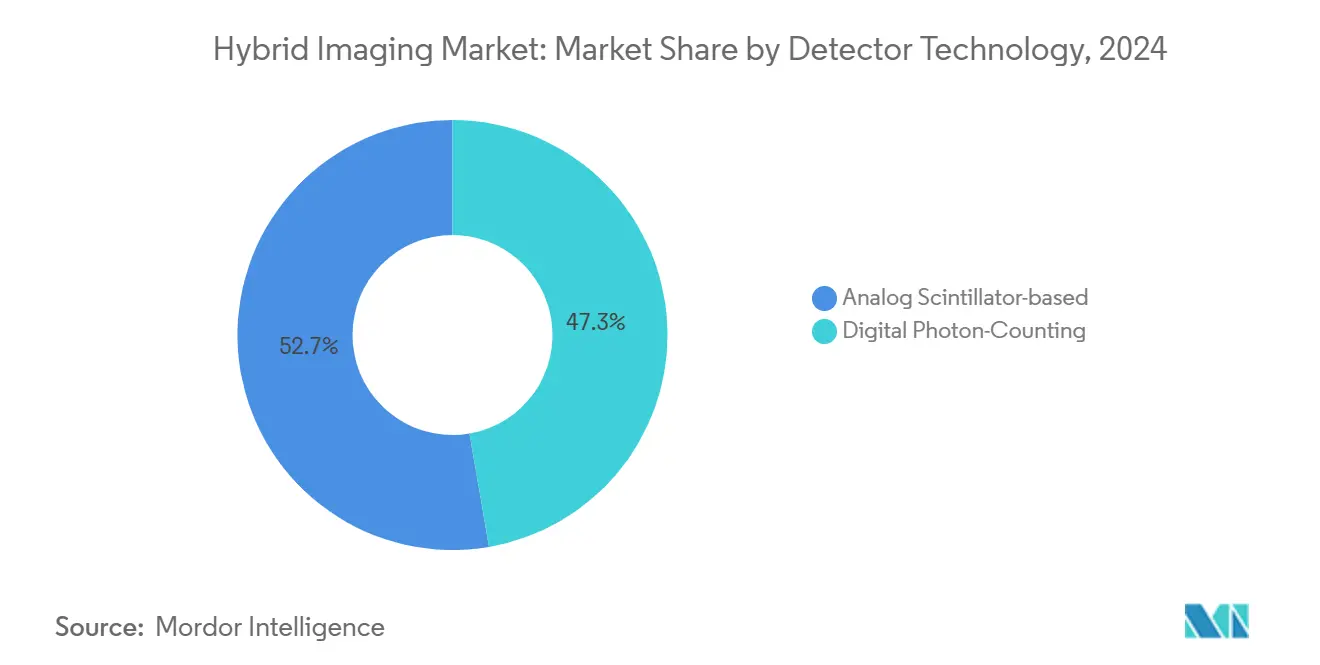
- By detector technology, digital photon-counting systems commanded 47.29% of the hybrid imaging market share in 2024 and are growing at 8.22% CAGR through 2030.
- By component, hardware led with 63.47% revenue in 2024; software is projected to climb at 9.66% CAGR during 2025-2030.
- North America represented 36.66% of global revenue in 2024; Asia-Pacific is the fastest-growing region at 7.38% CAGR.
Global Hybrid Imaging Market Trends and Insights
Drivers Impact Analysis*
| Driver | (~) % Impact on CAGR Forecast | Geographic Relevance | Impact Timeline |
|---|---|---|---|
| Capital-intensive shift to precision oncology | +1.2% | Global with early gains in North America and Europe | Medium term (2-4 years) |
| Reimbursement expansion for hybrid PET/CT procedures | +0.8% | North America and Europe, spill-over to Asia-Pacific | Short term (≤ 2 years) |
| Growing installed base of digital photon-counting detectors | +1.0% | Global, led by North America, expanding to Europe | Medium term (2-4 years) |
| AI-driven workflow optimization lowering total exam time | +0.7% | Global | Short term (≤ 2 years) |
| Military-funded radio-isotope programs | +0.3% | North America with strategic implications worldwide | Long term (≥ 4 years) |
| Emerging demand for theranostic planning | +0.9% | Global, concentrated in advanced healthcare systems | Medium term (2-4 years) |
| Source: Mordor Intelligence | |||
Capital-Intensive Shift To Precision Oncology
Healthcare systems are redirecting capital toward modalities that pair metabolic and anatomic insight to tailor oncology decisions. PET/CT and PET/MRI support tumor molecular characterization that allows physicians to select and monitor therapies with higher precision, decreasing the need for sequential imaging sessions.[1]Hina Shah, “Current and Upcoming Radionuclide Therapies in the Direction of Precision Oncology: A Narrative Review,” EJROPEN, ejropen.com The same scanners underpin theranostic workflows in which imaging agents double as treatment vectors, joining diagnosis and therapy in a single pathway. Removing duplicate exams cuts scheduling bottlenecks, shortens patient journeys, and lowers departmental costs. Institutions that embed hybrid imaging at the core of precision medicine programs report downstream benefits such as reduced chemotherapy waste and faster therapy titration, reinforcing a virtuous cycle of investment.
Reimbursement Expansion For Hybrid PET/CT Procedures
Separate payment for diagnostic radiopharmaceuticals priced above USD 630 now shields providers from tracer cost volatility and widens access to advanced agents.[2]Will Morton, “New CMS Plan Adds Medicare Coverage of PET Imaging Agents,” AuntMinnie, auntminnie.comMedicare coverage has also broadened to include AI-based coronary plaque analysis, validating the contribution of software to clinical decision-making.[3]Centers for Medicare & Medicaid Services, “Artificial Intelligence Enabled CT Based Quantitative Coronary Topography (AI-QCT) / Coronary Plaque Analysis (AI-CPA) (DL39913),” CMS, cms.gov Commercial insurers are quickly following CMS, creating revenue certainty that encourages hospital finance committees to green-light equipment upgrades and tracer formularies. Early adopting sites have reported double-digit volume growth in PET oncology and cardiology lines within the first full year of the new rule.
Growing Installed Base Of Digital Photon-Counting Detectors
Photon-counting technology captures individual X-ray photons and sorts them by energy, yielding higher resolution images with up to 70% dose reduction compared with legacy detectors. These scanners unlock true spectral imaging, allowing multiple contrasts in a single acquisition and eliminating many repeat or dual-energy studies. Pediatric centers and radiation-sensitive populations gain disproportionate benefit, driving early cluster adoption. As manufacturing volumes grow, unit costs are steadily falling, drawing mid-tier hospitals into the replacement cycle.
AI-Driven Workflow Optimization Lowering Total Exam Time
More than 1,000 FDA-cleared AI algorithms now support radiology, and over 70% target image interpretation or workflow steps. Automated protocol selection, on-the-fly reconstruction, and quality control cut hybrid cardiac exam time by up to half, allowing sites to handle more cases with the same scanner fleet. Worklist orchestration tools evenly distribute studies across radiologists, improving morale and reducing burnout without compromising turnaround times. These gains translate directly into better scanner utilization, one of the strongest determinants of return on capital in imaging departments.
Restraints Impact Analysis*
| Restraint | (~) % Impact on CAGR Forecast | Geographic Relevance | Impact Timeline |
|---|---|---|---|
| Global shortage of radiotracer supply chains | -0.9% | Worldwide with acute impact in Europe and North America | Short term (≤ 2 years) |
| High total cost of ownership & maintenance | -0.6% | Global with greater impact in emerging markets | Long term (≥ 4 years) |
| Limited procedural volumes outside oncology | -0.4% | Global, varying by system maturity | Medium term (2-4 years) |
| Cyber-security compliance costs for connected scanners | -0.3% | North America and Europe, expanding globally | Medium term (2-4 years) |
| Source: Mordor Intelligence | |||
Global Shortage Of Radiotracer Supply Chains
Temporary shutdowns of European reactors have removed up to 40% of global technetium-99m output, disrupting more than 40,000 U.S. procedures per day and forcing rationing of nuclear cardiology tests. Stop-gap measures such as stress-first SPECT protocols help conserve isotope supply but shift additional complexity onto departments already stretched thin. Cyclotron and linear accelerator production pathways show promise, yet scalability and regulatory hurdles will delay meaningful impact for at least two years.
High Total Cost Of Ownership & Maintenance
Hybrid scanners carry sizeable maintenance contracts, specialized parts, and software subscription costs that can equal 10-15% of original equipment price annually. Photon-counting CT demands tighter calibration and unique detector replacements, discouraging smaller hospitals from upgrading. Skilled technologist shortages compound the problem as facilities must finance ongoing training to exploit advanced features fully.
*Our forecasts treat driver/restraint impacts as directional, not additive. The impact forecasts reflect baseline growth, mix effects, and variable interactions.
Segment Analysis
By Modality: PET/CT Dominance Drives Precision Medicine Adoption
PET/CT contributed 61.28% of the hybrid imaging market share in 2024, underscoring its ingrained role in oncology staging and treatment planning. The modality benefits from broad tracer availability, streamlined workflows, and universal radiologist proficiency. Installations often pair with AI reconstruction that trims scan time and lowers dose, extending throughput.
PET/MRI, although representing a smaller installed base, is advancing at a 9.72% CAGR on the strength of superior soft-tissue contrast and negligible ionizing radiation, attributes valued in pediatric oncology and neuro-oncology. Early adopters document fewer sedation cases and more confident lesion detection in the brain, pelvis, and head-and-neck regions. SPECT/CT remains preferred for bone scintigraphy and targeted cardiac imaging where tracer cost and clinical protocols are well established. Emerging combinations such as PET/ultrasound address research niches like breast lesion characterization but remain in pilot use.


By Application: Oncology Leadership Expands Into Theranostic Applications
Oncology dominated with 73.56% of the hybrid imaging market size in 2024 thanks to universal guidelines that prescribe PET/CT for most solid tumors. Growth now comes from theranostics, where pre-therapy imaging guides radioligand dosing and follow-up scans assess biologic response.
Neurology is the fastest-growing segment at 8.36% CAGR, propelled by FDA approval of AI-assisted MRI solutions for Alzheimer’s care and new tracers for neuro-inflammation. Cardiology maintains steady expansion as PET myocardial perfusion tracers such as flurpiridaz move toward commercial launch. Orthopedic and musculoskeletal uses, particularly ultra-high-resolution photon-counting CT, are gaining clinical evidence that may broaden hybrid imaging beyond traditional domains.
By End User: Academic Centers Drive Innovation Adoption
Hospitals held 54.67% revenue in 2024, reflecting the capital intensity of hybrid scanners and procedural density required for economic viability. Large networks often deploy multi-modality suites that link PET/CT, SPECT/CT, and PET/MRI to oncology service lines.
Academic and research institutes are set to expand at 8.84% CAGR as they pilot total-body PET and evaluate next-generation tracers, reinforcing their role as technology test beds. Diagnostic imaging centers cater to outpatient referrals for oncology restaging and cardiac risk assessment, while specialty clinics—particularly neuro and endocrine centers—adopt compact PET systems optimized for focused studies.
By Detector Technology: Digital Photon-Counting Transformation Accelerates
Digital photon-counting captured 47.29% share in 2024 and is rising at 8.22% CAGR, reflecting a rapid migration from legacy energy-integrating detectors. Early clinical data show improved visualization of pulmonary nodules and coronary plaques at markedly lower dose, which resonates with value-based care mandates.
Analog scintillator systems continue in cost-constrained settings and legacy fleets but face obsolescence pressure as manufacturers sunset older platforms. Uptake of photon-counting is boosted by AI-powered spectral decomposition that produces multiple virtual contrast series from a single scan, sparing patients additional contrast injections.
By Component: Software Innovation Outpaces Hardware Replacement
Hardware led with 63.47% of the hybrid imaging market share in 2024 as scanner sales continued to anchor departmental capital spending. Even so, software is projected to grow at a 9.66% CAGR over 2025-2030, the fastest clip of any component, because AI reconstruction, quantitative analytics, and cloud collaboration lift performance without requiring new gantries. Hospitals that invest in photon-counting CT or PET/MRI increasingly bundle multi-year licensing agreements that guarantee continuous algorithm updates and cybersecurity patches, spreading costs while keeping systems state-of-the-art. Vendors link these subscriptions to proactive service contracts that monitor tube usage and detector drift in real time, reducing unplanned downtime and extending asset life. Services and maintenance, although growing more modestly, provide predictable revenue streams and reinforce brand loyalty by embedding OEM personnel and remote diagnostics in daily operations.
The software wave is also widening participation in advanced imaging by lowering the entry threshold for mid-tier facilities that can bolt AI packages onto existing scanners and gain near-premium image quality. Early adopters report up to 50% shorter cardiac PET workflows and double-digit increases in daily study volumes after deploying automated protocol selection and real-time reconstruction. These gains translate directly into improved scanner utilization, a key driver of hybrid imaging market size expansion at the provider level. As reimbursement starts to recognize the clinical value of quantitative outputs—such as plaque volume or tumor heterogeneity indices—software revenues are poised to outpace hardware replacement in absolute dollars within the forecast period.
Geography Analysis
North America retained 36.66% of global revenue in 2024 on the back of early reimbursement reforms and strong precision-oncology programs. Federal support for isotope production combined with rapid photon-counting CT approvals sustains a replacement wave. AI startups clustered around academic medical centers supply workflow tools that reinforce domestic technology leadership.
Europe forms the second-largest revenue pool, shaped by Medical Device Regulation alignment and pending AI Act requirements that raise compliance costs yet create clear market rules. Reactor outages expose isotope supply fragility, but EU grants targeting sustainable production and helium-free MRI aim to balance risk. Clinicians highlight energy-efficient scanner demand in line with carbon-reduction commitments.
Asia-Pacific posts the fastest regional CAGR at 7.38%, anchored by China’s installation of 16 total-body PET systems and expanding tertiary hospital networks. Regulatory modernization in Japan, South Korea, and India accelerates approvals of photon-counting CT and AI software, while government insurance in South Korea broadens access to PET tracers. Emerging economies in Southeast Asia allocate infrastructure budgets to hybrid imaging to manage rising cancer incidence, although high capital cost remains a hurdle.

Competitive Landscape
The hybrid imaging market shows moderate concentration. GE HealthCare, Siemens Healthineers, and Philips command multi-modality portfolios and deep service networks, leveraging scale to negotiate enterprise-wide equipment renewals. Recent launches such as GE’s Revolution Vibe CT with one-beat cardiac imaging integrate AI algorithms at the console, tightening hardware-software synergy.
In software, nimble firms like Cleerly and iCAD specialize in disease-specific analytics, often partnering with scanner OEMs to fast-track clinical integration. RadNet’s USD 103 million acquisition of iCAD extends AI mammography to 1,700 sites, illustrating how service providers are acquiring technology to differentiate volume-driven businesses.
White-space innovation emerges around point-of-care PET and compact brain-dedicated scanners. Positrigo’s FDA-cleared NeuroLF demonstrates a push into affordable specialty devices that could decentralize certain hybrid imaging services. Meanwhile, partnerships between OEMs and cloud providers target longitudinal data aggregation to support population-scale analytics.
Hybrid Imaging Industry Leaders
GE HealthCare
Siemens Healthineers
Koninklijke Philips N.V.
Canon Medical Systems
United Imaging Healthcare
- *Disclaimer: Major Players sorted in no particular order

Recent Industry Developments
- May 2025: SHINE Technologies announced the acquisition of Lantheus' SPECT imaging business, expanding its nuclear medicine footprint beyond Mo-99 production.
- May 2025: MR Solutions installed the world’s first high-field 7T SPECT/MR system with a detachable PET insert at Houston Methodist, creating the first tri-modality preclinical platform.
- April 2025: RadNet completed its USD 103 million purchase of iCAD, extending AI breast-imaging tools to a global mammography network.
- March 2025: Canon Medical Systems received FDA clearance for the Adora DRFi automated radiography-fluoroscopy hybrid solution.


Global Hybrid Imaging Market Report Scope
| PET/CT |
| SPECT/CT |
| PET/MRI |
| Other Hybrid Systems (PET/Ultrasound, Trimodality) |
| Oncology |
| Cardiology |
| Neurology |
| Orthopaedics & Musculoskeletal |
| Other Clinical Applications |
| Hospitals |
| Diagnostic Imaging Centres |
| Academic & Research Institutes |
| Specialty Clinics |
| Digital Photon-Counting |
| Analog Scintillator-based |
| Hardware |
| Software |
| Services & Maintenance Contracts |
| North America | United States |
| Canada | |
| Mexico | |
| Europe | Germany |
| United Kingdom | |
| France | |
| Italy | |
| Spain | |
| Rest of Europe | |
| Asia-Pacific | China |
| Japan | |
| India | |
| Australia | |
| South Korea | |
| Rest of Asia-Pacific | |
| Middle East and Africa | GCC |
| South Africa | |
| Rest of Middle East and Africa | |
| South America | Brazil |
| Argentina | |
| Rest of South America |
| By Modality | PET/CT | |
| SPECT/CT | ||
| PET/MRI | ||
| Other Hybrid Systems (PET/Ultrasound, Trimodality) | ||
| By Application | Oncology | |
| Cardiology | ||
| Neurology | ||
| Orthopaedics & Musculoskeletal | ||
| Other Clinical Applications | ||
| By End User | Hospitals | |
| Diagnostic Imaging Centres | ||
| Academic & Research Institutes | ||
| Specialty Clinics | ||
| By Detector Technology | Digital Photon-Counting | |
| Analog Scintillator-based | ||
| By Component | Hardware | |
| Software | ||
| Services & Maintenance Contracts | ||
| By Geography | North America | United States |
| Canada | ||
| Mexico | ||
| Europe | Germany | |
| United Kingdom | ||
| France | ||
| Italy | ||
| Spain | ||
| Rest of Europe | ||
| Asia-Pacific | China | |
| Japan | ||
| India | ||
| Australia | ||
| South Korea | ||
| Rest of Asia-Pacific | ||
| Middle East and Africa | GCC | |
| South Africa | ||
| Rest of Middle East and Africa | ||
| South America | Brazil | |
| Argentina | ||
| Rest of South America | ||


Key Questions Answered in the Report
What is the forecast value of global hybrid imaging through 2030?
The market is expected to reach USD 11.82 billion by 2030, reflecting a 5.62% CAGR from 2025.
Which modality currently leads in installed base and revenue?
PET/CT systems hold 61.28% of revenue owing to entrenched oncology workflows and mature reimbursement.
Why is photon-counting CT important for hybrid imaging?
Photon-counting detectors raise spatial resolution and cut radiation dose up to 70%, making hybrid scans safer and more informative.
How are reimbursement changes influencing adoption?
Separate payment for high-cost PET tracers and AI analysis has improved margins for providers, accelerating scanner upgrades and scan volumes.
Which region is growing fastest?
Asia-Pacific is posting the highest CAGR at 7.38% due to infrastructure expansion and regulatory modernization.
What factor most limits non-oncology hybrid imaging growth?
Limited procedural volume in cardiology and neurology relative to oncology makes it harder for centers to justify capital spend outside cancer care.
Page last updated on:


