Imaging Agents Market Size and Share
Market Overview
| Study Period | 2019 - 2030 |
|---|---|
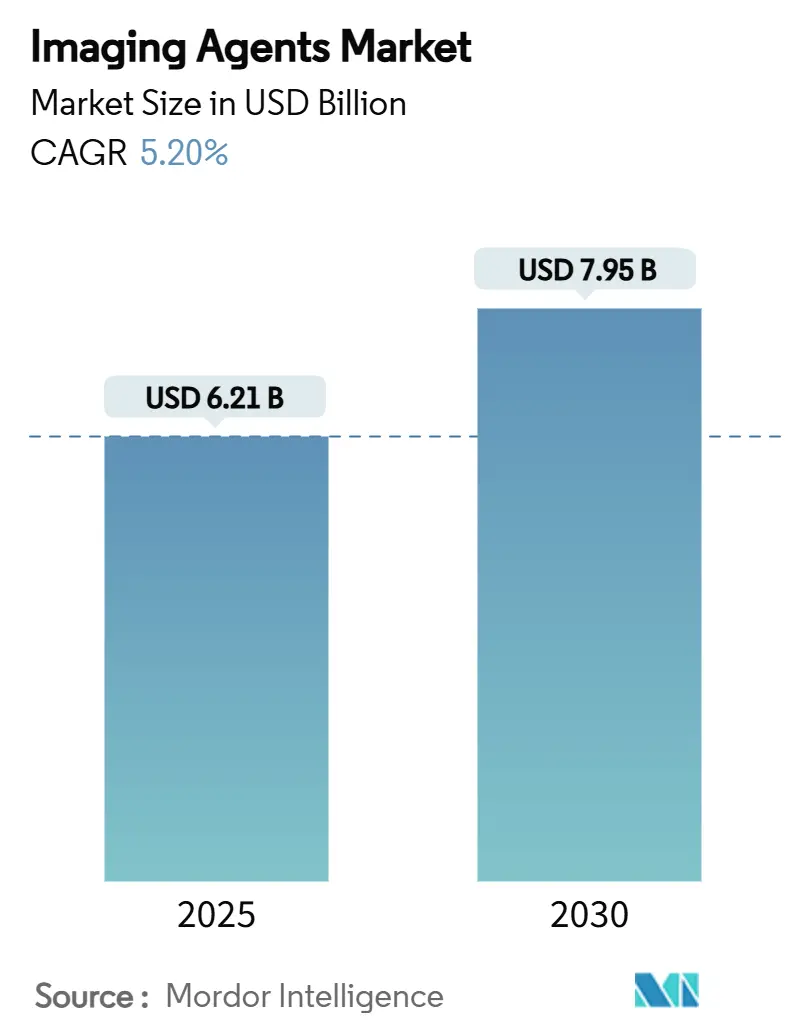
| Market Size (2025) | USD 6.21 Billion |
| Market Size (2030) | USD 7.95 Billion |
| Growth Rate (2025 - 2030) | 5.20% CAGR |
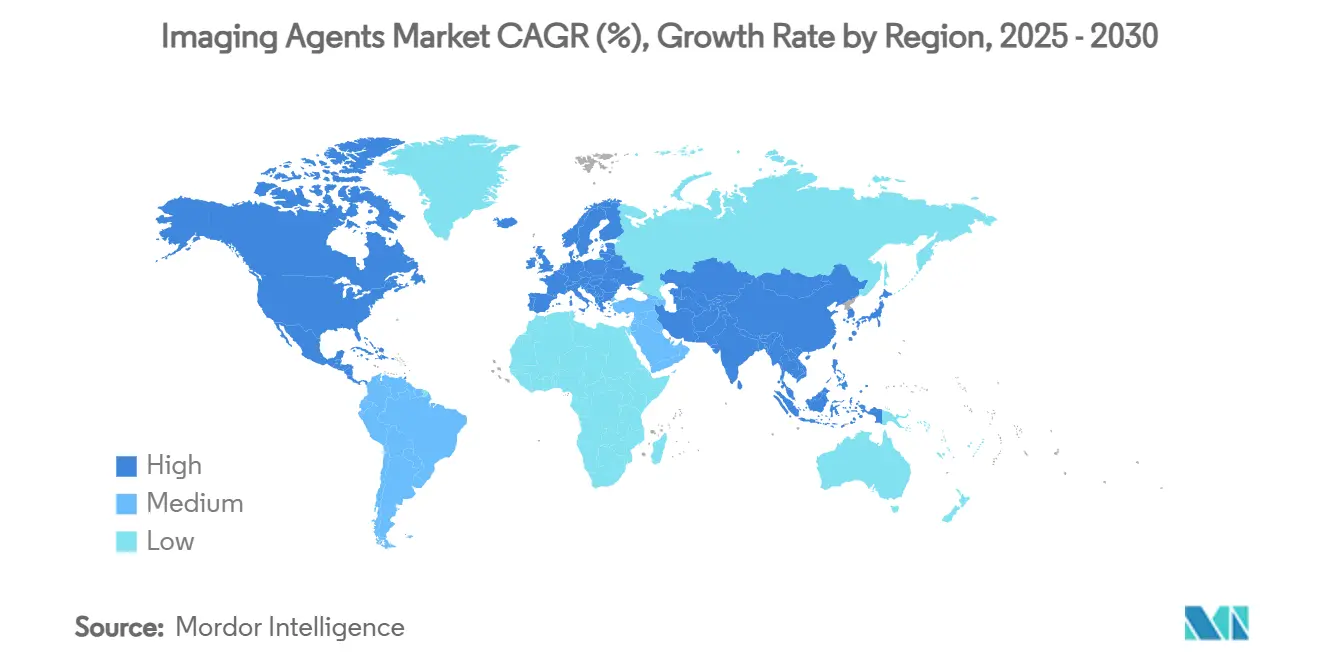
| Fastest Growing Market | Asia Pacific |
| Largest Market | North America |
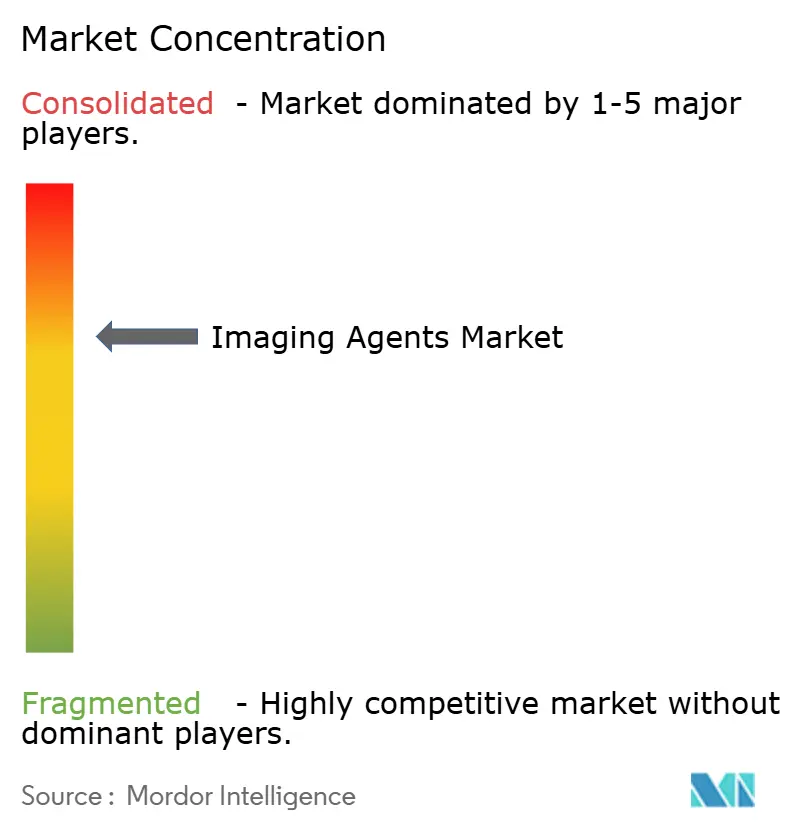
| Market Concentration | Medium |
Major Players *Disclaimer: Major Players sorted in no particular order Image © Mordor Intelligence. Reuse requires attribution under CC BY 4.0. | |
Imaging Agents Market Analysis by Mordor Intelligence
The imaging agents market size stood at USD 6.21 billion in 2025, and it is forecast to attain USD 7.95 billion by 2030 at a 5.2% CAGR. Demand resilience is anchored in the modality-agnostic role of contrast agents, expanding procedure volumes tied to chronic disease prevalence, and continuous hardware innovation that lifts diagnostic accuracy while lowering dose exposure. Asia Pacific registers the quickest expansion, propelled by hospital build-outs and rapid adoption of advanced CT and PET technologies, whereas North America retains a 35.9% revenue share through entrenched clinical protocols and reimbursement support. Product innovation is accelerating in nanoparticle and high-relaxivity formulations that satisfy new low-dose mandates and capitalize on photon-counting CT’s spectral capabilities. Competitive momentum is shifting toward firms that bundle AI-enabled image-optimization software with proprietary agents, helping providers manage cost and sustainability constraints while maintaining image quality.
Key Report Takeaways
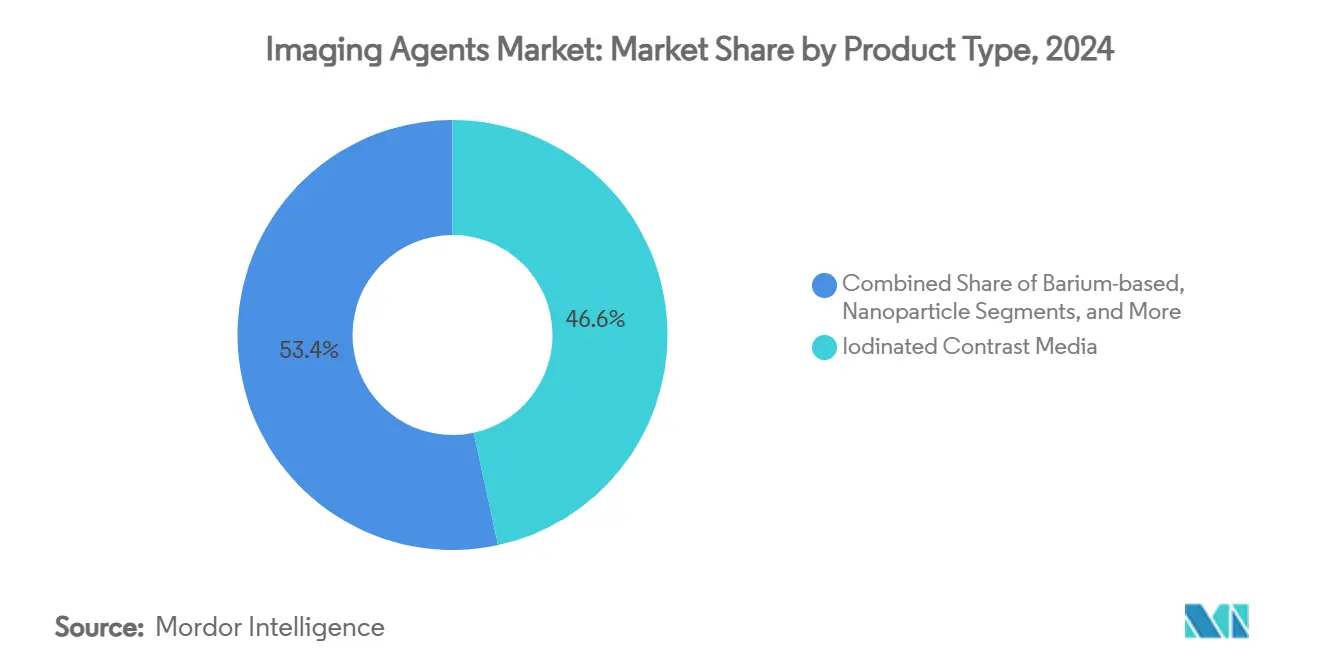
- By product type, iodinated media held 46.6% of the imaging agents market share in 2024, while nanoparticle and other emerging agents are forecast to record the fastest 6.5% CAGR through 2030.
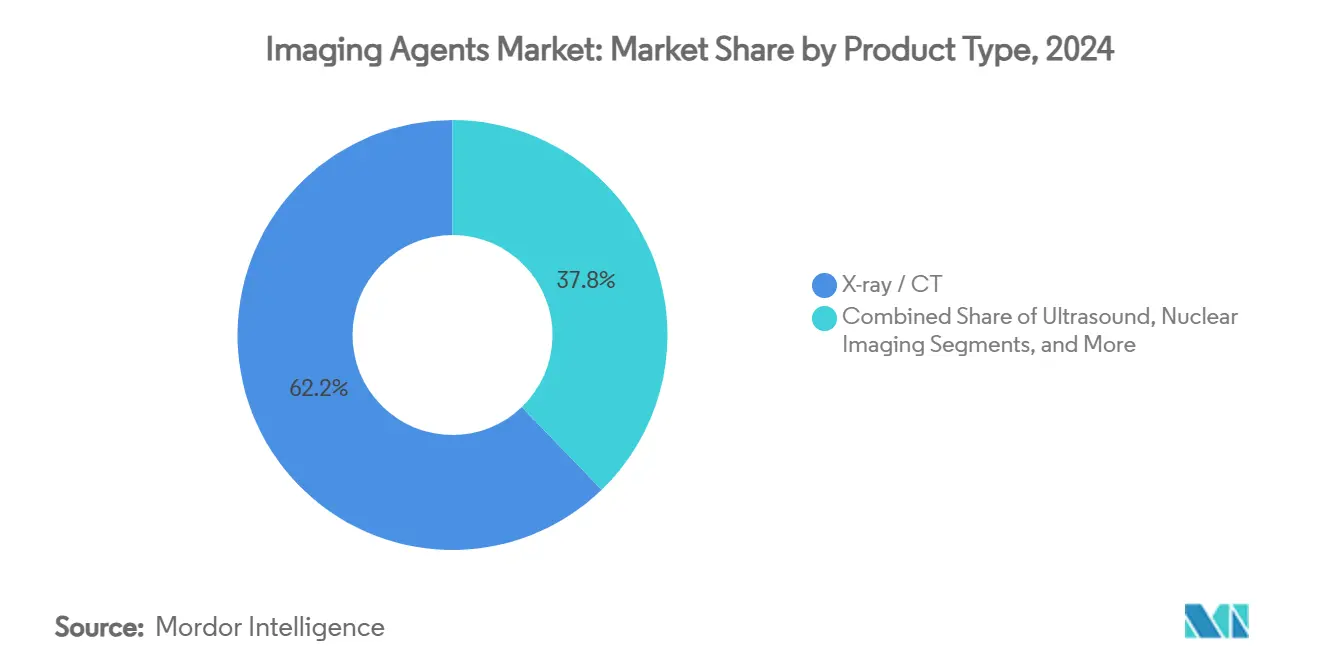
- By imaging modality, X-ray/CT dominated with 62.2% share of the imaging agents market size in 2024; photon-counting CT and hybrid systems are projected to grow at 5.1% CAGR to 2030.
- By geography, North America captured 35.9% revenue share in 2024; Asia Pacific is advancing at a 6.1% CAGR through 2030.
Global Imaging Agents Market Trends and Insights
Drivers Impact Analysis*
| Driver | (~) % Impact on CAGR Forecast | Geographic Relevance | Impact Timeline |
|---|---|---|---|
| Rapid Rise Of Chronic Diseases & Imaging Procedure Volumes | +1.20% | Global, with APAC leading growth | Medium term (2-4 years) |
| Continuous Modality Innovations Enabling Low-Dose, High-Definition Scans | +0.80% | North America & EU, expanding to APAC | Long term (≥ 4 years) |
| Growing Geriatric Population With Complex Diagnostic Needs | +1.00% | Global, concentrated in developed markets | Long term (≥ 4 years) |
| Expanding Minimally-Invasive, Image-Guided Interventions | +0.70% | North America & EU, emerging in APAC | Medium term (2-4 years) |
| Photon-Counting CT Unlocking Demand For Novel High-Z Contrast Agents | +0.50% | North America & EU early adoption | Long term (≥ 4 years) |
| Sustainability Push Toward Micro-Dose & Recyclable Contrast Formulations | +0.30% | EU leading, global expansion | Long term (≥ 4 years) |
| Source: Mordor Intelligence | |||
Rapid Rise of Chronic Diseases & Imaging Procedure Volumes
Rising global incidence of cardiovascular disease, diabetes, and cancer is translating into more frequent contrast-enhanced imaging requests across modalities. Elderly cohorts generate the highest per-capita utilization, compelling providers to adopt patient-specific dosing pathways that mitigate nephrotoxic risk while safeguarding image quality. Hospitals now monitor renal biomarkers pre-procedure and routinely switch to macrocyclic or micro-dose alternatives for at-risk patients.[1]Jeffrey J. Brown, “AI Solutions to the Radiology Workforce Shortage,” npj Health Systems, nature.comVendors that supply safer, high-efficacy formulations are positioned to capture protocol-based preference, strengthening recurring revenue in both inpatient and outpatient settings.
Continuous Modality Innovations Enabling Low-Dose, High-Definition Scans
Photon-counting CT detectors and advanced MRI sequences deliver superior contrast-to-noise at up to 50% lower iodine or gadolinium volumes compared with legacy systems. AI-assisted bolus-tracking software further automates timing, curbing waste and enabling tailored micro-durations per patient. Providers consequently shift procurement criteria from milliliter price to cost-per-diagnosis, rewarding suppliers with premium, high-relaxivity agents that deliver equal enhancement at a smaller dose.
Growing Geriatric Population With Complex Diagnostic Needs
Population aging drives sustained imaging demand because people older than 65 undergo scans three to four times more often than younger cohorts. Polypharmacy and chronic comorbidities complicate contrast selection, prompting research into manganese-based MRI agents and iso-osmolar iodinated solutions. Health-system spend audits show imaging costs peak between 80 and 85 years, aligning with the largest demographic wave entering that bracket.[2]Kate Hanneman, “Energy and Greenhouse Gas Emission Savings Associated with Implementation of an Abbreviated Cardiac MRI Protocol,” rsna.org Firms capable of proving reduced adverse-event rates in elderly studies gain formulary preference.
Expanding Minimally-Invasive, Image-Guided Interventions
Growth of interventional radiology extends the imaging agents market beyond diagnostics. Procedures such as prostate artery embolization and transcatheter valve replacement require specialty viscosities and rapid wash-out kinetics, commanding higher per-unit margins. Integrated device-contrast kits create practice loyalty and help vendors defend price despite tender pressure.
Restraints Impact Analysis*
| Restraint | (~) % Impact on CAGR Forecast | Geographic Relevance | Impact Timeline |
|---|---|---|---|
| Safety Concerns & Regulatory Curbs On Gadolinium And Iodinated Agents | -0.80% | Global, EU leading restrictions | Short term (≤ 2 years) |
| Price Pressures From Reimbursement Cuts & Hospital Tenders | -0.60% | North America & EU primarily | Medium term (2-4 years) |
| Emerging Environmental Rules On Iodinated Waste Streams | -0.40% | EU leading, expanding globally | Medium term (2-4 years) |
| Iodine Feed-Stock & Trade-Tariff Driven Supply-Chain Volatility | -0.30% | Global, concentrated in Asia Pacific | Short term (≤ 2 years) |
| Source: Mordor Intelligence | |||
Safety Concerns & Regulatory Curbs on Gadolinium and Iodinated Agents
The European Medicines Agency now restricts linear gadolinium chelates, while hospitals adopt mandatory informed-consent forms that flag retention risks.[3]Carlo C. Quattrocchi et al., “ESR Essentials: Gadolinium-Wise MRI—Practice Recommendations by the European Society for Magnetic Resonance in Medicine and Biology,” springer.com Similar scrutiny surrounds iodinated agents in renally impaired patients, prompting dose minimization and substitution with carbon dioxide angiography where feasible. Suppliers with diversified portfolios are partially insulated, yet near-term demand softening weighs on aggregate volumes.
Price Pressures from Reimbursement Cuts & Hospital Tenders
Group purchasing organizations negotiate multi-year framework agreements that compress prices for commodity iodinated agents. Although CMS unbundled high-cost radiopharmaceutical payments above USD 630, hospitals use transparent fee schedules to benchmark discounts on standard agents. Vendors respond by layering AI-enhanced image optimization and field-service guarantees to preserve net price.
*Our forecasts treat driver/restraint impacts as directional, not additive. The impact forecasts reflect baseline growth, mix effects, and variable interactions.
Segment Analysis
By Product Type: Nanoparticles Drive Innovation Despite Iodinated Dominance
Iodinated media continued to deliver 46.6% of imaging agents' market share in 2024, backed by deep clinical familiarity and ubiquitous CT utilization. Even so, regulatory scrutiny and dose-reduction imperatives curtail growth momentum, creating white space for alternatives. Gadolinium products remain the second-largest revenue contributor, though policy-driven dose caps in Europe restrain volume expansion. Microbubble ultrasound agents serve cardiac and hepatic niches with predictable but limited uptake. The fastest-advancing category is nanoparticles and other emerging formulations, expanding at 6.5% CAGR as developers secure FDA approvals for manganese-based MRI and PSMA-targeted PET tracers. If early clinical adoption continues, nanoparticles could command a disproportionate share of value despite smaller volume contribution, reinforcing the innovation thesis underpinning long-term market resilience.
Second-order effects include supply-chain recalibration to handle novel raw materials and cold-chain requirements. Vendors that integrate vertically, forging isotope-production joint ventures or acquiring radiopharmacies, secure margin and distribution control. Health-technology-assessment bodies increasingly rely on cost-effectiveness data rather than acquisition price alone, favoring targeted agents that eliminate downstream interventions. Providers in high-volume centers leverage automated injectors with RFID-tagged vials to minimize wastage, indirectly boosting demand for premium single-patient doses that assure traceability and reimbursement compliance


By Imaging Modality: Photon-Counting CT Reshapes Traditional Hierarchies
X-ray/CT retained 62.2% share of imaging agents market size in 2024, cemented by emergency-department ubiquity and the modality’s speed advantage. However, prospective replacement of energy-integrating detectors with photon-counting variants is altering dose paradigms and elemental specificity. Early adopter sites report 15% reduction in contrast volume per study alongside improved plaque characterization, prompting vendors to launch high-Z prototypes optimized for multi-energy bins. MRI holds the second-largest slice, yet gadolinium concerns motivate trials of iron-oxide and manganese chelates that dovetail with low-field systems. Ultrasound microbubbles stay confined to echocardiography and hepatic lesion characterization, whereas nuclear medicine advances in F-18 and Ga-68 labeled tracers secure separate reimbursement and fuel procedural growth.
Hybrid technologies that blend CT attenuation correction with PET functional mapping tighten interdependence between agent and hardware design. Vendors offering harmonized kits of PET tracers and CT contrast capitalise on this convergence, improving scan efficiency and patient throughput. Economic incentives, such as the recently doubled reimbursement for cardiac CT angiography, accelerate modality shift and indirectly spur specialized contrast demand.
Geography Analysis
North America anchored 35.9% of revenue in 2024 and remains the prime locus for AI-enabled dose-optimization rollouts and expedited radiopharmaceutical approvals. Value-based care directives stimulate the procurement of agents proven to lower follow-up imaging. Europe mirrors these dynamics but overlays stringent environmental and safety norms that reshape product mix and packaging innovation.
The imaging agents market size for Asia Pacific is projected to increase significantly as tertiary hospitals proliferate and the government plans to triple nuclear medicine capacity in China by 2035. Multinationals frequently partner with local cyclotron operators to navigate distribution regulations and ensure radionuclide availability.
South America remains bifurcated; Brazil introduces PET reimbursement codes that spur private-sector installations, while Argentina and Colombia struggle with currency volatility that hampers import affordability. Middle East & Africa gain modest traction through Gulf-state investments in cancer centers, yet widespread adoption awaits expanded insurance coverage. Across emerging regions, scalable pricing tiers and vial-sharing programs enhance accessibility without eroding premium positioning in developed markets. Vendors fine-tune regulatory filings to reflect divergent pharmacovigilance requirements, shortening time-to-market and locking in early formulary wins.

Competitive Landscape
Consolidation is moderate, with the top five suppliers controlling roughly 68% of global revenue, attributed to extensive manufacturing capacity, exclusive patents, and long-standing hospital contracts. Bracco, GE HealthCare, and Guerbet lead iodinated and gadolinium segments, whereas Telix, Novartis’ Advanced Accelerator Applications, and Lantheus outperform in radiopharmaceutical niches. Competitive vectors pivot on product diversification, AI-enabled image enhancement, and end-to-end service bundles that extend beyond vials to include injectors, informatics, and protocol training. Sustainability credentials have emerged as a differentiator in European tenders, prompting manufacturers to redesign packaging with recyclable polymers and to trial gadolinium recovery programs.
Strategic investment patterns underscore a shift toward radiometal production infrastructure and digital ecosystems. Telix’s USD 250 million acquisition of RLS Radiopharmacies secured a nationwide U.S. dispensing network for short-half-life tracers, reducing last-mile bottlenecks and elevating customer stickiness. GE HealthCare’s collaboration with AWS to build generative-AI diagnostic tools signals intent to augment contrast agents with automated lesion detection, fostering a virtuous cycle of richer images and dosing efficiency. Price competition in commoditized iodinated categories persists but is partially offset by the margin uplift from premium micro-dose and theranostic agents.
Barriers to entry remain high due to GMP manufacturing requirements, isotope supply constraints, and capital-intensive trial programs. Nevertheless, venture-backed startups exploiting nanoparticle technology or chelate-free MRI alternatives attract funding by targeting niche indications with orphan-drug-like dynamics that promise accelerated regulatory review and premium pricing.
Imaging Agents Industry Leaders
GE Healthcare
Bayer AG
Bracco Imaging SpA
Guerbet Group
Lantheus Medical Imaging
- *Disclaimer: Major Players sorted in no particular order

Recent Industry Developments
- March 2025: FDA approved Gozellix (TLX007-CDx) as a PSMA-PET agent with extended shelf life.
- February 2025: FDA accepted BLA for TLX250-CDx (Zircaix) for kidney cancer imaging and granted priority review.
- October 2024: FDA cleared Bracco Diagnostics’ AiMIFY AI software that doubles contrast enhancement in brain MRI.


Global Imaging Agents Market Report Scope
| Iodinated Contrast Media |
| Gadolinium-based Contrast Media |
| Microbubble Ultrasound Contrast |
| Barium-based Contrast Media |
| Nanoparticle & Other Emerging Agents |
| X-ray / CT |
| Magnetic Resonance Imaging (MRI) |
| Ultrasound |
| Nuclear Imaging (PET / SPECT) |
| Others |
| North America | United States |
| Canada | |
| Mexico | |
| Europe | Germany |
| United Kingdom | |
| France | |
| Italy | |
| Spain | |
| Rest of Europe | |
| Asia Pacific | China |
| Japan | |
| India | |
| South Korea | |
| Australia | |
| Rest of Asia Pacific | |
| Middle East & Africa | GCC |
| South Africa | |
| Rest of Middle East & Africa | |
| South America | Brazil |
| Argentina | |
| Rest of South America |
| By Product Type | Iodinated Contrast Media | |
| Gadolinium-based Contrast Media | ||
| Microbubble Ultrasound Contrast | ||
| Barium-based Contrast Media | ||
| Nanoparticle & Other Emerging Agents | ||
| By Imaging Modality | X-ray / CT | |
| Magnetic Resonance Imaging (MRI) | ||
| Ultrasound | ||
| Nuclear Imaging (PET / SPECT) | ||
| Others | ||
| By Geography | North America | United States |
| Canada | ||
| Mexico | ||
| Europe | Germany | |
| United Kingdom | ||
| France | ||
| Italy | ||
| Spain | ||
| Rest of Europe | ||
| Asia Pacific | China | |
| Japan | ||
| India | ||
| South Korea | ||
| Australia | ||
| Rest of Asia Pacific | ||
| Middle East & Africa | GCC | |
| South Africa | ||
| Rest of Middle East & Africa | ||
| South America | Brazil | |
| Argentina | ||
| Rest of South America | ||


Key Questions Answered in the Report
What revenue is projected for global imaging agents by 2030?
The market is forecast to reach USD 7,954.87 million by 2030.
Which region is expanding the fastest?
Asia Pacific is advancing at a 6.1% CAGR through 2030, outpacing all other regions.
How large is the iodinated contrast segment today?
Iodinated media held 46.6% imaging agents market share in 2024.
What new imaging technology most influences agent development?
Photon-counting CT is reshaping contrast requirements by enabling spectral imaging at lower doses.
Which company reported the highest recent growth?
Telix Pharmaceuticals posted 63% year-over-year revenue growth in Q2 2025.
What policy change boosted high-cost radiopharmaceutical reimbursement?
CMS unbundled payments for diagnostic radiopharmaceuticals above USD 630 per procedure in November 2024.
Page last updated on:


