Market Overview
| Study Period | 2020 - 2031 |
|---|---|
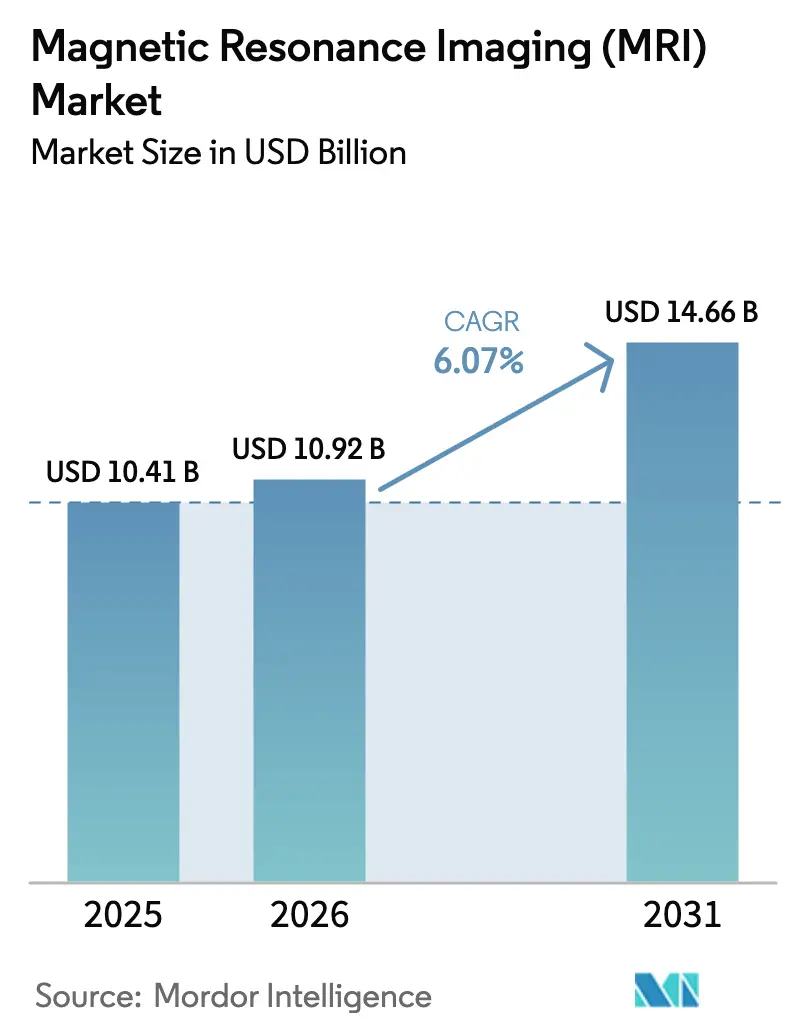
| Market Size (2026) | USD 10.92 Billion |
| Market Size (2031) | USD 14.66 Billion |
| Growth Rate (2026 - 2031) | 6.07% CAGR |
| Fastest Growing Market | Asia Pacific |
| Largest Market | North America |
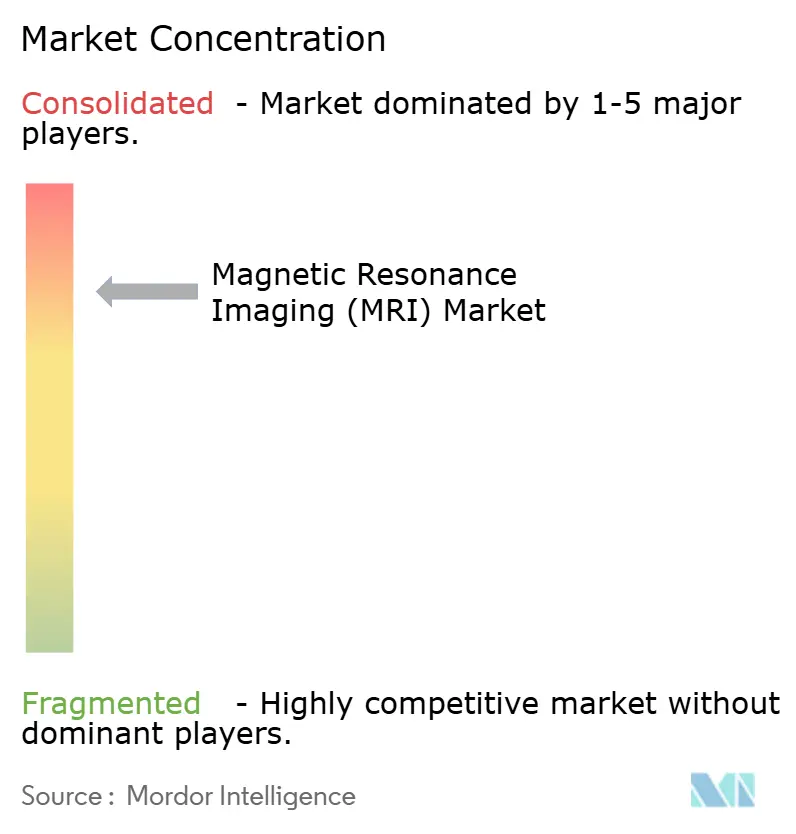
| Market Concentration | High |
Major Players *Disclaimer: Major Players sorted in no particular order Image © Mordor Intelligence. Reuse requires attribution under CC BY 4.0. | |
Magnetic Resonance Imaging (MRI) Market Analysis by Mordor Intelligence
The Magnetic Resonance Imaging Market size is projected to be USD 10.41 billion in 2025, USD 10.92 billion in 2026, and reach USD 14.66 billion by 2031, growing at a CAGR of 6.07% from 2026 to 2031.
Faster software-driven reconstruction, helium-free magnets, and portable low-field platforms are lowering ownership costs and broadening clinical settings from academic hospitals to rural mobile units. Regulatory clearances for point-of-care systems and AI algorithms are turning once-experimental concepts into reimbursable standards, while aging populations and chronic-disease surveillance continue to propel scan volumes. Vendor strategy is shifting toward upgradeable hardware and subscription-based software, allowing facilities to extend replacement cycles without sacrificing image quality, even as helium supply shortages and staffing challenges create operational headwinds.
Key Report Takeaways
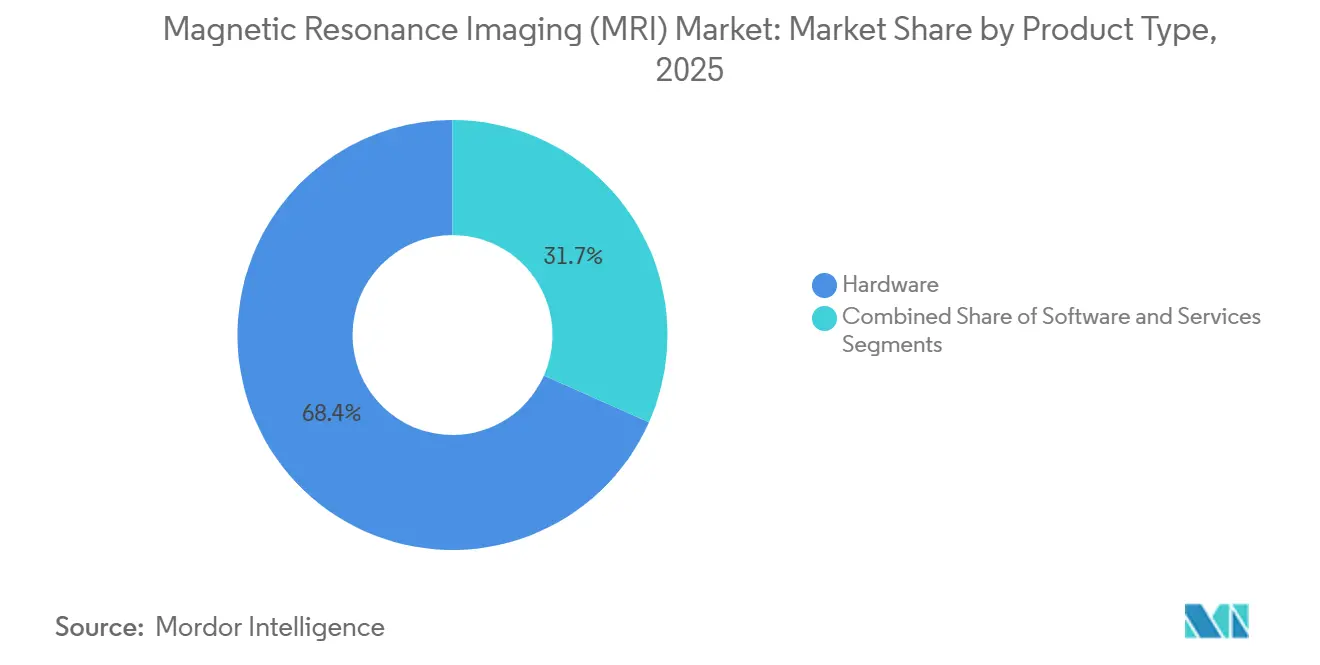
- By product type, hardware led with a 68.35% revenue share in 2025, whereas software is forecast to advance at a 10.55% CAGR through 2031.
- By architecture, closed systems held 74.24% of the 2025 base, while open systems are expected to grow at an 8.34% CAGR to 2031.
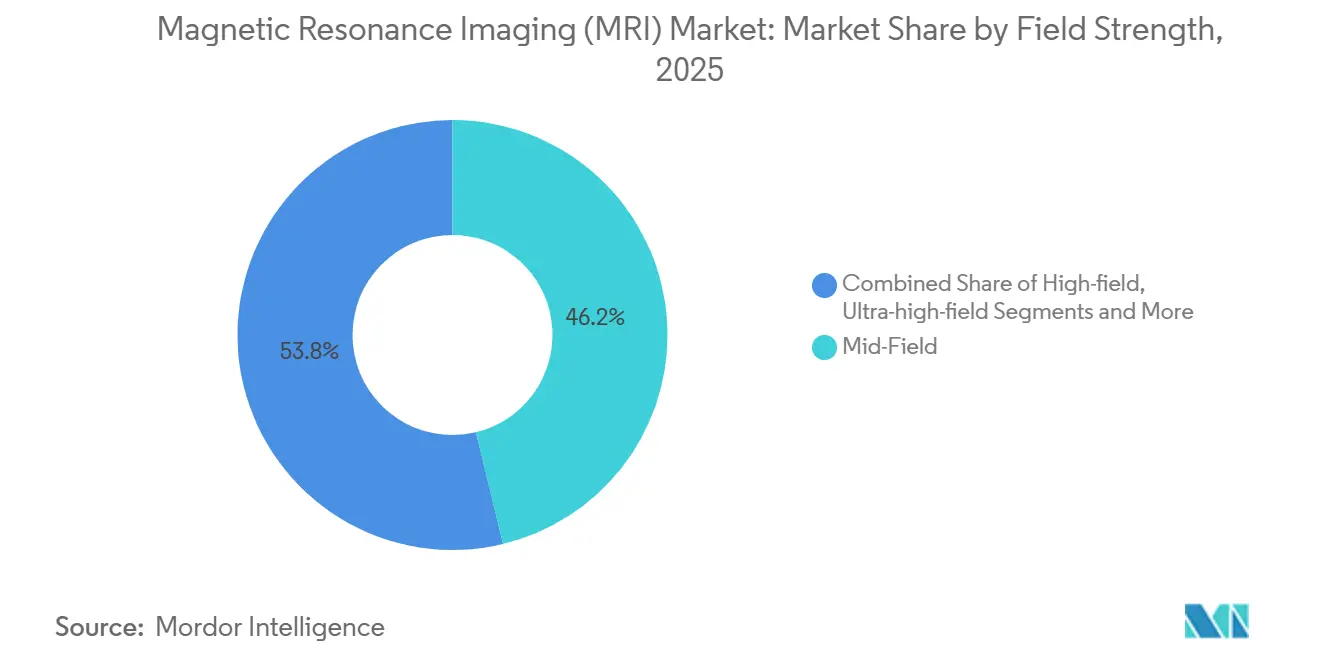
- By field strength, mid-field scanners accounted for a 46.23% share in 2025; high-field 3 T systems are set to expand at a 7.25% CAGR.
- By application, neurology captured 33.75% revenue in 2025, yet cardiology is projected to rise at an 8.02% CAGR through 2031.
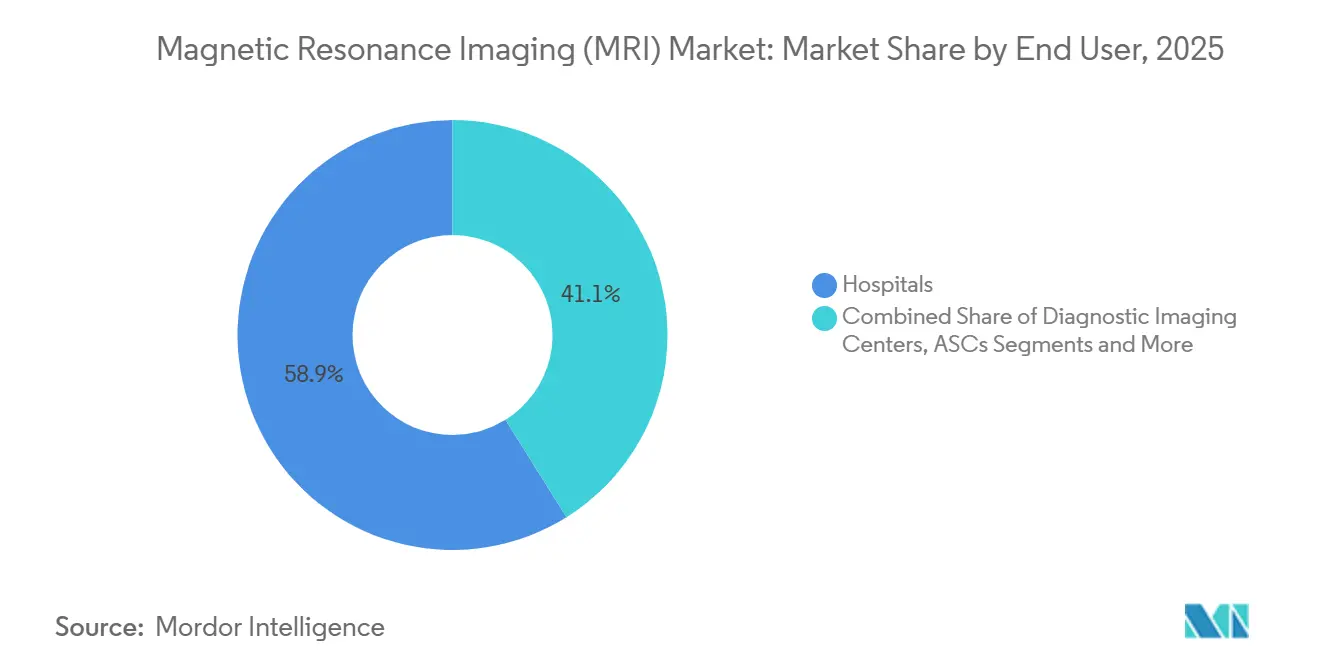
- By end user, hospitals retained 58.89% revenue in 2025, but ambulatory surgical centers should climb at a 9.03% CAGR.
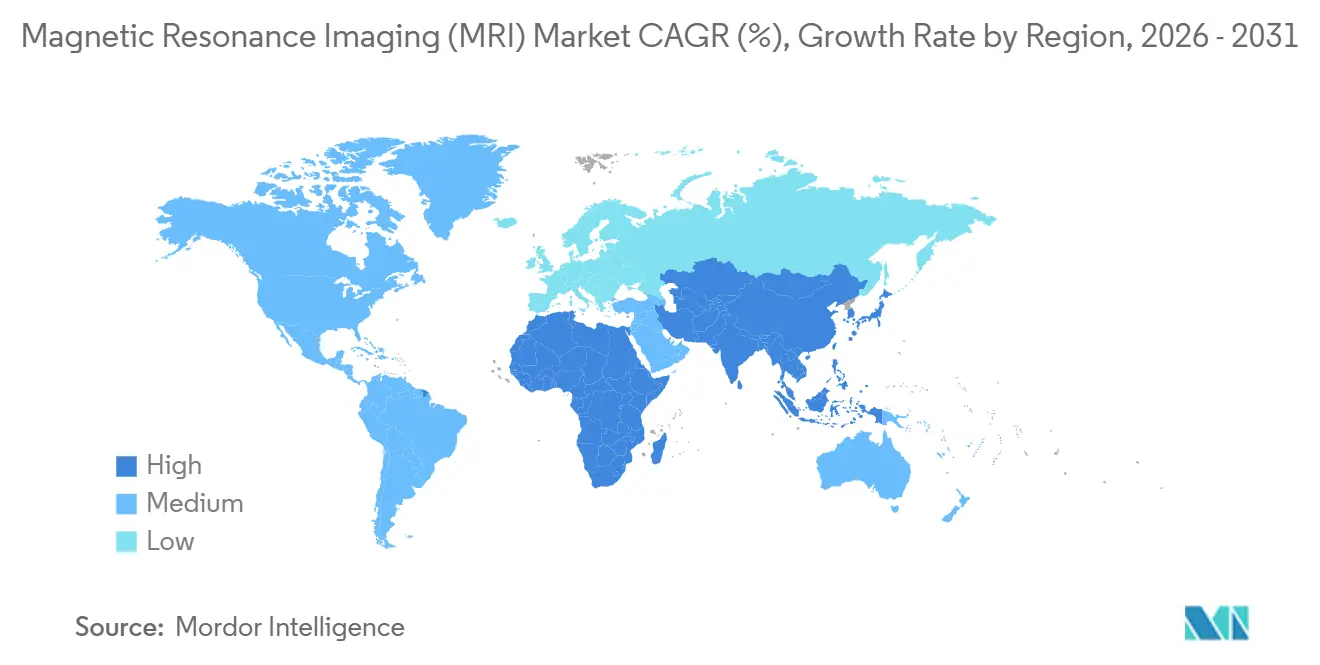
- By geography, North America contributed 37.86% of 2025 revenue, while Asia-Pacific is poised for an 8.91% CAGR to 2031.
Note: Market size and forecast figures in this report are generated using Mordor Intelligence’s proprietary estimation framework, updated with the latest available data and insights as of January 2026.
Global Magnetic Resonance Imaging (MRI) Market Trends and Insights
Drivers Impact Analysis*
| Driver | (~) % Impact on CAGR Forecast | Geographic Relevance | Impact Timeline |
|---|---|---|---|
| Rising Chronic-Disease Imaging Demand | +1.2% | North America, Europe, aging APAC markets | Long term (≥ 4 years) |
| Expanding Geriatric Population Base | +1.0% | Japan, Germany, Italy, U.S. Sunbelt states | Long term (≥ 4 years) |
| AI-Enhanced High-Field MRI Innovations | +1.3% | North America, Europe, APAC | Medium term (2-4 years) |
| Helium-Free Upgradeable Magnet Platforms | +0.9% | Helium-import-dependent regions in MEA & Southeast Asia | Medium term (2-4 years) |
| Portable/Point-of-Care Low-Field MRI | +0.8% | Rural U.S., APAC tier-2 and tier-3 cities, Sub-Saharan Africa | Medium term (2-4 years) |
| Proliferation of Outpatient Imaging Centers | +0.7% | North America, Western Europe | Short term (≤ 2 years) |
| Source: Mordor Intelligence | |||
Rising Chronic-Disease Imaging Demand
Non-communicable diseases caused 74% of global deaths in 2024, pushing clinicians to favor MRI’s radiation-free profile for repeat monitoring. Cardiac MRI is displacing nuclear stress tests after studies showed gadolinium-enhanced protocols reduce false positives by 40%.[1]Steve R. Ommen, “2024 AHA/ACC/AMSSM/HRS/PACES/SCMR Guideline for the Management of Hypertrophic Cardiomyopathy,” Circulation, ahajournals.org Oncology teams now rely on diffusion-weighted and dynamic contrast-enhanced sequences to track tumor response sooner than CT can reveal anatomic change. Neurologists use 7 T systems to visualize lesions invisible at 1.5 T, integrating MRI as a lifelong biomarker platform rather than a one-off diagnostic. This clinical migration embeds recurring volumes into the Magnetic Resonance Imaging market.
Expanding Geriatric Population Base
The population aged 65 years and higher globally is projected to reach 2.2 billion by the late 2070s. By the mid-2030s, it is projected that there will be 265 million persons aged 80 years or older.[2]United Nations Department of Economic and Social Affairs, “World Population Prospects 2024: Summary of Results,” United Nations, un.org Orthopedic MRI demand is accelerating as surgeons need precise joint images before replacements, and dementia prevalence is doubling every two decades, requiring amyloid-sensitive sequences to guide disease-modifying drugs approved in 2024. Elderly patients prefer MRI over CT to avoid ionizing radiation, although frailty elongates acquisition time, making AI-accelerated protocols crucial to maintain throughput. These factors collectively enlarge the Magnetic Resonance Imaging market.
AI-Enhanced High-Field MRI Innovations
Deep learning reconstruction trims brain and spine scan times by up to 60% while maintaining >95% diagnostic confidence, as shown with Siemens Deep Resolve in 2024.[3]Siemens Healthineers, “Deep Resolve: Unrivaled Speed in MRI,” Siemens Healthineers, siemens-healthineers.com Canon’s AiCE leverages 10 million annotated images to deliver sub-1 mm isotropic musculoskeletal studies without extra scan time. GE’s AIR Recon DL processes k-space directly, recovering signal previously lost to motion. These tools let a 1.5 T magnet emulate near-3 T performance, shifting differentiation in the Magnetic Resonance Imaging market from magnet strength to algorithm strength.
Helium-Free Upgradeable Magnet Platforms
Spot helium surpassed USD 30 per liter in 2024 following geopolitical supply shocks, tripling refill costs. Siemens DryCool eliminated 1,500 liters per system, saving USD 50,000 annually. Philips BlueSeal cuts helium to 7 liters, enabling sites without cryogen infrastructure. GE’s Freelium retrofit extends refill intervals to a decade. These advances reduce ownership costs and speed upgrades, reinforcing expansion of the Magnetic Resonance Imaging market.
Restraints Impact Analysis*
| Restraint | (~) % Impact on CAGR Forecast | Geographic Relevance | Impact Timeline |
|---|---|---|---|
| High Capital & Service Costs | -0.8% | Price-sensitive APAC and MEA markets | Long term (≥ 4 years) |
| Reimbursement-Pressure Headwinds | -0.6% | North America, Europe | Medium term (2-4 years) |
| Helium-Supply Uncertainty | -0.4% | Helium-import-dependent regions | Short term (≤ 2 years) |
| Shortage of MRI Technologists & Radiologists | -0.5% | North America, Western Europe, Australia | Medium term (2-4 years) |
| Source: Mordor Intelligence | |||
High Capital & Service Costs
A 3 T system lists at USD 2.5–3 million and annual service can exceed USD 300,000. Construction for RF shielding adds another USD 500,000–1 million, extending payback to a decade in low-volume regions. Even a USD 500,000 portable unit needs three years at eight scans per day to break even. Pay-per-scan leases help, but they demand consistent patient flow, curbing Magnetic Resonance Imaging market adoption in budget-constrained zones.
Reimbursement-Pressure Headwinds
CMS cut the 2025 physician fee schedule by 2.83%, trimming MRI payments USD 15–30 per study. The U.K. NHS held imaging budgets flat despite 12% higher referrals, stretching wait times. Prior-authorization hurdles by private insurers delay exams and reduce volumes by around 8%. Providers respond by emphasizing higher-acuity studies that offset lower margins, yet pricing pressure still weighs on the Magnetic Resonance Imaging market.
*Our forecasts treat driver/restraint impacts as directional, not additive. The impact forecasts reflect baseline growth, mix effects, and variable interactions.
Segment Analysis
By Product Type: Software Accelerates Revenue Expansion
Software revenue is on track for a 10.55% CAGR through 2031, more than double hardware growth, as cloud PACS and AI reconstruction shift value from equipment to subscriptions. Hardware still commanded 68.35% of the Magnetic Resonance Imaging market share in 2025, supported by an installed fleet exceeding 40,000 scanners. Software add-ons like GE AIR Recon DL, priced at USD 150,000, enable clinics to defer USD 2 million magnet upgrades while achieving comparable image quality. The Magnetic Resonance Imaging market size for services is stable but sees margin erosion as helium-free designs reduce cryogen maintenance bills.
Vendor business models now center on recurring revenue: Philips SmartSpeed and Siemens syngo.via offer continual algorithm updates and cloud storage under multi-year contracts. This arrangement secures predictable cash flows and diffuses disruptive software-only entrants that license algorithms directly to providers. Hardware innovation is concentrating on modular, upgradeable designs such as Canon’s Vantage Orian 3 T, shortening refresh cycles from 10 to five years and aligning expenditures to clinical innovation.


By Architecture Type: Open Systems Ease Patient Access
Closed scanners provided 74.24% of 2025 revenue due to superior field homogeneity, yet open systems should compound at 8.34% per year as bariatric and claustrophobic populations rise. Claustrophobia causes 10–15% of incomplete scans, often requiring sedation that adds USD 500–1,000 per case. Open C-shaped magnets relieve anxiety, cut scan failures by 60%, and accommodate patients exceeding 350 lb. Extremity-dedicated systems are growing in sports medicine clinics where sub-USD 1 million pricing fits practice budgets.
Mobile 1.5 T trailers and cart-based 0.064 T units such as Hyperfine Swoop widen access in remote regions. FDA and IAC validations secured in 2024 resolved payer uncertainty, enabling Medicare coverage and catalyzing demand. As hospitals assemble fleets—a 3 T closed, an open pediatric, a portable ICU unit—architecture choices in the Magnetic Resonance Imaging market become application-specific rather than monolithic.
By Field Strength: 3 T Gains Dominance
Mid-field devices (0.5–1.5 T) held 46.23% in 2025, reflecting their general-purpose utility. High-field 3 T scanners are projected to expand at 7.25% CAGR, buoyed by cardiology and prostate protocols that favor faster, finer resolution. AI reconstruction lets 1.5 T systems mimic 3 T image quality but at longer scan times, limiting throughput at busy centers. Portable low-field units are carving emergency and rural niches, and fewer than 100 ultra-high-field 7 T systems remain concentrated in academic labs for epilepsy and multiple-sclerosis studies.
Suppliers hedge by offering upgrade paths: Philips Ingenia Elition can convert from 1.5 T to 3 T in the field, letting customers align magnet strength with evolving reimbursement and clinical demand. This flexibility supports replacement in the Magnetic Resonance Imaging market while containing initial capital exposure.
By Application: Cardiology Leads Growth
Neurology remained the largest slice in 2025, but cardiac MRI is the growth engine, targeting an 8.02% CAGR through 2031. The American College of Cardiology granted cardiac MRI a Class I recommendation for myocarditis and Class IIa for coronary ischemia assessment, expanding addressable volume by roughly 2 million annual U.S. studies. Parametric mapping and stress perfusion protocols command USD 800-1,500 per exam, outpricing routine brain or spine scans and improving margins for imaging centers.
Musculoskeletal imaging benefits from AI cartilage and ligament segmentation that accelerates reads by 40%, while oncology expands with DWI and DCE sequences that spot therapy response early. Breast MRI gained momentum after the 2024 U.S. density-notification mandate, accelerating supplemental screening volumes. This richer case mix raises average reimbursement across the Magnetic Resonance Imaging market size for applications.
By End User: Ambulatory Centers Capture Momentum
Hospitals retained 58.89% revenue in 2025, yet ambulatory surgical centers are on track for a 9.03% CAGR as orthopedic and spine procedures migrate to cost-efficient facilities. Imaging chains backed by private equity leverage network scale for equipment discounts and radiologist sharing. Research institutions, though small in revenue, influence adoption of AI and 7 T protocols that later diffuse into routine care.
Veterinary demand is emerging as pet insurance penetration rises to 4% in the U.S., with dedicated 1.5 T open systems installed at specialty clinics. Portable MRI further decentralizes imaging to urgent-care clinics and skilled-nursing facilities, broadening the end-user base inside the Magnetic Resonance Imaging market.
Geography Analysis
North America supplied 37.86% of global revenue in 2025, benefiting from academic research hubs and early 7 T clinical adoption. Yet CMS cuts and site-neutral payments encourage a shift of volumes to freestanding centers, altering revenue distribution. Canada’s public–private partnerships trimmed wait times by up to 20%, while Mexican border clinics lure U.S. patients with 40-60% lower pricing.
Asia-Pacific is the Magnetic Resonance Imaging market’s fastest-growing territory, pegged at an 8.91% CAGR. United Imaging deployed more than 200 uMR Omega 3 T scanners by 2024, leveraging 30-40% price gaps versus Western rivals. India’s USD 6.9 billion Ayushman Bharat allocation channels new installations toward district hospitals, compressing referral delays. Japan’s median age of 49 and focus on neurology anchor high-field demand, while South Korea banks on AI algorithms tuned to local population traits. Australia earmarked AUD 500 million (USD 330 million) for radiology upgrades, centering on 3 T equipment.
In Europe, budget-capped national systems tighten prior authorization and prolong replacement cycles. Germany’s statutory insurers narrowed MRI indications, slashing volumes 5-8% in 2024. The U.K.’s flat imaging budget despite rising referrals lengthens queues. Southern Europe deploys portable units for sparsely populated regions to improve access without full-scale installations. The Middle East purchases 3 T and 7 T systems for new tertiary hospitals, while Sub-Saharan Africa relies heavily on mobile trailers due to thin infrastructure. South American markets tread cautiously, hampered by currency swings and import tariffs that favor refurbished equipment over new purchases.

Regulatory Landscape
MRI systems and related accessories continue to be shaped by medical-device regulations and MRI-specific consensus standards, which affect safety labeling, electromagnetic compatibility, and what vendors can claim for clinical performance. In 2026, MRI-environment safety marking gained an updated anchor with EN IEC 62570:2026-01 (effective January 1, 2026), while EN IEC 60601-2-33:2026 listed as effective from June 1, 2026 reinforced requirements for conformity and procurement specifications across MR equipment.
Regulatory attention is also tightening around the software and AI used in radiology workflows. In the United States, the FDA published a final order effective June 17, 2026, classifying radiological machine learning-based quantitative imaging software with predetermined change control plans into Class II (special controls), which supports lifecycle updates within a defined control framework. Europe continues to operate under the EU Medical Device Regulation (MDR) (EU) 2017/745 as the primary framework, alongside ongoing 2025/2026 reform proposals aimed at improving coordination and expert-panel capacity, which influences certification timelines and the evidence expectations for MRI hardware as well as software-as-medical-device components.
Competitive Landscape
Siemens Healthineers, GE Healthcare, Philips, and Canon Medical controlled a major share of 2025 revenue, indicating high concentration in the Magnetic Resonance Imaging market. Chinese vendors United Imaging, Mindray, and Neusoft seize share in price-sensitive regions with 30-40% discounts and domestic service networks. Incumbents respond with software ecosystems - Siemens syngo.via and GE Edison - locking users into subscription models that blend AI, visualization, and cloud archiving.
Helium-free magnets, once a differentiator, are now baseline: Siemens DryCool, Philips BlueSeal, and GE Freelium all remove cryogen refills. Strategy converges on modularity; Canon’s Vantage Orian swaps gradient coils without replacing magnets, halving refresh cycles. Software-native firms such as Arterys and Subtle Medical license FDA-cleared algorithms directly, fragmenting value chains. Patent filings show Siemens lodged 47 AI MRI patents in 2024, focusing on automated planning and motion correction, underscoring algorithmic competition. Regulatory clarity on software-as-medical-device, issued by the FDA in 2024, accelerates commercial rollout of AI tools, blurring lines between hardware and software players.
Magnetic Resonance Imaging (MRI) Industry Leaders
Canon Medical Systems Corporation
GE Healthcare
Fujifilm Holdings Corporation
Koninklijke Philips N.V.
Siemens Healthineers
- *Disclaimer: Major Players sorted in no particular order

Market Opportunities and Future Outlook
A clear opportunity is emerging around tighter pairing of faster acquisition, reduced contrast dependence, and workflow automation, with hardware roadmaps increasingly tied to software upgrades rather than full system replacements. Multiple 2026 U.S. FDA 510(k) clearances across GE HealthCare, Siemens Healthineers, Philips, and Fujifilm point to an ongoing replacement-and-upgrade cycle in 1.5T and 3T platforms, and to a higher attach rate for deep learning reconstruction and workflow capabilities as billable performance differentiators. Philips Titanion, announced at ISMRM 2026 with ultra-high-gradient performance (150 mT/m), also points to demand for quantitative and whole-body biomarker imaging where centers differentiate on advanced protocols.
Contrast-sparing cardiac MRI is another practical adoption lever for new protocol packages and AI add-ons. In July 2026, a prospective multicentre trial from the University of Oxford reported that Virtual Native Enhancement (VNE) AI could mimic contrast-enhanced cardiac MRI without dye injections in two thirds of heart attack patients, creating a more scalable pathway for outpatient deployment and for patients with contrast limitations. On the supply side, sustainability and infrastructure simplification are supporting additional installation settings. Siemens Healthineers plans a 56,000 square meter MRI production facility in Oxfordshire focused on DryCool technology (helium reduction from 1,500 liters to under one liter), which aligns with procurement programs that prioritize reduced site-prep burden and resilience to helium supply volatility, particularly for mobile and distributed imaging networks.
Recent Industry Developments
- July 2026: Canon Medical Systems received U.S. FDA 510(k) clearance for a Vantage Fortian/Orian 1.5T MRI system configuration with AiCE reconstruction, reinforcing the push to use deep learning to improve image quality and throughput on mid-field installations. The clearance supports hospitals and outpatient imaging centers repositioning 1.5T platforms as upgradeable, software-defined assets while managing capital constraints.
- July 2025: Philips received U.S. FDA 510(k) clearance for SmartSpeed Precise, a dual-AI deep learning reconstruction software for 1.5T and 3T MRI systems. The milestone strengthens software attach opportunities across mixed installed bases and accelerates the shift toward subscription-like upgrades that improve productivity without requiring a magnet replacement.
- December 2024: Philips unveiled a next-generation BlueSeal helium-free MRI system integrated with AI-enabled Smart Reading, extending the helium-minimization roadmap into routine clinical scanning. This direction supports buyers seeking lower cryogen dependency and simpler siting requirements while aligning with operational pressure to shorten exam times and reduce repeat scans.


Research Methodology Framework and Report Scope
Market Definition and Coverage
This market covers revenues earned from MRI systems used for human clinical imaging, including fixed, mobile, closed, open, and point-of-care scanners, along with related MRI software and services that are sold as part of the MRI solution.
Scope exclusions: We do not count veterinary MRI, refurbished or rental units, service contracts sold separately, or coils sold as standalone accessories.
Segmentation Overview
- By Architecture
- Closed MRI Systems
- Open MRI Systems
- Portable / Point-of-Care MRI Systems
- By Field Strength
- Low-Field (≤0.5 T) MRI Systems
- Mid-Field (1.0 T – 1.5 T) MRI Systems
- High-Field (3 T) MRI Systems
- Ultra-High & Very-High (>3 T) MRI Systems
- By Mobility
- Fixed Room Systems
- Mobile Trailer-based Systems
- By Application
- Neurology
- Oncology
- Cardiology
- Musculoskeletal
- Gastroenterology & Hepatology
- Other Applications
- By End User
- Hospitals
- Diagnostic Imaging Centers
- Ambulatory Surgery Centers
- Academic & Research Institutes
- By Geography
- North America
- United States
- Canada
- Mexico
- Europe
- Germany
- United Kingdom
- France
- Italy
- Spain
- Rest of Europe
- Asia-Pacific
- China
- Japan
- India
- South Korea
- Australia
- Rest of Asia-Pacific
- Middle East
- GCC
- South Africa
- Rest of Middle East
- South America
- Brazil
- Argentina
- Rest of South America
- North America
Data Sources, Market Sizing, and Validation
Desk Research
To set the baseline, we first collected public data that helps explain MRI demand, healthcare capacity, and equipment adoption patterns across regions. We used sources such as the World Health Organization, the World Bank, OECD health statistics, and national health ministries for imaging capacity signals and spending context. We also reviewed publications from radiology societies and peer reviewed journals to understand utilization trends, scan types, and technology shifts that can affect replacement cycles.
On the supply side, we checked company annual reports, regulatory and standards references, and trusted press coverage to map product launches, installed base direction, and pricing movements. Where needed, we used paid subscriptions for company financials and intelligence, news and financials, patent databases, and an import-export shipment-level database to sanity check shipment direction and currency effects in reported revenues. These sources are illustrative, and other public documents were also used to collect, verify, and clarify the final assumptions.
Primary Interviews and Surveys
Desk findings were then pressure-tested through expert interviews and structured surveys with MRI stakeholders across OEM-facing and provider-facing roles, so that price and volume assumptions did not rely only on published statements. The respondent input helped confirm how software and services are bundled in deals, and where exchange rate moves can quickly swing the reported USD value of equipment orders. Inputs were validated across APAC, EMEA, and the Americas, with extra attention on markets where procurement timing varies and FX effects show up in revenue reporting.
Distribution of primary research fieldwork respondents
| Company type | Respondent position | Region |
|---|---|---|
| Top tier: 30% | CXOs: 15% | APAC: 41% |
| Mid tier: 54% | Functional/Unit leaders: 38% | EMEA: 33% |
| Smaller Players: 16% | Managers: 47% | Americas: 26% |
Market-Sizing & Forecasting
Sizing starts with a top-down build that reconstructs MRI revenue by combining healthcare imaging capacity signals with adoption and replacement behavior by region, and then translating that demand pool into system and solution revenue using realistic price ladders. In practice, we track variables such as MRI installed base expansion, replacement cycle length, share shift toward 1.5T and 3T platforms, penetration of point-of-care and portable systems, typical service attachment within bundled deals, and utilization intensity in hospitals and imaging centers.
Those totals are then corroborated with selective bottom-up approximations, such as sampled ASP times estimated unit volumes in major countries, distributor and channel checks, and supplier-side shipment direction, which helps adjust for gaps where public information is thin. For forecasting, scenario analysis is used around reimbursement pressure, procurement timing, and technology refresh pace, and then the final trajectory is aligned to what primary respondents see as the most likely demand path.
Data Validation & Update Cycle
Outputs are checked against independent signals, such as reported order momentum, import-export direction where applicable, and regional healthcare spending and imaging capacity indicators. When a country level result looks unusual, we review the assumptions behind pricing, replacement, and volume, and we re-contact respondents if the variance cannot be explained with public evidence.
Reports refresh annually, and material events like major currency swings, policy changes affecting imaging reimbursement, or meaningful product shifts can trigger interim updates. Before delivery, a fresh analyst pass is completed so the client receives the latest view that still maps back to clear, repeatable inputs.
Mordor Intelligence's Global Mri Market Market Size Compared With Other Published Estimates
Published MRI market values often differ because firms apply different timing for exchange rates, different rules for bundling software and services, and different ways of handling price erosion versus mix shift between low-field and high-field systems. When these items move in opposite directions, the final USD total can look far apart even if the underlying unit story is similar.
In this study, currency conversion is aligned to the sizing year, and ASP steps are refreshed using recent deal feedback and solution-bundle validation checks, which is why the 2026 figure lands where it does for Mordor Intelligence.
Benchmark comparison
| Source | Market Size | Gaps in Research Methodology |
|---|---|---|
| Mordor Intelligence | USD 10.92 B (2026) | |
| Industry Publisher A | USD 8.00 B (2026) | This estimate appears closer to equipment-only revenue and may exclude bundled MRI software and services, which reduces totals in years where service attachment is rising. |
| Industry Publisher B | USD 7.00 B (2026) | This figure likely applies a narrower definition that excludes several solution elements and may use different USD conversion timing, which can understate revenue in high FX-volatility periods. |
The spread in the table is mainly explained by what gets counted around the scanner sale and how pricing is updated as mix shifts across field strengths. By keeping the inputs tied to practical demand indicators and re-checking pricing and bundling assumptions with market participants, we end up with a number that is easier to trace and re-run year after year.


Key Questions Answered in the Report
What is the projected value of the Magnetic Resonance Imaging market in 2031?
The Magnetic Resonance Imaging market size is expected to reach USD 14.66 billion by 2031, growing at a 6.07% CAGR.
Which product segment is growing fastest in MRI adoption?
Software is the fastest-growing segment, forecast to expand at a 10.55% CAGR as AI reconstruction and cloud PACS gain traction.
Why are ambulatory surgical centers important to MRI vendors?
Medicare site-neutral payments shift imaging volumes to ambulatory centers, which are projected to grow at a 9.03% CAGR through 2031.
How are helium-free magnets affecting scanner ownership costs?
Technologies like Siemens DryCool and Philips BlueSeal remove or minimize helium, cutting annual operating costs by up to USD 50,000.
Which region will see the highest MRI growth rate to 2031?
Asia-Pacific is set for the fastest expansion at an 8.91% CAGR, driven by domestic manufacturing in China and infrastructure programs in India.
What drives the rise of portable MRI systems?
FDA clearances, site-neutral reimbursement, and the need for bedside imaging in emergency and intensive care units fuel portable MRI adoption.
Page last updated on:


