
Breast Imaging Market Size and Share
Market Overview
| Study Period | 2020 - 2031 |
|---|---|
| Market Size (2026) | USD 6.73 Billion |
| Market Size (2031) | USD 9.92 Billion |
| Growth Rate (2026 - 2031) | 8.12 % |
| Fastest Growing Market | Asia-Pacific |
| Largest Market | North America |
| Market Concentration | Medium |
Major Players *Disclaimer: Major Players sorted in no particular order Image © Mordor Intelligence. Reuse requires attribution under CC BY 4.0. | |
Breast Imaging Market Analysis by Mordor Intelligence
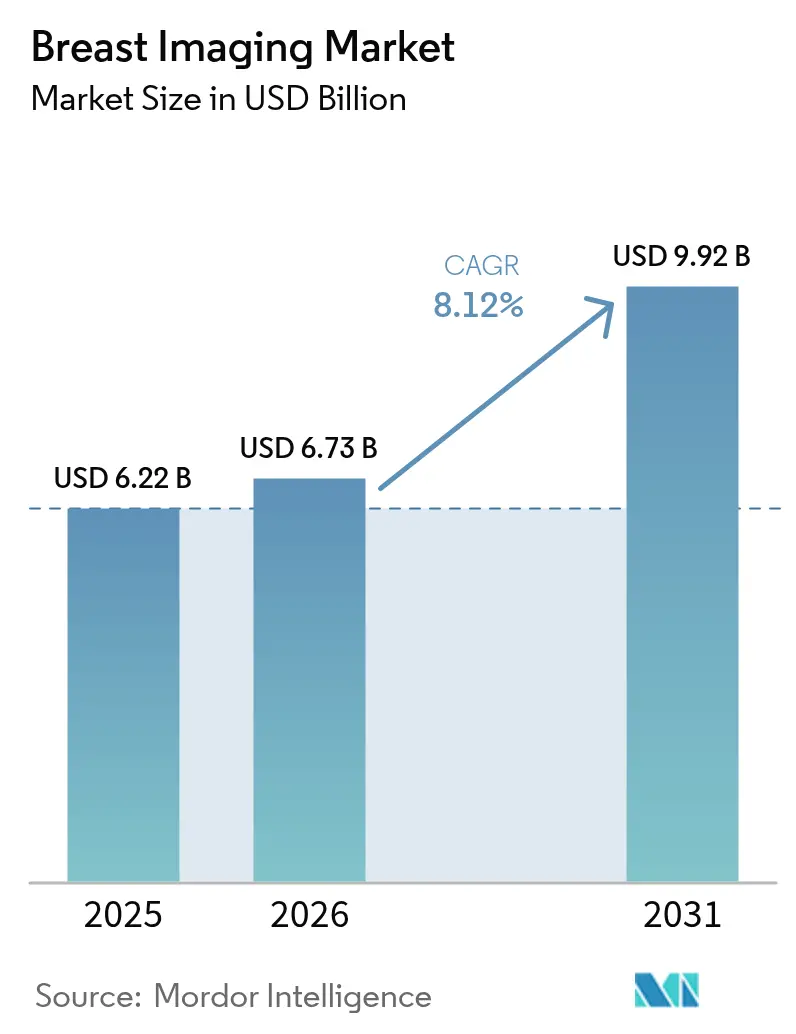
The breast imaging market size in 2026 is estimated at USD 6.73 billion, growing from 2025 value of USD 6.22 billion with 2031 projections showing USD 9.92 billion, growing at 8.12% CAGR over 2026-2031. Growth stems from widespread AI adoption that accelerates reading times, evolving FDA Mammography Quality Standards Act (MQSA) regulations that require dense-breast notifications, and a steady shift toward three-dimensional screening. Hospitals remain the foundation of service delivery, yet outpatient imaging centers scale rapidly as payers push care into lower-cost settings and patients look for convenience. Rising procedure volumes also magnify the urgency of workforce and cybersecurity shortfalls, both of which shape purchase criteria for new equipment. Regionally, North America keeps its leadership position, but Asia-Pacific delivers the greatest incremental revenue on the back of government-funded screening rollouts and middle-class expansion. Competitive intensity tightens as established vendors pair hardware strength with proprietary algorithms while smaller AI specialists carve out high-value workflow niches.
Key Report Takeaways
- By imaging technique, mammography held 38.12% of breast imaging market share in 2025, whereas 3-D/DBT mammography is set to advance at a 12.38% CAGR to 2031.
- By technology, ionizing systems represented 61.74% of revenue in 2025; non-ionizing modalities are forecast to grow at a 10.29% CAGR through 2031.
- By stage of care, screening generated 53.16% of breast imaging market size in 2025, while interventional applications are expanding fastest at a 10.21% CAGR.
- By end user, hospitals commanded 61.95% of the market in 2025; diagnostic imaging centers register the highest growth rate at 11.28% CAGR.
- By geography, North America contributed 35.98% of 2025 revenue, but Asia-Pacific is projected to post the strongest 10.61% CAGR to 2031.
Note: Market size and forecast figures in this report are generated using Mordor Intelligence’s proprietary estimation framework, updated with the latest available data and insights as of 2026.
Market Trends and Insights
Drivers Impact Analysis of Breast Imaging Market*
| Driver | (~) % Impact on CAGR Forecast | Geographic Relevance | Impact Timeline |
|---|---|---|---|
| Growing Prevalence Of Breast Cancer | +1.8% | Global, with highest impact in North America & Europe | Long term (≥ 4 years) |
| Rapid Adoption Of 3-D/DBT Mammography | +2.1% | North America & EU core, expanding to APAC | Medium term (2-4 years) |
| AI-Powered Image-Analysis Improves Workflow Efficiency | +1.5% | Global, with early adoption in developed markets | Short term (≤ 2 years) |
| Expansion Of Portable, Handheld Ultrasound For Remote Screening | +0.9% | APAC core, spill-over to MEA and rural markets | Medium term (2-4 years) |
| Government-Mandated Dense-Breast Notification Laws | +1.2% | North America primary, expanding to EU | Short term (≤ 2 years) |
| Rapid Roll-Out Of Contrast-Enhanced Mammography (CEM) | +0.8% | Global, with concentration in specialized centers | Medium term (2-4 years) |
| Source: Mordor Intelligence | |||


Growing prevalence of breast cancer
An expanding at-risk female population sustains demand for advanced imaging. The American Cancer Society predicts 310,720 new invasive cases and 42,250 deaths in the United States during 2024, reinforcing the value of early detection.[1]American Cancer Society, “Cancer Facts & Figures 2024,” cancer.org Incidence climbs fastest in Eastern Europe, while rising obesity and later first-birth age widen the screening cohort across emerging economies. Ageing demographics amplify volumes because risk escalates steeply after menopause, driving planners to enlarge capacity and upgrade to higher-sensitivity tools. Regular screening improves five-year survival, and payers increasingly treat it as a cost-saving measure rather than a discretionary expense.
Rapid uptake of 3-D/DBT mammography
Digital breast tomosynthesis reduces tissue-overlap artefacts and lowers false-positive callbacks by up to 15% Updated EU guidelines recommend DBT for routine screening, prompting wholesale replacement of 2-D units in public fleets. Providers in the United States still upgrade despite Medicare fee cuts because DBT attracts patient preference and mitigates medicolegal risk. When paired with triage algorithms, DBT shortens interpretation time and lifts throughput, enabling centres to balance lower unit reimbursement with higher daily exam counts.
AI-powered image analysis boosts workflow efficiency
Radiologist shortages leave more than 1,400 breast-imaging posts vacant in the United States in 2025. Cloud-delivered algorithms now mark suspicious regions, stratify risk, and auto-populate structured reports. RadNet’s USD 48 million purchase of iCAD in 2024 highlights the competitive value of owning differentiated AI pipelines.[2]RadNet Inc., “RadNet Completes Acquisition of iCAD,” radnet.com EU Artificial Intelligence Act rules lengthen certification cycles, yet uniform regulation promises pan-European scale once clearance is achieved. Facilities adopt subscription models to access continual software improvements without fresh capital outlay.
Portable handheld ultrasound broadens access
Handheld probes priced far below cart-based systems reach community clinics, mobile vans, and primary-care offices where fixed rooms are scarce. During the COVID-19 emergency these devices preserved screening continuity while limiting hospital visits. Cloud upload lets city specialists read exams captured in rural settings, closing equity gaps and sustaining breast imaging market growth in low-resource geographies. Image resolution still trails premium ultrasound, restricting use in complex diagnostic work-ups, but manufacturers improve probe bandwidth and AI-driven noise reduction with each generation.
Restraints Impact Analysis of Breast Imaging Market*
| Restraint | (~) % Impact on CAGR Forecast | Geographic Relevance | Impact Timeline |
|---|---|---|---|
| High Upfront Cost Of Digital Breast Tomosynthesis Systems | -1.4% | Global, with highest impact in emerging markets | Medium term (2-4 years) |
| Shortage Of Sub-Specialty Radiologists In Emerging Markets | -1.1% | APAC, MEA, and rural markets globally | Long term (≥ 4 years) |
| Cyber-Security Risks For Cloud-Connected Imaging Modalities | -0.8% | Global, with concentration in developed markets | Short term (≤ 2 years) |
| Limited Third-Party Reimbursement For Advanced Breast-Imaging Modalities | -1.6% | North America primary, expanding globally | Medium term (2-4 years) |
| Source: Mordor Intelligence | |||
High upfront cost of DBT systems
Full-featured scanners list between USD 400,000 and USD 600,000, stretching capital budgets for independent sites. Consecutive Medicare fee cuts of 11.72% in 2024 and 9.67% in 2025 erode payback calculations. Vendors counter with trade-in credits and usage-based financing, yet adoption lags in price-sensitive regions, slowing replacements of ageing 2-D fleets.
Shortage of sub-specialty radiologists
Graduate caps restrict training slots, and retirements outpace new entrants, lengthening reading queues in rural and middle-income markets. Tele-interpretation and AI relieve volume spikes, but complex cases still demand board-certified expertise. Workforce gaps therefore limit the full utilisation of installed imaging capacity.
*Our forecasts treat driver/restraint impacts as directional, not additive. The impact forecasts reflect baseline growth, mix effects, and variable interactions.
Breast Imaging Market Segment Analysis
By Imaging Technique:
3-D Evolution Reinforces Mammography’s Core RoleMammography produced 38.12% of 2025 revenue, anchoring the breast imaging market even as DBT reshapes modality mix. The 3-D upgrade path supports a 12.38% CAGR to 2031, validated by European Commission screening guidance that highlights superior invasive-cancer detection. Breast ultrasound persists as the leading adjunct, providing radiation-free evaluation in dense tissue and in high-risk cohorts. Magnetic resonance imaging (MRI) retains gold-standard status for hereditary risk populations but faces cost and contrast-agent barriers.
Image-guided biopsy workflows integrate seamlessly with diagnostic imaging, streamlining tissue sampling under mammographic, ultrasound, or MRI guidance. Vacuum-assisted systems improve diagnostic yield and patient comfort, while clip-placement advances aid surgical localization. Molecular breast imaging (MBI) remains a targeted problem-solver when other modalities deliver inconclusive results, though radiation exposure limits broad use. AI overlays on each technique raise diagnostic consistency and cut observer variability, further embedding algorithmic support in daily practice.



By Technology:
Non-Ionizing Modalities Gain MomentumIonizing platforms still account for 61.74% of global sales, reaffirming their ubiquity in national screening programs. Yet non-ionizing modalities post a 10.29% CAGR through 2031 as payer and patient sentiment shifts toward radiation-free solutions. Automated breast ultrasound (ABUS) and contrast-enhanced ultrasound expand beyond handheld scans, addressing reproducibility and sensitivity concerns. High-field MRI systems push anatomic detail higher, while abbreviated protocols shorten table time and cost.
Artificial intelligence reduces exposure in ionizing studies by optimizing acquisition parameters, and hybrid workstations suggest second-look ultrasound for suspicious mammograms, blending both technology classes. Capital costs still tilt higher for MRI, but lifecycle savings accrue from reduced regulatory compliance on radiation. Over the forecast horizon, market competition will likely hinge on delivering diagnostic power with minimal or no ionizing dose.
By Stage of Care:
Screening Dominates but Intervention ClimbsScreening programs generated 53.16% of 2025 revenue, proving that early detection anchors the breast imaging market size. However, interventional or therapeutic imaging rides a 10.21% CAGR, propelled by advances in MRI-guided focused ultrasound, stereotactic radiosurgery planning, and real-time navigation during minimally invasive procedures. Diagnostic imaging sits squarely in the middle, translating screening recalls into actionable lesion characterization through contrast, diffusion, or elastography sequences.
Clinicians increasingly monitor therapy with imaging biomarkers, adjusting regimens mid-course to spare toxicity and boost outcomes. Post-procedure surveillance also relies on high-resolution modalities to spot recurrences early. As workflow ties tighten between detection and treatment, vendors position integrated platforms that cover the continuum rather than sell stand-alone scanners.

By End User:
Outpatient Players AccelerateHospitals retained 61.95% revenue share in 2025, yet diagnostic imaging centers outpace all others with an 11.28% CAGR. Payers favor these outpatient venues for lower facility fees, and patients appreciate faster scheduling. The RadNet–iCAD deal reflects how algorithmic speed gains translate directly into center profitability through higher daily throughput. Ambulatory surgery centers invest in advanced guidance systems so surgeons can biopsy or ablate tumors without hospital admission, broadening addressable procedure volumes.
Academic hospitals nevertheless hold the edge in complex cases requiring multidisciplinary input, threading imaging, pathology, and oncology under one roof. They also act as early adopters of cutting-edge research protocols, setting the stage for downstream community uptake. Tele-radiology partnerships now let suburban sites tap city-center expertise, blurring the lines between care settings and allowing the breast imaging market to follow patients outside traditional walls.
Geography Analysis
North America Breast Imaging Market
North America produced 35.98% of 2025 revenue. The breast imaging market benefits from federally mandated dense-breast notifications effective September 2024, which lift demand for supplemental ultrasound and MRI. AI adoption matures fastest here because early algorithm clearances and venture funding support broad deployment. Growth moderates, however, because replacement purchases dominate a saturated installed base.
Europe Breast Imaging Market
Europe follows with high screening penetration and unified clinical guidelines that now recommend DBT. The European Artificial Intelligence Act sets a harmonised approval path, lengthening validation but ultimately creating a single digital market. Public health agencies co-finance refresh cycles, and competitive tenders encourage volume-based discounts that widen access to mid-sized clinics.
APAC Breast Imaging Market
Asia-Pacific shows the strongest 10.61% CAGR. Government insurance schemes in China fund biennial mammograms for millions of women, while India’s Ayushman Bharat drives mobile vans into secondary cities. Middle-class awareness campaigns and international NGO partnerships further widen screening coverage. Capital spending migrates from tier-one metros to provincial hubs, where handheld ultrasound and entry-level MRI enable affordable services. Regulatory heterogeneity persists, but local manufacturing incentives attract global vendors into joint ventures.
MEA and South America Breast Imaging Market
The Middle East & Africa and South America trail in revenue but post steady single-digit growth. Oil-exporting Gulf states buy premium suites for public centres, whereas sub-Saharan Africa relies on mobile vans and donor funding. Brazil expands public screening capacity, but reimbursement lags, restraining wholesale adoption of DBT.


Regulatory Landscape
In the United States, breast imaging providers and OEMs operate under the Mammography Quality Standards Act (MQSA), including the FDA final rule that made dense-breast notification requirements effective September 10, 2024. The MQSA framework links equipment performance, facility certification, and quality assurance to continued participation in screening programs, which shapes upgrade cycles toward compliant digital mammography and DBT systems.
For software-led innovation, the FDA added a clearer pathway for certain AI imaging functions by classifying radiological machine learning-based quantitative imaging software with a predetermined change control plan as Class II (special controls) under 21 CFR 892.2055, effective June 17, 2026. In Europe, the EU Medical Device Regulation (Regulation (EU) 2017/745, consolidated text applicable from January 1, 2026) remains the core compliance framework for high-risk devices, while Regulation (EU) 2024/1860 (adopted June 13, 2024) supports the staged EUDAMED roll-out and extends certain transitional provisions to reduce supply disruption risk.
Value Chain Analysis
The breast imaging value chain runs from upstream component suppliers (flat-panel detectors, X-ray tubes, semiconductors, and specialty materials such as tungsten) to system OEMs for mammography/DBT, ultrasound, MRI, and biopsy guidance. It also includes software and AI developers, distributors and service organizations, and downstream providers such as hospitals, diagnostic imaging centers, and ambulatory settings. Cross-border sourcing is common, with key detector and imaging-component ecosystems in Japan and Europe, while final system integration and commercialization are led by global OEMs and supported by installation, calibration, preventive maintenance, and applications training.
Operational continuity depends on consumables and service readiness as well as capital equipment availability. In interventional workflows, supply constraints can cap procedure volumes, which aligns with the FDA confirmation in June 2026 that breast biopsy needle shortages are anticipated to continue through March 2027, and with Hologic actions in January 2026 involving specific lots of 9-gauge needles for its Brevera Breast Biopsy system. On the capital side, long lead-time electronics and specialized materials can extend production timelines by months, pushing providers toward earlier ordering, multi-sourcing strategies, and software upgrades (AI reconstruction and decision support) that extend the utility of installed bases when hardware delivery timelines tighten.
Competitive Landscape
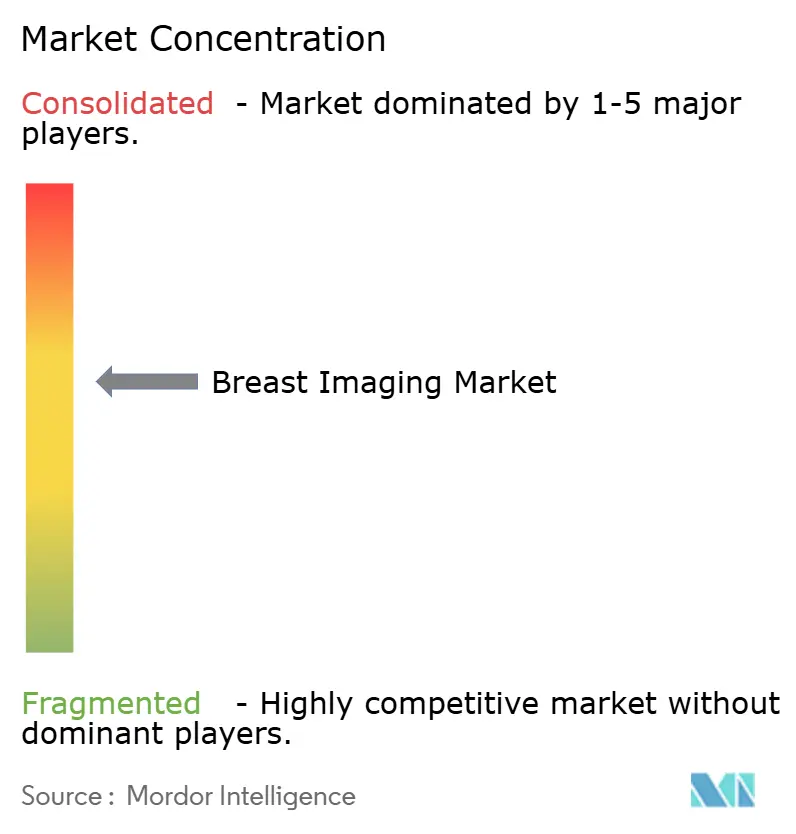
The breast imaging market is moderately consolidated. Hologic, GE HealthCare, and Siemens Healthineers anchor the top tier, combining detectors, gantry ergonomics, and integrated AI dashboards. Canon Medical pushes ergonomics and dose reduction, while Fujifilm’s open-architecture PACS eases algorithm onboarding. AI-first firms such as Lunit, Kheiron, and Vara supply modality-agnostic engines that plug into rival hardware, intensifying feature competition.
Strategic alliances accelerate capability gaps. RadNet’s iCAD purchase secures exclusive cancer-detection algorithms for its 350-site chain. Volpara adds risk-stratification to SimonMed’s national network, letting technologists tailor exam protocols per patient. Global equipment leaders court these software boutiques, offering co-marketing deals and revenue-share models to speed adoption.
Cybersecurity surfaces as a differentiator after a 2024 CMS breach of nearly 950,000 records. Vendors now highlight zero-trust architecture, end-to-end encryption, and 24 × 7 monitoring. Facilities rank security audits alongside detector technology when issuing tenders, reshaping procurement criteria and pushing smaller suppliers to partner with managed security providers.
Breast Imaging Industry Leaders
GE Healthcare
Hologic Inc.
Siemens Healthineers
Fujifilm Holdings Corp.
Koninklijke Philips N.V.
- *Disclaimer: Major Players sorted in no particular order
Breast Imaging Market Companies Covered in this Report
- Hologic
- GE Healthcare
- Siemens Healthineers
- Fujifilm Holdings Corp.
- Koninklijke Philips
- Canon
- iCAD Inc.
- Delphinus Medical Technologies
- Gamma Medica
- CMR Naviscan Corp.
- Agfa-Gevaert
- Carestream Health
- Planmed
- Aurora Imaging Technology
- Micrima Ltd.
- SonoCine Inc.
- KUB Technologies
- Bracco Imaging S.p.A.
- Paragon Biosciences (Clarix Imaging)
- Zebra Medical Vision

Market Opportunities and Future Outlook
Workflow-facing AI that can be updated safely and compliantly is a recurring whitespace across modalities, since providers are managing radiologist shortages alongside rising exam volumes. A key enabler is the FDA action effective June 17, 2026 that establishes 21 CFR 892.2055 for radiological machine learning-based quantitative imaging software with predetermined change control plans (Class II, special controls), supporting regulated, iterative model updates without full re-submissions for each change when executed within an approved plan. Recent clearances also indicate demand for software that targets throughput and reporting consistency, including DeepHealth receiving two FDA 510(k) clearances in June 2026 for its Breast Suite to add breast arterial calcification (BAC) and prior exam integration.
Diagnostic pathway expansion is also creating spend pockets in contrast-enhanced and advanced imaging, particularly in centers seeking MRI-like insights with mammography-like access. Siemens Healthineers received FDA 510(k) clearance in June 2026 for contrast-enhanced mammography (CEM) and CEM biopsy features, reflecting movement toward more integrated diagnostic-to-interventional workflows within the mammography suite. Alongside that, national program modernization is opening room for risk stratification and density assessment infrastructure: Cancer Council Australia published the 5-year ROSA Breast Roadmap in April 2026 to transition toward risk-based screening, including work around density assessment pathways and trial design. This points to growing needs for standardized risk tools, automated density measurement, and interoperable data pipelines that connect imaging, reporting, and program governance.
Recent Industry Developments in Breast Imaging Market
- June 2026: Siemens Healthineers received FDA 510(k) clearance for contrast-enhanced mammography (CEM) and CEM biopsy features. The approval broadens the mammography suite from detection into lesion work-up and tissue sampling, supporting providers that want higher-acuity breast diagnostics without routing every complex case to MRI.
- November 2025: GE HealthCare received FDA premarket authorization for Pristina Recon DL, a deep learning reconstruction application for mammography. By improving image quality through software on an established platform, the launch reinforces the shift toward upgradeable, AI-led performance improvements that extend the value of installed DBT fleets.
- June 2024: EU adopts Regulation 2024/1860 to support the staged EUDAMED roll-out and extend transitional provisions, reducing supply disruption risk for breast imaging devices across the EU. The regulatory update creates a clearer, future-ready path for device registration and post-market monitoring in member states.


Breast Imaging Market Report Scope and Research Methodology
Market Definition and Coverage
This market covers the revenue generated from breast imaging technologies used to screen, diagnose, and guide procedures in breast care across healthcare settings worldwide, including equipment and related technology value captured at the manufacturer and system level.
Scope exclusions: We exclude breast cancer lab diagnostics, therapeutics, and general radiology systems not used for breast-specific imaging workflows.
Segments Covered in This Report
- By Imaging Technique
- Mammography
- Breast Ultrasound
- Breast MRI
- Image-guided Breast Biopsy
- Molecular Breast Imaging (MBI)
- By Technology
- Ionizing Technology
- Non-Ionizing Technology
- By Stage of Care
- Screening
- Diagnostic
- Interventional / Therapeutic
- By End User
- Hospitals
- Diagnostic Imaging Centers
- Ambulatory Surgery Centers
- By Geography
- North America
- United States
- Canada
- Mexico
- Europe
- Germany
- United Kingdom
- France
- Italy
- Spain
- Rest of Europe
- Asia-Pacific
- China
- Japan
- India
- Australia
- South Korea
- Rest of Asia-Pacific
- Middle East and Africa
- GCC
- South Africa
- Rest of Middle East and Africa
- South America
- Brazil
- Argentina
- Rest of South America
- North America
Data Sources, Market Sizing, and Validation
Desk Research
Desk research was used to build a clean fact base around screening guidelines, disease burden, and imaging capacity signals that drive demand for breast imaging systems. We referenced public sources such as the World Health Organization and International Agency for Research on Cancer, the US FDA device databases, the US CDC for screening-related indicators, and radiology society publications and peer-reviewed journals for modality usage and practice updates.
To translate these signals into a workable model, we also reviewed company annual reports, investor presentations, regulatory filings, and reputable press coverage for product launches and pricing direction. In a few cases, paid subscriptions for company financials and patent databases were used to standardize revenues, map portfolios, and confirm technology focus areas when disclosures were limited. The desk sources listed here are illustrative, and we also reviewed other public documents for data collection, cross-checking, and follow-up clarifications.
Primary Interviews and Surveys
Primary work was used to pressure-test adoption assumptions by modality, typical replacement cycles, and how screening volumes translate into equipment demand across hospitals and imaging centers. We spoke with a mix of manufacturers, distributors, radiology leaders, and procurement or operations managers across major regions, so the model reflects differences in reimbursement, dense-breast notification practices, and imaging access.
Inputs from these discussions were then used to confirm the practical split between screening, diagnostic, and interventional usage, before finalizing price and volume assumptions for the market totals.
Distribution of primary research fieldwork respondents
| Company type | Respondent position | Region |
|---|---|---|
| Top tier: 27% | CXOs: 14% | APAC: 49% |
| Mid tier: 58% | Functional/Unit leaders: 32% | EMEA: 31% |
| Smaller Players: 15% | Managers: 54% | Americas: 20% |
Market-Sizing & Forecasting
Sizing started with a top-down build that reconstructs the addressable demand pool from modality-level procedure volumes and screening participation, then translates it into equipment needs using utilization and replacement patterns. To keep it grounded, we corroborated the totals with selective bottom-up checks, such as sampled ASP x shipped or installed-unit estimates by modality, plus channel checks on typical deal sizes, and then adjusted for any visible over-counting.
Key inputs used in the model include screening rates and guideline cadence, breast cancer incidence trends, modality mix shifts toward 3D mammography, penetration of image-guided biopsy pathways, average system lifetimes and upgrade cycles, and regional pricing differences tied to reimbursement and tender buying. Where bottom-up signals were incomplete, gaps were handled through conservative ranges validated with interviews and then reconciled back to the top-down demand pool.
Forecasts were built using scenario analysis. The main drivers were projected by region and modality, then blended into a base case. The forward view was checked with expert expectations on policy changes, capacity constraints in imaging centers, and the speed of workflow software and AI support adoption.
Data Validation & Update Cycle
Validation was done by triangulating the model outputs against independent signals, including modality procedure trends, imaging center expansion patterns, and manufacturer revenue direction, and then checking that implied ASPs stayed realistic by region. Outliers were reviewed in multiple steps, with re-checks of unit assumptions, currency timing, and year alignment before sign-off.
The report is refreshed annually, and interim updates are made when material events change demand or pricing assumptions, such as guideline updates, major regulatory actions, or sharp reimbursement shifts. Before delivery, a final analyst pass is completed so clients receive the most current view available.
Mordor Intelligence's Global Breast Imaging Technologies Market Market Size Measured Against Other Published Estimates
Published market values for breast imaging technologies can look different because authors do not always count the same technologies, buying channels, or care stages in the same way. Differences can also come from the base year selected, the currency conversion date used, and whether the estimate is anchored to procedure-led demand signals or to broader imaging device revenues.
Procedure volume checks, modality mix indicators (such as the move toward tomosynthesis), and replacement-cycle validation are the evidence points that keep Mordor Intelligence tied to a screening, diagnostic, and interventional demand pool, instead of blending in adjacent imaging or non-imaging breast cancer categories.
Benchmark comparison
| Source | Market Size | Gaps in Research Methodology |
|---|---|---|
| Mordor Intelligence | USD 6.73 B (2026) | |
| Industry Publisher A | USD 5.21 B (2024) | Uses an earlier base year and a broader technology grouping that can mix ionizing and non-ionizing totals without clearly separating equipment refresh from service and workflow value, which can pull the starting value down depending on what is excluded. |
| Industry Publisher B | USD 4.50 B (2024) | Leans on a narrower product-type lens and a long-range forecast window, and it is less explicit about stage-of-care coverage (screening vs diagnostic vs interventional), which can reduce the counted demand that comes from biopsy guidance and procedure-led upgrades. |
Taken together, the spread mainly reflects year alignment and how tightly the scope is tied to breast-specific imaging workflows. By keeping the market boundary linked to observable demand drivers and then validating prices and refresh cycles through interviews, the estimate stays traceable to repeatable steps that buyers can challenge and recreate.


Key Questions Answered in the Report
What is the current size of the breast imaging market?
The breast imaging market size stands at USD 6.73 billion in 2026 and is projected to reach USD 9.92 billion by 2031.
Which modality is expanding fastest within breast imaging?
Three-dimensional digital breast tomosynthesis leads growth with a 12.38% CAGR through 2031.
Why is Asia-Pacific the most dynamic region?
Government-funded screening programs, new hospital construction, and larger middle-class cohorts underpin a 10.61% CAGR in Asia-Pacific.
How does AI improve breast-imaging workflows?
AI marks lesions, raises suspicious cases to the top of the list, and auto-drafts reports, reducing radiologist workload while maintaining accuracy.
What challenges restrain market growth?
High capital costs for DBT equipment, persistent radiologist shortages, and tightening reimbursement all slow the pace of technology adoption.
Page last updated on:


 Your data is secure and never sold or shared.


