Shore Power Market Size and Share
Market Overview
| Study Period | 2020 - 2030 |
|---|---|
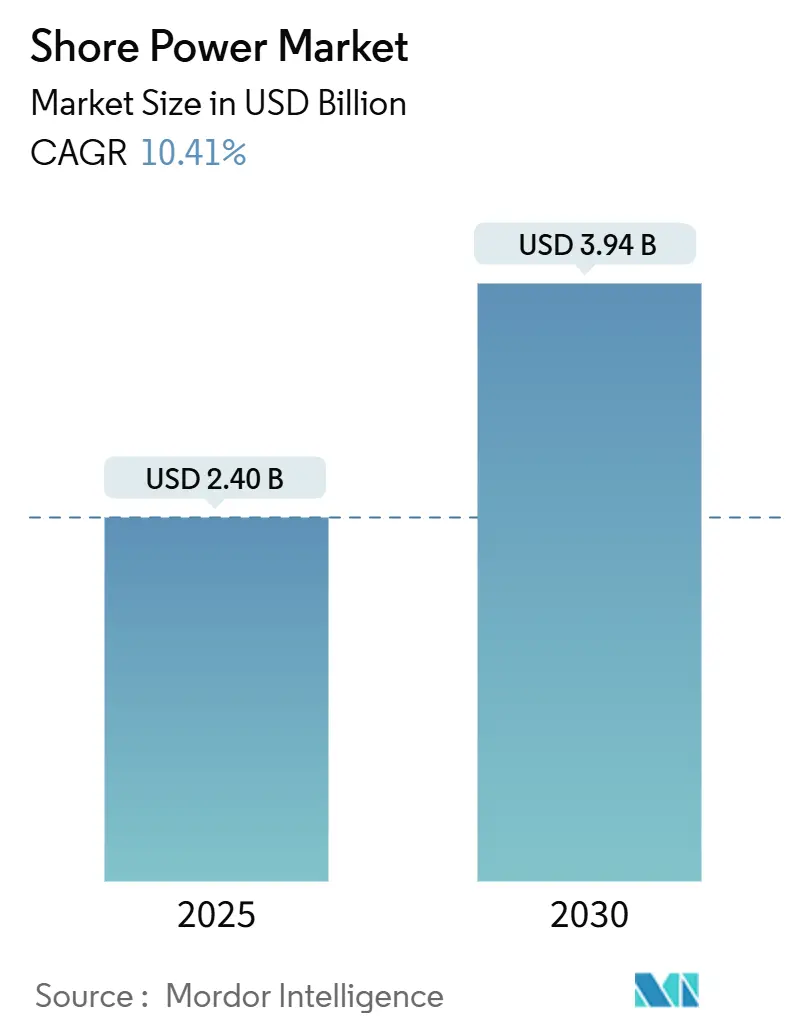
| Market Size (2025) | USD 2.40 Billion |
| Market Size (2030) | USD 3.94 Billion |
| Growth Rate (2025 - 2030) | 10.41% CAGR |
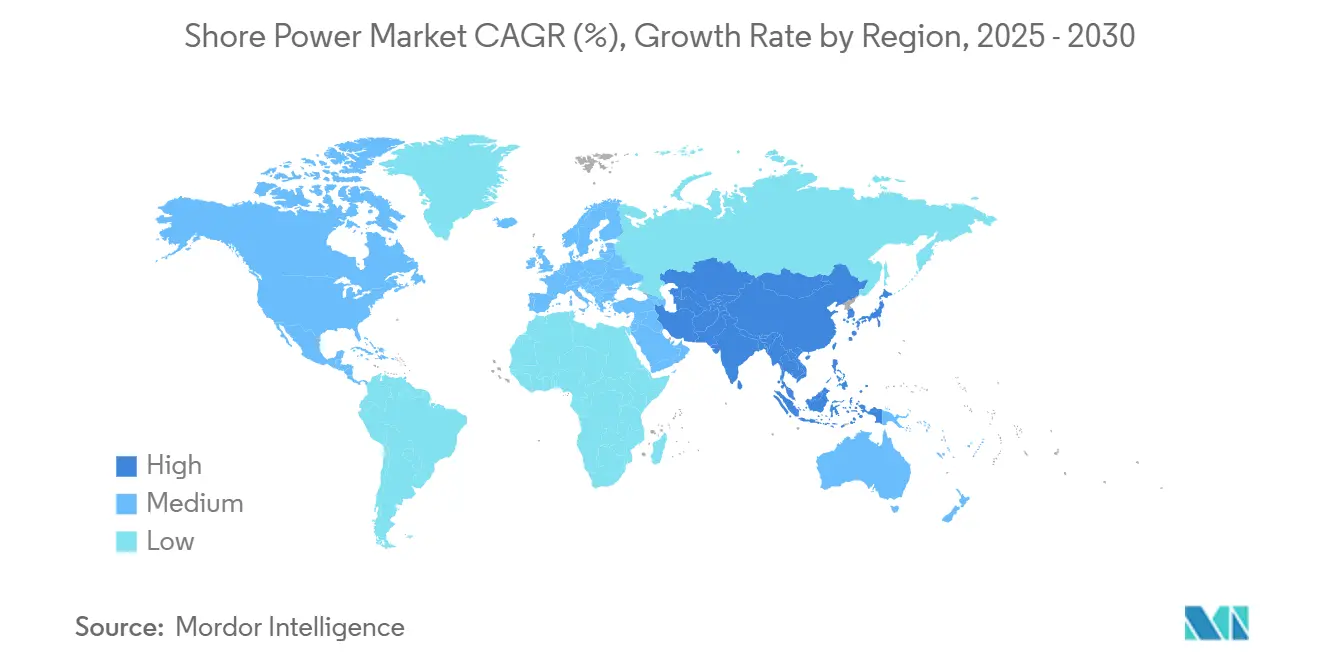
| Fastest Growing Market | Asia Pacific |
| Largest Market | Asia Pacific |
| Market Concentration | Medium |
Major Players *Disclaimer: Major Players sorted in no particular order Image © Mordor Intelligence. Reuse requires attribution under CC BY 4.0. | |
Shore Power Market Analysis by Mordor Intelligence
The Shore Power Market size is estimated at USD 2.40 billion in 2025, and is expected to reach USD 3.94 billion by 2030, at a CAGR of 10.41% during the forecast period (2025-2030).
Regulatory mandates that cut auxiliary-engine emissions by up to 98% when vessels plug into the grid, falling renewable-electricity costs, and expanding port-electrification funds are steering this expansion. Electrical infrastructure suppliers and marine specialists compete by bundling frequency converters, transformers, and automated connectors that shorten connection times and improve safety. Port authorities increasingly view shore power as a revenue stream, setting service tariffs that can outprice low-sulfur marine fuel, especially in regions with surplus renewable generation. Convergence of cruise-ship growth, mega-container vessel calls, and longer dwell times is lifting utilization rates, reducing the payback period for systems larger than 10 MVA.
Key Report Takeaways
- By type, shoreside installations dominated the shore power market with a 67.5% share in 2024; ship-side systems will accelerate at a 14.4% CAGR up to 2030.
- By component, frequency converters held 35.6% of the shore power market share in 2024, whereas transformers are advancing at a 12.5% CAGR.
- By power output, 5–10 MVA systems commanded 41.8% of the shore power market size in 2024; systems above 10 MVA are projected to grow at a 13.2% CAGR.
- By application, container vessels captured 36.0% revenue in the shore power market 2024; cruise ships are forecast to expand at a 13.6% CAGR to 2030.
- By geography, Asia-Pacific led with 36.2% of the shore power market share in 2024, while it also records the fastest regional growth at an 11.1% CAGR through 2030.
- Siemens, ABB, and Schneider Electric jointly accounted for about 28% of 2024 global revenues in the shore power market, underscoring a moderately fragmented competitive field.
Global Shore Power Market Trends and Insights
Drivers Impact Analysis*
| Driver | (~) % Impact on CAGR Forecast | Geographic Relevance | Impact Timeline |
|---|---|---|---|
| Stringent global SOx/NOx & CO₂ regulations | 2.40% | Global, with early enforcement in California, EU | Medium term (2-4 years) |
| Government-funded port-electrification programs | 1.80% | North America & EU, expanding to APAC | Short term (≤ 2 years) |
| Growth of cruise & container vessel port-time | 2.10% | Global, concentrated in major hub ports | Long term (≥ 4 years) |
| Declining renewable-power LCOE vs. marine diesel | 1.90% | Global, accelerated in renewable-rich regions | Medium term (2-4 years) |
| Port-microgrid & battery storage peak-shaving | 0.80% | APAC core, spill-over to North America | Long term (≥ 4 years) |
| OEM standardised DC shore connectors | 1.50% | Global, led by IEEE/IEC standards adoption | Medium term (2-4 years) |
| Source: Mordor Intelligence | |||
Stringent Global SOx/NOx & CO₂ Regulations
California’s expanded At-Berth rule, now covering tankers and auto carriers, obliges a 90% cut in berth emissions and received U.S. EPA authorization in 2024. FuelEU Maritime will enforce similar measures across EU core ports from 2025, making shore-power capability a prerequisite for regular calls.[1] Shipping alliances now negotiate guaranteed electrical hookups in terminal contracts to ensure compliance. Environmental Ship Index rebates further reward plugged-in calls, tilting port-fee structures toward electrified berths. The regulatory cascade is turning shore power market from a voluntary sustainability choice into a baseline operating condition for global carriers.
Government-Funded Port-Electrification Programs
The Diesel Emission Reduction Act, California Energy Commission grants, and EUR 400 million in German federal funds are underwriting substation, vault, and cable-reel investments.[2]The Port of Hueneme secured USD 4 million to retrofit cargo berths, while White Bay Cruise Terminal in Sydney will invest USD 20 million to cut 4,000 tCO₂ annually. These grants synchronize with fleet-retrofit cycles, sharing costs across port authorities and liner companies and shortening return periods below 10 years in several early-adopter locations, strengthening the shore power market.
Growth of Cruise & Container Vessel Port-Time
Buffer times added after pandemic-era congestion have lifted average container-ship stays, making grid connections economically attractive for carriers. Cruise vessels often remain 12–24 hours for passenger turnover; PortMiami now supplies up to 16 MW per vessel, serving 21 cruise ships in its first operational season. Higher utilization pushes annualized power throughput, improving ports' and investors' net present value across the shore power market. Digital berth-planning software now bans engine-running during high-pollution hours, further locking in shore-power usage.
Declining Renewable-Power LCOE vs. Marine Diesel
Wind-rich grids in Northern Europe and solar-rich networks in California deliver electricity at lower marginal cost than low-sulfur fuel oil when carbon levy surcharges are included. Vessel operators integrate internal carbon prices of USD 100 t/CO₂e in cost models, and grid electricity sourced from renewables reduces their scope-1 emissions. Time-of-use tariffs allow night-rate charging and peak-shaving, often undercutting diesel even before carbon penalties. The economic pivot makes shore power market a cost-led, not just compliance-led, decision in 2025.
Restraints Impact Analysis*
| Restraint | (~) % Impact on CAGR Forecast | Geographic Relevance | Impact Timeline |
|---|---|---|---|
| High CAPEX for port & vessel retrofits | -1.2% | Global, acute in developing port markets | Short term (≤ 2 years) |
| Voltage / frequency incompatibility issues | -0.9% | Global, particularly Asia-Pacific to North America routes | Medium term (2-4 years) |
| Grid-substation congestion at legacy ports | -0.8% | North America & EU legacy ports, emerging in APAC | Medium term (2-4 years) |
| Uncertain tariff pass-through mechanisms | -0.6% | Global, acute in deregulated electricity markets | Long term (≥ 4 years) |
| Source: Mordor Intelligence | |||
High CAPEX for Port & Vessel Retrofits
PortMiami’s shore-power build came in at USD 125 million, a threshold smaller authorities struggle to match. Carrier retrofits cost USD 1–5 million per ship for high-voltage reels, transformers, and safety interlocks. Financing is complex because benefits are spread across shipowners, terminal operators, and the public. Payback ranges from 7–15 years, depending on utilization; secondary ports with intermittent calls face longer horizons. Specialized lending products have emerged, yet many developing-nation ports still defer projects due to balance-sheet limits within the shore power market.
Voltage/Frequency Incompatibility Issues
Vessels sailing from 60 Hz grids in North America to 50 Hz grids in Asia need dual-frequency converters costing several hundred thousand dollars. Although IEEE 80005 provides a common design envelope, bespoke implementations persist, elevating the risk of connection failure. Grounding and harmonic-distortion standards vary, forcing ports to overspecify electrical protection. Some alliances lobby for uniform 11 kV-60 Hz supplies at gateway terminals by 2028, but interim complexity suppresses adoption among operators of older tonnage in the shore power market.
*Our forecasts treat driver/restraint impacts as directional, not additive. The impact forecasts reflect baseline growth, mix effects, and variable interactions.
Segment Analysis
By Type: Shoreside Dominance Drives Infrastructure Investment
Shoreside systems commanded 67.5% of 2024 revenues, reflecting port preference for centralized assets serving multiple berths in sequence within the broader shore power market.Many operators, however, are shifting toward hybrid strategies; ship-side installations are anticipated to post a 14.4% CAGR as carriers seek certainty in ports that still lack grid access. Washington State Ferries’ phased conversions show how plug-in hybrids blend on-board batteries with shore supplies to cut on-route fuel burn.[3] Coastal cities that own their utilities find shoreside models easier to finance because grid-service charges feed municipal coffers. Shipowners remain concerned about split incentives, and some are retrofitting minimal on-board gear to future-proof assets while lobbying for tariff discounts that reward early movers.
The expanding cruise sector amplifies type-choice complexity. Large cruise operators prefer port-owned vaults that guarantee power quality, yet retrofit redundant on-board step-down transformers for smaller, non-electrified island itineraries. In turn, equipment suppliers offer modular skid packages that let ports upgrade vault size in 1 MVA increments. The shore power market ensures shoreside systems retain investment weighting, but ship-side projects will likely accelerate in secondary hubs where ports lack capital, yet vessels still want to avoid fuel surcharges.


By Component: Frequency Converters Lead Amid Grid-Integration Complexity
Frequency converters held a 35.6% share in 2024 because they reconcile 50 Hz shore grids with 60 Hz maritime standards. As vessel classes scale upward, transformer capacity lags are emerging; transformer revenues will grow at a 12.5% CAGR to serve the above-10 MVA class. Switchgear and protection relays experience steady demand as safety codes tighten. Cable-management solutions, including automatic reel-handling, lower labor costs, and boost turn-around speed, securing a stable mid-teens adoption rate.
Siemens and ABB each supply integrated converter-transformer modules that reduce footprint in space-constrained quaysides. Ports such as Los Angeles run over 80 vaults that rely on medium-voltage switchgear optimized for hurricane resilience.[4]Port of Los Angeles, “AMP Vault Operations,” portofla.org Interoperability guided by IEC standards is beginning to shrink custom-engineering lead times from 18 months to about 10 months, which is expected to compress overall project schedules and accelerate revenue recognition across the converter and transformer stack.
By Power Output: Mid-Range Systems Dominate Current Installations
Systems rated 5–10 MVA held 41.8% of the shore power market size 2024, particularly fitting Panamax container ships and mid-sized cruise hulls. Above-10 MVA solutions will outpace at a 13.2% CAGR, reflecting mega-ship deployments on Asia-Europe and transpacific strings. Ports in the Gulf and Mediterranean are adding dual-bus architectures that let two 12 MVA cruise vessels dock bow-to-bow without stressing the substation.
Smaller up-to-5 MVA units remain relevant for ferries and feeder services. Scandinavian fjord routes pair these units with on-board batteries to enable zero-emission departures through ecologically sensitive areas. Modular power-block design lets authorities stack units to 15 MVA as traffic rises, mitigating initial CAPEX.

By Application: Container Vessels Lead Adoption Despite Cruise-Ship Growth
Container ships accounted for 36% of segment turnover in 2024, leveraging California’s rule that covers 100% of calls at Los Angeles and Long Beach. Cruise lines, however, will log the fastest average growth at 13.6% per year as port-of-call tourism rebounds and passenger expectations align with net-zero marketing. Terminal operators note that cruise itineraries are booked years ahead, giving them revenue visibility that supports shore-power investment. Container alliances, by contrast, drive demand via slot-sharing agreements that require all partners to maintain plugged-in policies, which spreads benefits but complicates contractual enforcement.
Naval bases adopt shore power for readiness and security; U.S. Navy standards stipulate redundant feeds and harmonic filters to protect advanced weapon systems. Ro-Ro and ferry operators exploit predictable dwell times to set tight paybacks, particularly on short-sea corridors where fuel switching would otherwise erode thin margins.
Geography Analysis
Asia-Pacific held 36.2% of 2024 revenues and will expand at an 11.1% CAGR to 2030. China’s dual-carbon pledge obliges shore-power capability at 50% of coastal berths by 2027; provincial subsidies of up to CNY 3 million per vault accelerate rollout. South Korea’s Ministry of Oceans funds 60 Hz converter banks at Busan and Incheon, while Japan layers shore power into its maritime hydrogen strategy. India’s Green Ports Initiative earmarks INR 50 billion (USD 612 million) for electrification, but grid reliability lags remain a bottleneck.
Europe stands out for policy maturity within the shore power market. FuelEU Maritime locks in demand at the top 50 EU ports from 2025 and dedicates penalty revenues to further electrification. Germany’s EUR 400 million program underwrites vault-distribution infrastructure in Hamburg and Bremerhaven. Nordic countries, early ferry adopters, now trial 20 MVA cruise hookups coupled with on-site batteries. Southern Europe follows, with Italy’s Genoa consolidating shore-power nodes for Med cruise circuits.
As EPA-approved California rules extend to Atlantic and Gulf hubs, North America delivers robust growth in the shore power market. Ten U.S. ports operate shore power, and federal grants schedule a further nine by 2027. PortMiami’s USD 125 million facility services 21 cruise ships and demonstrates grid resilience amid tropical-storm conditions. Canada focuses on British Columbia ferries and Saint Lawrence projects; Mexico’s adoption is nascent yet expected to pick up as Pacific ports compete for transpacific calls that must satisfy Californian compliance on other legs.

Competitive Landscape
The shore power market is moderately fragmented. Siemens, ABB, and Schneider Electric apply terrestrial-grid experience to deliver turnkey vaults, while Cavotec, Wärtsilä, and ESL Power Systems specialize in maritime interfaces. The top five vendors controlled roughly 45% of 2024 billings, leaving ample room for regional EPC firms. Partnerships proliferate; ABB’s 2024 acquisition of SEAM Group adds asset-management skills that complement its converter lineup. Siemens carved out its eMobility unit to sharpen its focus on heavy-duty maritime and aviation segments.
Component differentiation centers on modular converter-transformer skids that reduce footprint by 30% and improve efficiency by 2–3 percentage points. Automated plug-handlers that mate high-voltage cables in under two minutes cut labor and safety incident rates. Software layers now bundle energy-management, billing, and predictive-maintenance analytics, enabling vendors to offer performance-based service contracts instead of one-time equipment sales.
Emerging challengers target mobile microgrids that mount battery packs on floating barges, delivering temporary shore power to ports lacking substation headroom. Digital-platform startups build real-time emissions dashboards integrating with berth-planning to reward vessels that maximize plug-in hours. As ESG scoring gains board-level importance, service-rich packages that guarantee verified emission cuts command price premiums and reinforce vendor lock-in.
Shore Power Industry Leaders
Siemens AG
Schneider Electric SE
Cavotec SA
ABB Ltd.
Wärtsilä Corp.
- *Disclaimer: Major Players sorted in no particular order


Recent Industry Developments
- June 2024: PortMiami inaugurated a USD 125 million grid connection supplying up to 16 MW per cruise ship, the largest U.S. East Coast deployment.
- May 2024: Wärtsilä won a contract to convert two Scandlines ferries to plug-in hybrids, drawing 80% of energy from shore.
- June 2024: Hamburg Port initiated MSC container-ship shore-power trials, aiming for mandatory connections at ECT terminals by 2028.


Global Shore Power Market Report Scope
| Shoreside Installation |
| Ship-side Installation |
| Transformers |
| Switchgear Devices |
| Frequency Converters |
| Cables and Connectors |
| Meters, Control Panels and Others |
| Up to 5 MVA |
| 5 to 10 MVA |
| Above 10 MVA |
| Commercial Ports |
| Naval Ports |
| Container Vessels |
| Cruise Ships |
| Ro-Ro Vessels |
| Ferries |
| Tankers |
| Bulk Carriers, Research Vessels and Others |
| North America | United States |
| Canada | |
| Mexico | |
| Europe | Germany |
| United Kingdom | |
| France | |
| Italy | |
| NORDIC Countries | |
| Russia | |
| Rest of Europe | |
| Asia-Pacific | China |
| India | |
| Japan | |
| South Korea | |
| ASEAN Countries | |
| Rest of Asia-Pacific | |
| South America | Brazil |
| Argentina | |
| Rest of South America | |
| Middle East and Africa | Saudi Arabia |
| United Arab Emirates | |
| South Africa | |
| Egypt | |
| Rest of Middle East and Africa |
| By Type | Shoreside Installation | |
| Ship-side Installation | ||
| By Component | Transformers | |
| Switchgear Devices | ||
| Frequency Converters | ||
| Cables and Connectors | ||
| Meters, Control Panels and Others | ||
| By Power Output | Up to 5 MVA | |
| 5 to 10 MVA | ||
| Above 10 MVA | ||
| By Application | Commercial Ports | |
| Naval Ports | ||
| Container Vessels | ||
| Cruise Ships | ||
| Ro-Ro Vessels | ||
| Ferries | ||
| Tankers | ||
| Bulk Carriers, Research Vessels and Others | ||
| By Geography | North America | United States |
| Canada | ||
| Mexico | ||
| Europe | Germany | |
| United Kingdom | ||
| France | ||
| Italy | ||
| NORDIC Countries | ||
| Russia | ||
| Rest of Europe | ||
| Asia-Pacific | China | |
| India | ||
| Japan | ||
| South Korea | ||
| ASEAN Countries | ||
| Rest of Asia-Pacific | ||
| South America | Brazil | |
| Argentina | ||
| Rest of South America | ||
| Middle East and Africa | Saudi Arabia | |
| United Arab Emirates | ||
| South Africa | ||
| Egypt | ||
| Rest of Middle East and Africa | ||


Key Questions Answered in the Report
What is the projected value of the global shore power market in 2030?
It is forecast to reach USD 3.94 billion by 2030, reflecting a 10.41% CAGR from 2025.
Which region currently leads in shore power market?
Asia-Pacific holds 36.2% of 2024 revenue and is also the fastest-growing area.
Why are cruise ships adopting shore power rapidly?
Extended port stays and stricter emission rules drive a projected 13.6% CAGR for cruise applications.
What is the most common power-output range ordered by ports?
Systems rated 5 to 10 MVA account for 41.8% of 2024 installations.
Which components dominate spending today?
Frequency converters lead with 35.6% share because they reconcile differing grid frequencies.
What hampers faster rollout in developing economies?
High upfront CAPEX and inconsistent grid standards slow adoption despite regulatory interest.
Page last updated on:


