Market Overview
| Study Period | 2021 - 2031 |
|---|---|
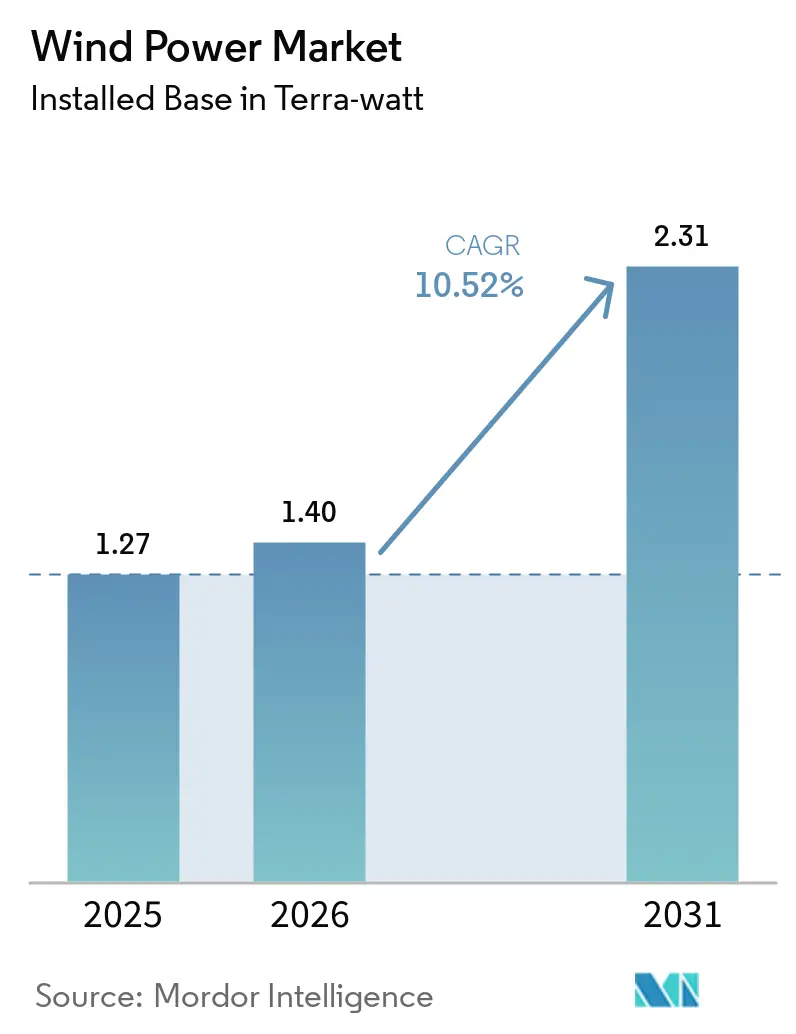
| Market Volume (2026) | 1.40 Terra-watt |
| Market Volume (2031) | 2.31 Terra-watt |
| Growth Rate (2026 - 2031) | 10.52% CAGR |
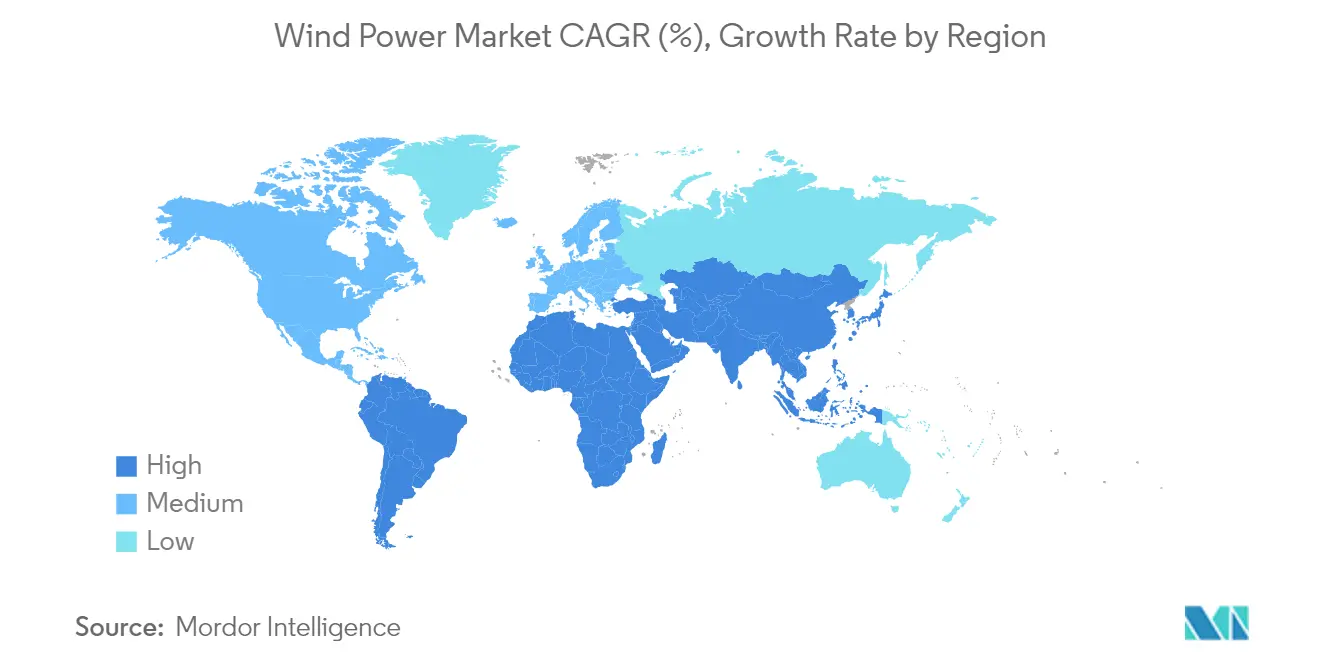
| Fastest Growing Market | Asia-Pacific |
| Largest Market | Asia Pacific |
| Market Concentration | Medium |
Major Players *Disclaimer: Major Players sorted in no particular order Image © Mordor Intelligence. Reuse requires attribution under CC BY 4.0. | |
Wind Power Market Analysis by Mordor Intelligence
The Wind Power Market size was valued at 1.27 Terra-watt in 2025 and estimated to grow from 1.4 Terra-watt in 2026 to reach 2.31 Terra-watt by 2031, at a CAGR of 10.52% during the forecast period (2026-2031).
Growth is tied to multi-gigawatt corporate power-purchase agreements, a steady pipeline of large-scale offshore projects, and policy incentives that keep financing costs low. Data-center operators now anchor a sizeable slice of new demand, signing long-term contracts that guarantee revenue for developers and secure clean electricity for artificial-intelligence workloads. At the same time, floating foundations open routes to high-capacity-factor deep-water sites, pushing offshore deployment into waters beyond 60 meters. Supply-chain resilience remains a watchpoint as steel price swings and rare-earth dependencies could tighten margins, yet the prevailing cost-down trend shows no sign of reversing.
Key Report Takeaways
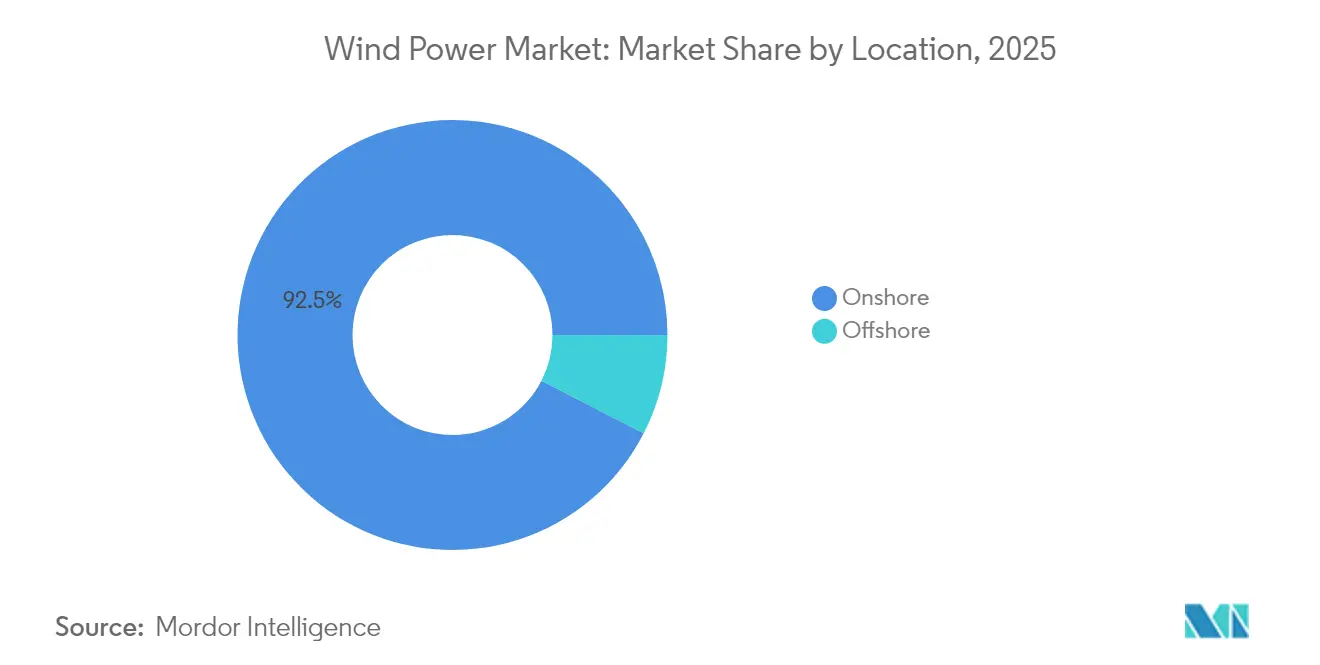
- By location, onshore installations controlled 92.45% of the wind power market share in 2025, while offshore capacity is forecast to grow at a 15.62% CAGR through 2031.
- By turbine capacity, units above 6 MW captured the fastest 17.28% CAGR between 2026 and 2031, whereas the 3-6 MW class held 46.05% of the wind power market size in 2025.
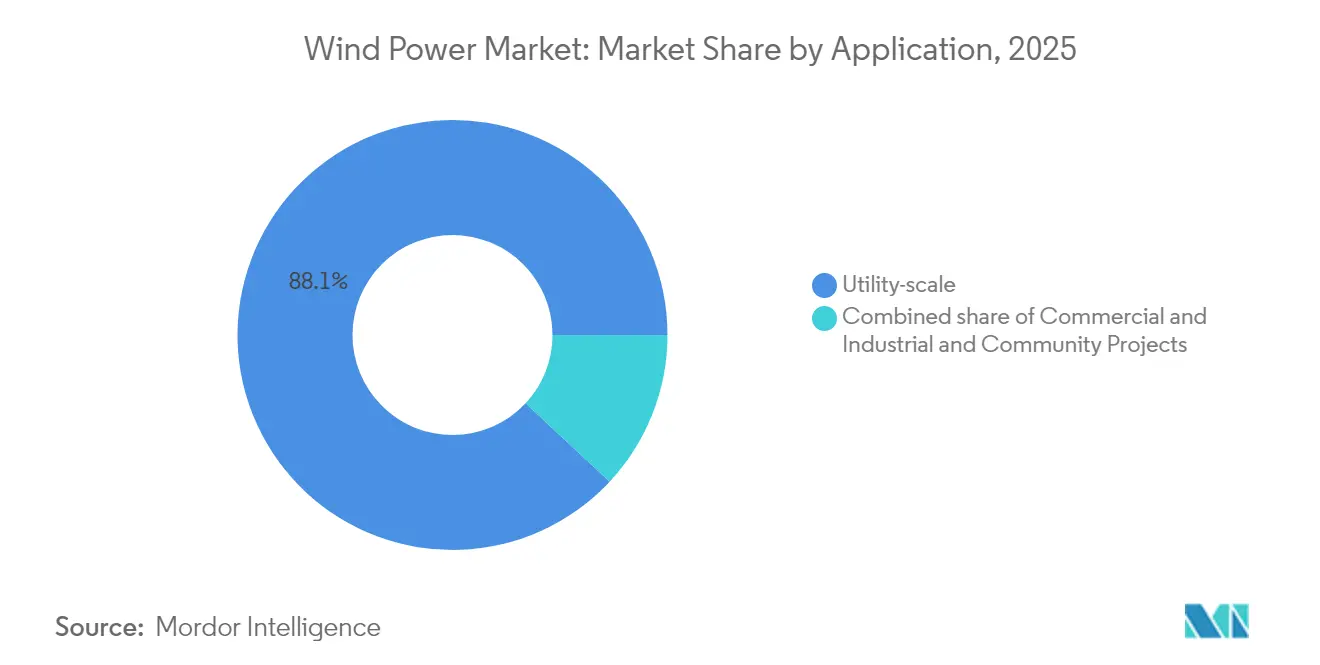
- By application, utility-scale projects accounted for 88.05% of the wind power market size in 2025, whereas commercial and industrial projects are advancing at a 13.14% CAGR to 2031.
- By geography, Asia-Pacific led with 53.55% of global capacity in 2025 and is progressing at an 11.42% CAGR through 2031.
Note: Market size and forecast figures in this report are generated using Mordor Intelligence’s proprietary estimation framework, updated with the latest available data and insights as of 2026.
Global Wind Power Market Trends and Insights
Drivers Impact Analysis*
| Driver | (~) % Impact on CAGR Forecast | Geographic Relevance | Impact Timeline |
|---|---|---|---|
| Cost declines in ≥15 MW turbines | +2.7% | APAC and Europe | Medium term (2-4 years) |
| Corporate PPAs from data-center operators | +2.0% | North America, EU, expanding into APAC | Short term (≤2 years) |
| Inflation Reduction Act & EU wind package | +1.8% | North America and EU | Medium term (2-4 years) |
| Repowering early-2000s onshore fleets | +1.3% | North America, EU, selective APAC markets | Long term (≥4 years) |
| Maritime green-hydrogen offtake agreements | +0.7% | EU North Sea, broadening to APAC and MEA | Long term (≥4 years) |
| AI-enabled O&M drones | +0.5% | Global | Medium term (2-4 years) |
| Source: Mordor Intelligence | |||
Rapid cost declines in ≥15 MW turbines
Larger turbines cut foundation, cabling, and maintenance costs by 15-20% compared with smaller units, thereby lifting capacity factors by 8-12% at taller hub heights.(1)These economics allow developers to pursue sites that once sat at the margin of commercial viability and, in many offshore locations, to reach grid parity. Transportation bottlenecks created by 100-meter-plus blades persist, but port upgrades and heavy-lift vessel orders are underway, suggesting a short-lived constraint. The resulting capital-efficiency gain positions the wind power market for sustained cost competitiveness.
Surge in corporate PPAs from data-center operators
Major cloud providers are signing 10- to 20-year PPAs that bundle electricity with renewable energy certificates and 24/7 clean-energy matching guarantees. These contracts de-risk cash flows for new projects and encourage developers in the wind power industry to size wind farms around data-center load profiles, particularly near North Sea interconnectors and U.S. coastal grids. Electricity demand from artificial-intelligence workloads is expected to climb 35-50% by 2040, turning renewable procurement into an operational necessity rather than a CSR initiative.
Inflation Reduction Act & EU wind power package
Section 45Y production tax credits of USD 0.026 per kWh offer price certainty through 2032, though potential political shifts may fast-track a phase-down to 2026. REPowerEU seeks 1,236 GW of wind by 2030 and pairs permitting simplification with domestic-content rules, nudging manufacturers to localize supply chains. Combined, these frameworks lower the cost of capital and accelerate final investment decisions across both continents.
Repowering of early-2000s onshore fleets
Around 75,000 legacy turbines reach end-of-life this decade, opening a USD 50 billion repowering opportunity in the wind power industry. Replacing 1-2 MW machines with 5-6 MW models can triple output on existing pads while using already-built interconnects, widening the addressable market and shortening project timelines.
Restraints Impact Analysis*
| Restraint | (~) % Impact on CAGR Forecast | Geographic Relevance | Impact Timeline |
|---|---|---|---|
| Commodity price volatility (steel, rare-earths) | -1.7% | Global, APAC manufacturing hubs | Short term (≤2 years) |
| Lengthy permitting timelines (≥5 yrs EU avg.) | -1.1% | EU, North America | Medium term (2-4 years) |
| Grid-interconnection queue congestion | -0.8% | North America, selected EU markets | Medium term (2-4 years) |
| Anti-whale litigation targeting offshore farms | -0.4% | United States East Coast | Short term (≤2 years) |
| Source: Mordor Intelligence | |||
Commodity price volatility (steel, rare-earths)
Steel makes up roughly 70% of turbine mass, and a 10% spot-price swing can nudge project capital expenditure by up to 3 percentage points Rare-earth magnets remain 70% sourced from China, so supply shocks in neodymium and dysprosium add further unpredictability. Some OEMs explore electrically excited generators to sidestep these metals, though the switch can trim efficiency by around 2%.(2)
Lengthy permitting timelines (≥5 yrs EU avg.)
Complex environmental reviews and multi-agency sign-offs stretch European offshore projects in the wind power industry to seven-year lead times. The EU’s one-stop digital portals start to cut delays, yet disparate regional rules mean the permitting gauntlet still varies widely.
*Our forecasts treat driver/restraint impacts as directional, not additive. The impact forecasts reflect baseline growth, mix effects, and variable interactions.
Segment Analysis
By Location: Offshore acceleration despite onshore dominance
Onshore turbines held 92.45% of installed capacity in 2025, reflecting entrenched supply chains and quicker builds. Nevertheless, offshore assets post a 15.62% CAGR through 2031, due to stronger winds, fewer land-use conflicts, and the readiness of floating foundations. Japan’s first barge-type floater proves commercial viability for typhoon-prone deep-water zones. With 16 MW machines now standard offshore, fewer turbines deliver the same megawatts, compressing installation timelines and lowering lifecycle costs. The wind power market thus tilts toward sea-based growth in land-scarce economies while onshore repowering drives gains in mature regions.
Emerging-economy developers favor onshore builds for lower capex and faster returns, but falling floating-foundation prices begin to level the field. As coastal grids upgrade, offshore output can smooth solar-driven daytime peaks and night-time dips, easing integration challenges.


By Turbine Capacity: Supersized units drive efficiency gains
Turbines above 6 MW advance at a 17.28% CAGR, underpinned by hub heights over 150 meters and rotor spans beyond 220 meters. These giants reach capacity factors near 60% offshore, twice the yield of many legacy onshore units in the wind power market. The 3-6 MW class still holds 46.05% of capacity in 2025, mainly because many roads and cranes can already accommodate them. As rail-car adapters and blade-split kits reach the market, transport limits ease, letting even inland projects pivot to 5 MW-plus machines.
Units up to 3 MW now sit in niche roles such as remote microgrids in the wind power industry. OEMs wind down R&D in this bracket, reallocating funds to carbon-fibre spar caps and advanced airfoils for 15-20 MW rotors. This narrows model choice for smaller developers but sustains a second-hand market as older fleets are repowered.
By Application: Corporate procurement reshapes demand patterns
Utility-scale plants control 88.05% of installed capacity, yet commercial and industrial customers log the swiftest 13.14% CAGR. The wind power market now serves data-center clusters that need 24/7 clean energy, sparking new contracting models such as virtual PPAs with hourly matching. Behind-the-meter turbines shield factories from grid price spikes and enhance power-quality resilience. Community projects remain sparse outside Northern Europe, held back by zoning and acoustic limits, though rural cooperatives in the United States show incremental gains where feed-in tariffs cover capital costs.
Corporate buyers increasingly demand bundled storage to smooth variability, prompting developers to pair wind with lithium-ion batteries or green-hydrogen peakers. These hybrid deals fetch premium pricing that offsets additional capital, widening the solution set for industrial decarbonization in the wind power industry.
Geography Analysis
Asia-Pacific dominated with 53.55% wind power market share of global capacity in 2025 and maintains an 11.42% CAGR to 2031. China alone added 76 GW in 2024, blending record onshore builds with a South China Sea offshore push. India’s auction pipeline targets 140 GW by 2030, though state-level grid upgrades lag capacity growth. Japan and South Korea lean toward floating projects to sidestep land scarcity, and Vietnam eyes early-stage tenders that link wind to green-ammonia exports. The wind power market, therefore, benefits from integrated supply chains and government purchase guarantees across the region.
Europe anchors offshore innovation. The North Sea hosts 60% of installed offshore capacity, with Denmark and the Netherlands trimming permitting times via one-stop agencies. REPowerEU’s local-content rules spur turbine factories in Spain, Poland, and France, while green-hydrogen pilot plants secure new offtake channels. Repowering across Germany, Denmark, and Spain adds capacity without new land, relying on upgraded 6 MW machines on existing pads.
North America sees mixed momentum. The January 2025 moratorium on new federal offshore leases stalls fresh acreage but does not affect active projects. Eighteen state attorneys general contest the ban, leaving a court-driven timeline for resolution. Onshore growth stays healthy in Midwestern grids, yet queue congestion in PJM and MISO regions stretches interconnection timelines. The Inflation Reduction Act still underpins project economics pending legislative clarity.
Middle East and Africa emerge as growth frontiers in the wind power market. Egypt’s 10 GW build-own-operate deal and Morocco’s hybrid wind-hydrogen hubs exemplify regional ambition. Namibia and South Africa plan cross-border grid links to tap their formidable wind corridors. Latin America benefits from Brazil’s Rio Grande do Sul and Chile’s Patagonia resources, yet long-haul transmission investment must catch up to exploit full potential.

Competitive Landscape
Moderate concentration defines the global competitive picture. Chinese OEMs, Goldwind and MingYang, ship ever-larger turbines at competitive prices, leveraging integrated domestic steel and magnet supply. Western peers, Vestas, Siemens Gamesa, and GE Vernova, emphasize technology leadership through floating-foundation patents, lidar-guided controls, and AI-fuelled O&M platforms. Policy drives partial supply fragmentation as Europe and the United States encourage local content, nudging developers toward allied suppliers despite higher capex.
Strategic consolidation continues. Constellation Energy’s USD 27 billion Calpine buyout deepens its renewables backlog, while Brookfield’s Scout Clean Energy acquisition underscores institutional appetite for onshore portfolios. Integrated oil majors reallocate upstream budgets into floating wind, capitalizing on offshore logistics know-how. Venture capital flows toward blade-repair robotics and drone inspection start-ups, reflecting white-space opportunities in O&M tech.
Patent filings surge in carbon-fibre spar caps, floating mooring systems, and hydrogen-ready offshore substations. Heavy-lift vessel owners book multi-year charters, indicating confidence in supersized rotor demand through 2030. Market players that balance price competitiveness with supply-chain diversity appear best positioned as the wind power market matures into critical power infrastructure.
Wind Power Industry Leaders
Acciona Energia SA
Duke Energy Corporation
Orsted A/S
NextEra Energy, Inc.
Electricité de France (EDF) S.A.
- *Disclaimer: Major Players sorted in no particular order


Recent Industry Developments
- June 2025: Ocean Winds has successfully delivered the first power from the Îles d’Yeu and Noirmoutier offshore wind farm, marking a major milestone in the project’s development. The milestone follows the start of testing operations in May and represents the initial connection of power to France’s national grid.
- June 2025: Aker Solutions has secured a contract to deliver the steel substructure for the BalWin2 high-voltage direct current (HVDC) converter station, part of the BalWin2 offshore wind grid connection project in the German Baltic Sea.
- May 2025: Eighteen U.S. states sue to overturn the Trump offshore moratorium, arguing the order threatens USD 100 billion of planned projects.
- April 2025: GE Vernova has commissioned the 147 MW Abukuma wind farm in Fukushima, Japan, making it the largest onshore wind farm in the country. The wind farm is a project of Fukushima Fukko Furyoku, LLC, a joint venture led by Sumitomo Corporation, and utilizes 46 of GE Vernova's 3.2 MW–103m onshore wind turbines.


Global Wind Power Market Report Scope
Wind power is generated by the force of the wind, mainly through the rotor, which transforms kinetic energy into mechanical energy, and through the generator, thus using the principle of Faraday's law of electromagnetic induction, which finally converts this mechanical energy into electrical energy. For each segment, the market sizing and forecasts have been done based on installed capacity (GW). The global wind power market report includes:
By Location
| Onshore |
| Offshore |
By Turbine Capacity
| Up to 3 MW |
| 3 to 6 MW |
| Above 6 MW |
By Application
| Utility-scale |
| Commercial and Industrial |
| Community Projects |
By Component (Qualitative Analysis)
| Nacelle/Turbine |
| Blade |
| Tower |
| Generator and Gearbox |
| Balance-of-System |
By Geography
| North America | United States |
| Canada | |
| Mexico | |
| Europe | Germany |
| Spain | |
| United Kingdom | |
| France | |
| Norway | |
| Turkey | |
| Nordic (ex-Norway) | |
| Russia | |
| Rest of Europe | |
| Asia Pacific | China |
| India | |
| Japan | |
| Vietnam | |
| Indonesia | |
| Malaysia | |
| Thailand | |
| Rest of Asia Pacific | |
| South America | Brazil |
| Argentina | |
| Chile | |
| Colombia | |
| Rest of South America | |
| Middle East and Africa | Saudi Arabia |
| United Arab Emirates | |
| Egypt | |
| Nigeria | |
| Qatar | |
| Rest of Middle East & Africa |
| By Location | Onshore | |
| Offshore | ||
| By Turbine Capacity | Up to 3 MW | |
| 3 to 6 MW | ||
| Above 6 MW | ||
| By Application | Utility-scale | |
| Commercial and Industrial | ||
| Community Projects | ||
| By Component (Qualitative Analysis) | Nacelle/Turbine | |
| Blade | ||
| Tower | ||
| Generator and Gearbox | ||
| Balance-of-System | ||
| By Geography | North America | United States |
| Canada | ||
| Mexico | ||
| Europe | Germany | |
| Spain | ||
| United Kingdom | ||
| France | ||
| Norway | ||
| Turkey | ||
| Nordic (ex-Norway) | ||
| Russia | ||
| Rest of Europe | ||
| Asia Pacific | China | |
| India | ||
| Japan | ||
| Vietnam | ||
| Indonesia | ||
| Malaysia | ||
| Thailand | ||
| Rest of Asia Pacific | ||
| South America | Brazil | |
| Argentina | ||
| Chile | ||
| Colombia | ||
| Rest of South America | ||
| Middle East and Africa | Saudi Arabia | |
| United Arab Emirates | ||
| Egypt | ||
| Nigeria | ||
| Qatar | ||
| Rest of Middle East & Africa | ||


Key Questions Answered in the Report
How large is the wind power market in 2026?
Installed capacity reaches 1,404 GW, and it is projected to climb to 2,314 GW by 2031 at a 10.52% CAGR.
Which region leads global wind installations?
Asia-Pacific holds 53.55% of worldwide capacity in 2025, driven mainly by China’s record annual additions.
Why are ≥15 MW turbines significant?
They lower installation and maintenance costs by up to 20% per gigawatt and lift capacity factors above 60% in optimal sites.
How do corporate PPAs influence wind deployment?
Long-term deals from data-center operators secure project revenue and push developers to build near digital-economy load hubs.
What is the main bottleneck for new offshore projects?
Lengthy multi-agency permitting processes, which can stretch European project lead times to seven years.
Is floating wind commercially viable today?
Early projects in Japan and France show bankability, and floating foundations now post a 34.2% CAGR in component demand.
Page last updated on:


