Market Overview
| Study Period | 2021 - 2031 |
|---|---|
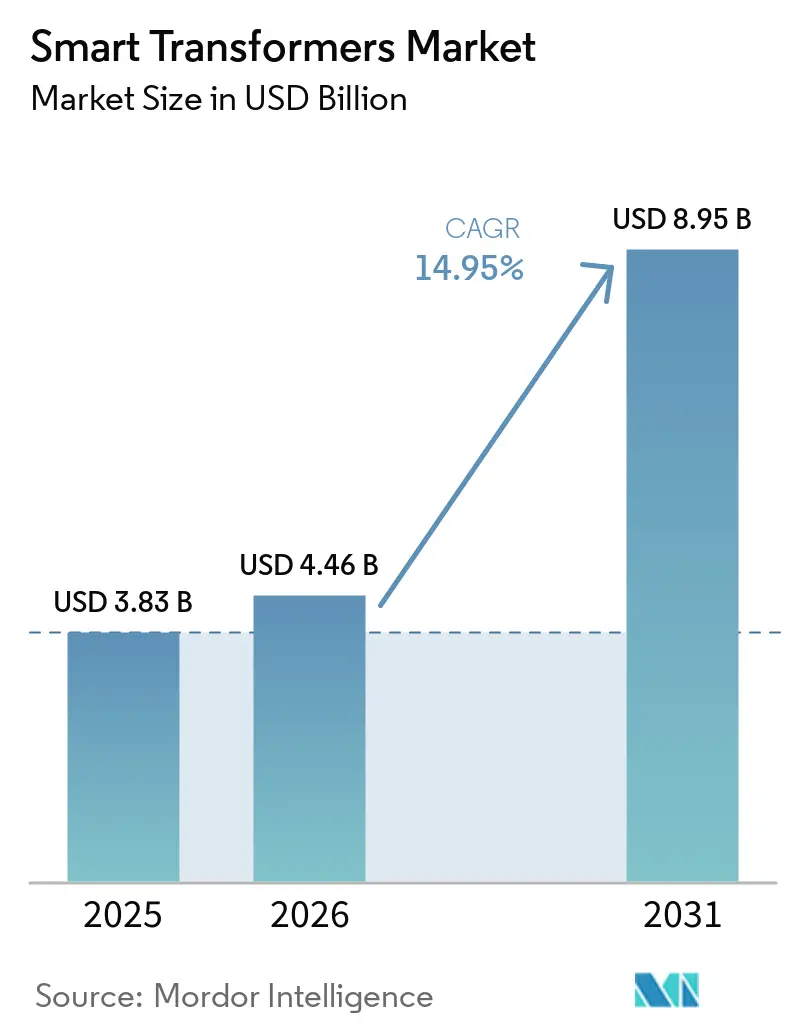
| Market Size (2026) | USD 4.46 Billion |
| Market Size (2031) | USD 8.95 Billion |
| Growth Rate (2026 - 2031) | 14.95% CAGR |
| Fastest Growing Market | Asia Pacific |
| Largest Market | Asia Pacific |
| Market Concentration | Medium |
Major Players *Disclaimer: Major Players sorted in no particular order Image © Mordor Intelligence. Reuse requires attribution under CC BY 4.0. | |
Smart Transformers Market Analysis by Mordor Intelligence
The Smart Transformers Market size is expected to grow from USD 3.83 billion in 2025 to USD 4.46 billion in 2026 and is forecast to reach USD 8.95 billion by 2031 at 14.95% CAGR over 2026-2031.
Utilities are moving from reactive maintenance to real-time grid intelligence, embedding sensors, cyber-secure communications, and automated voltage regulation directly into transformer fleets. Government decarbonization mandates and the electrification of freight rail compress project timelines, while the wave of 1970s- and 1980s-era iron-core replacements has created a once-in-a-generation procurement cycle favoring digitally native designs. Hardware still captures most spending, yet subscription software and analytics platforms are outpacing physical equipment growth as utilities shift toward outcome-based service contracts. Asia-Pacific leads demand on the back of China’s provincial grid-modernization tenders and India’s smart-city rollouts, whereas North America’s market momentum depends on federal tax credits that offset the premium pricing of intelligent assets. Competitive intensity remains moderate: the top five suppliers hold a combined 48% share, but regional specialists are winning distribution-class orders by bundling IoT gateways with commodity cores, undercutting incumbents by 20-25%.
Key Report Takeaways
- By type, distribution transformers held 63.3% of the smart transformers market share in 2025, while solid-state power-electronics units are expected to expand at a 21.4% CAGR through 2031.
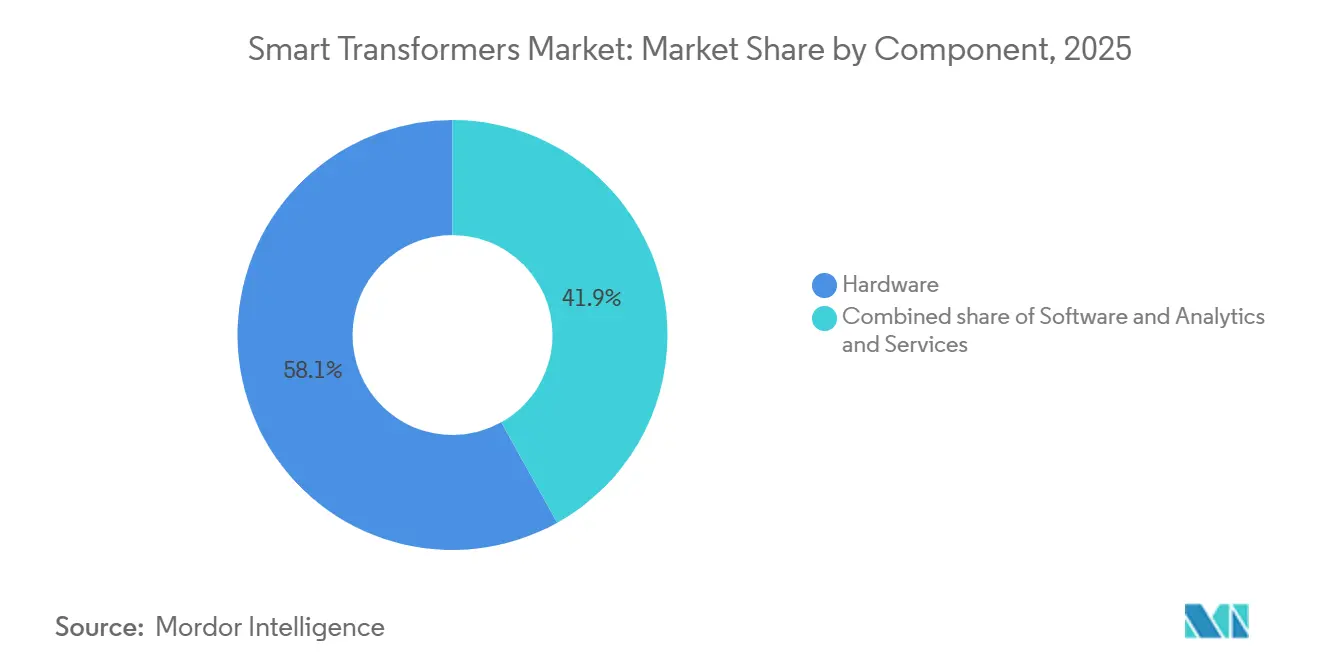
- By component, hardware dominated with a 58.1% revenue share in 2025, but software and analytics platforms are projected to grow at a 17.3% CAGR, the fastest among all components.
- By voltage class, units below 69 kV captured 53.2% of the smart transformers market size in 2025 and are expected to advance at a 15.2% CAGR over 2026-2031.
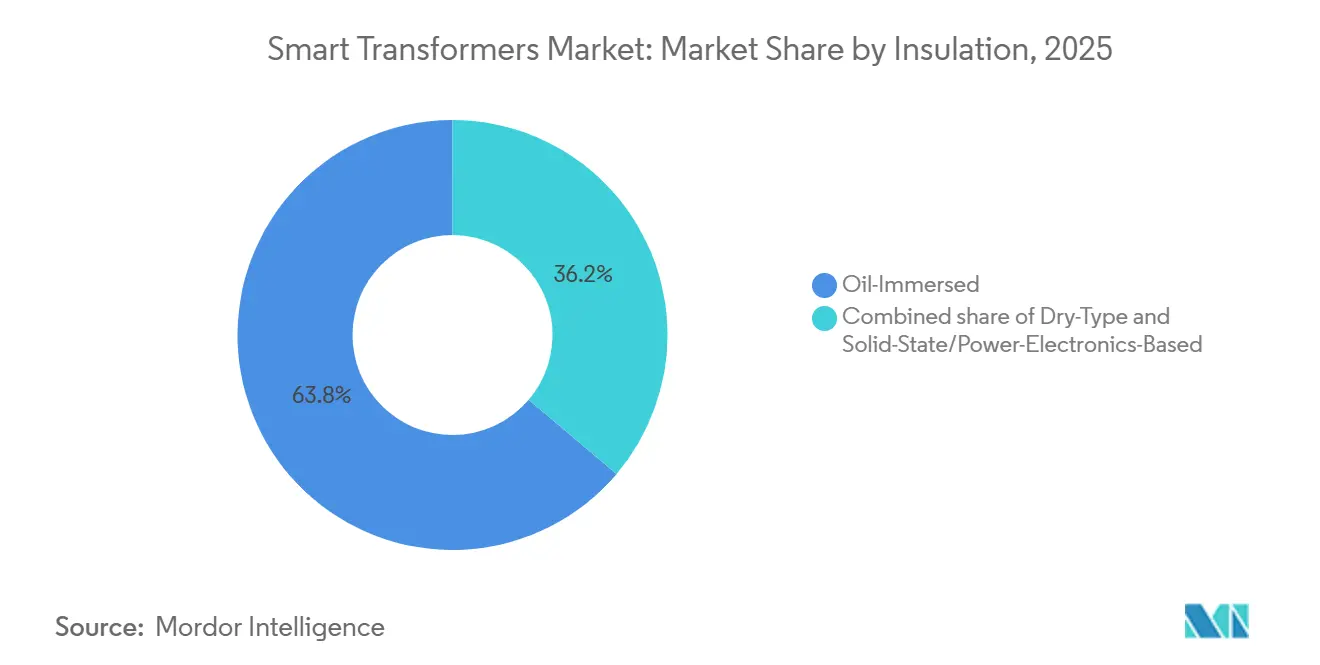
- By insulation, the oil-immersed segment led with a share of 63.8% in 2025, while the solid-state/power-electronics-based segment is expected to grow the fastest at 21.4% CAGR through 2031.
- By phase, the three-phase segment held 83% of the market in 2025, and the same is projected to grow at 15.3% CAGR over 2026-2031.
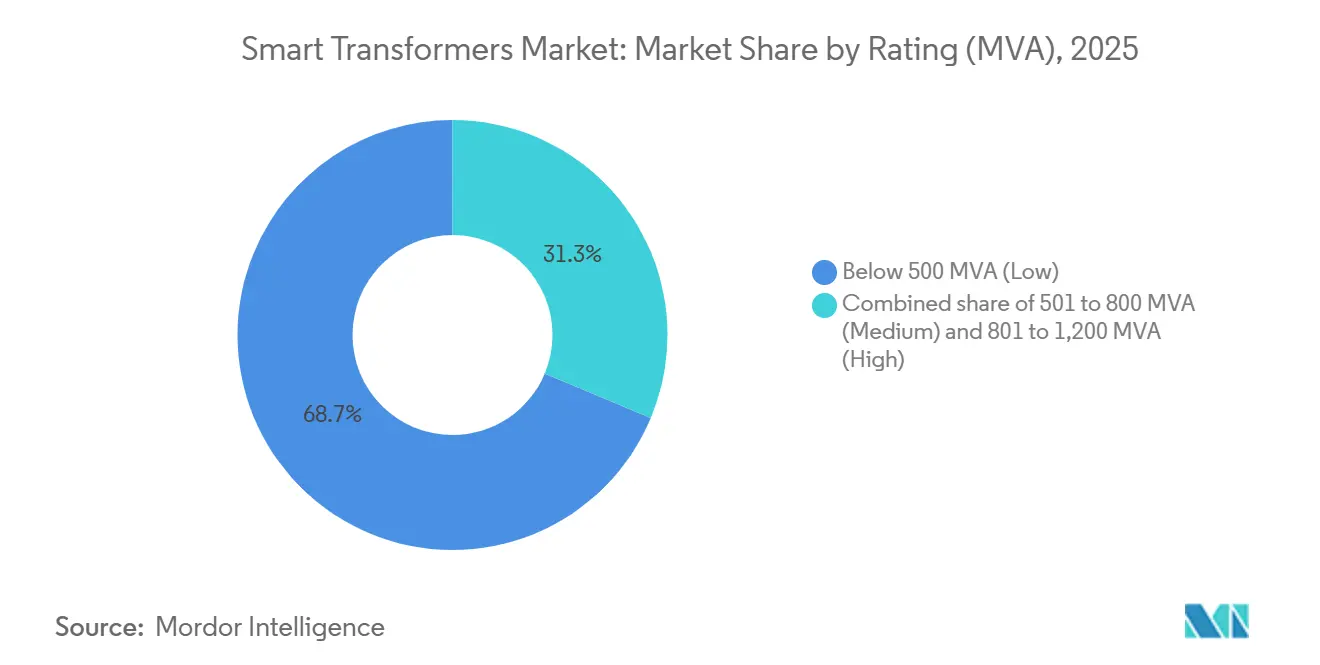
- By rating (MVA), below 500 MVA (low) dominated with a share of 68.7% in 2025, and is expected to expand at a 15.7% CAGR, the fastest through 2031.
- By application, EV fast-charge infrastructure is expected to grow at a 19.6% CAGR, whereas smart-grid utility deployments maintained the largest 54.4% revenue share in 2025.
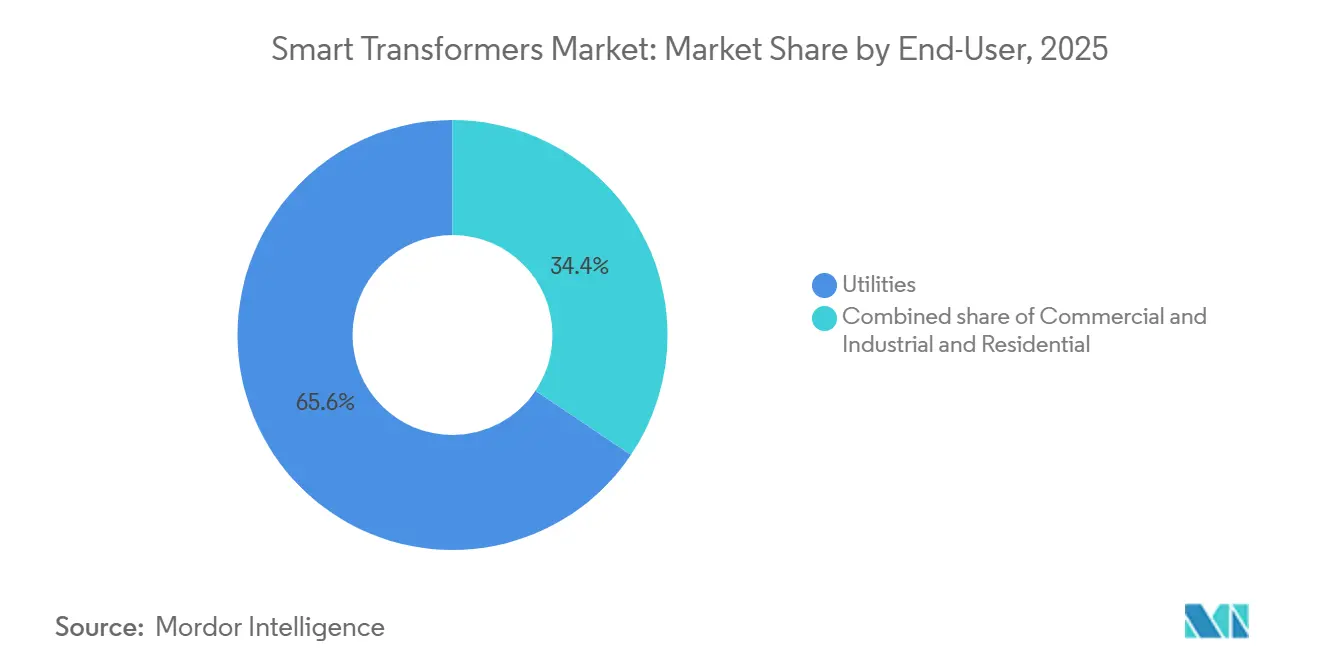
- By end-user, utilities captured 65.6% of the smart transformers market size in 2025, and the same is expected to expand at 15.8% through 2031.
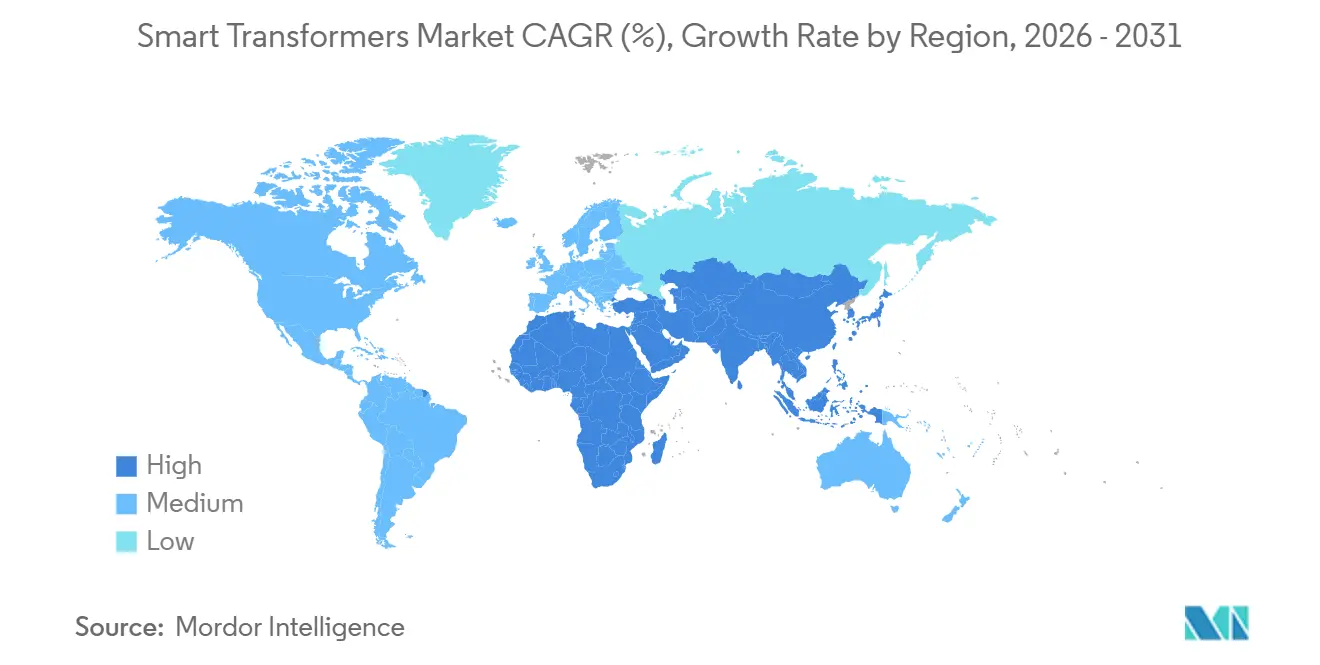
- By geography, Asia-Pacific commanded 44.2% of 2025 revenue and is expected to expand at a 16.7% CAGR, the quickest regional pace to 2031.
Note: Market size and forecast figures in this report are generated using Mordor Intelligence’s proprietary estimation framework, updated with the latest available data and insights as of 2026.
Global Smart Transformers Market Trends and Insights
Drivers Impact Analysis*
| Driver | (~) % Impact on CAGR Forecast | Geographic Relevance | Impact Timeline |
|---|---|---|---|
| Aging grid infrastructure upgrades | 3.2% | Global, peak in North America & Europe | Medium term (2-4 years) |
| Renewable-integration voltage volatility | 2.8% | Global, concentrated in APAC & EU | Short term (≤2 years) |
| Government smart-grid funding surges | 2.5% | North America, EU, China, India | Medium term (2-4 years) |
| AI-based predictive-maintenance adoption | 1.9% | Global, early gains in North America & Japan | Long term (≥4 years) |
| Cyber-secure substation mandates | 1.6% | North America, EU, Australia | Medium term (2-4 years) |
| Rail electrification of freight corridors | 1.4% | India, Brazil, Southeast Asia | Long term (≥4 years) |
| Source: Mordor Intelligence | |||
Aging Grid Infrastructure Upgrades
North American and European utilities operate fleets in which 38% of distribution transformers are older than 35 years, a threshold beyond which mechanical failure risk and insurance premiums surge. The U.S. Department of Energy injected USD 3.5 billion into substation modernization in 2024, steering grant criteria toward digital-twin-enabled transformers capable of live thermal-aging simulation.[1]Australian Energy Market Operator, “Inverter Standards for Renewable Zones,” aemo.com.au In Germany, TenneT plans to replace 420 high-voltage units by 2028, insisting on IEC 61850 interoperability to streamline multi-vendor fleets. These accelerated tenders shorten lead times and favor vertically integrated suppliers with captive steel and winding operations. IEC 61850 conformity has effectively become mandatory across European bids, lowering integration risk and setting a uniform data schema for supervisory systems.
Renewable-Integration Voltage Volatility
High solar and wind penetration triggers sub-second voltage excursions that exceed the tracking capability of mechanical tap changers. NREL’s 2024 feeder study recorded more than 200 daily voltage swings beyond ±5% of nominal when instantaneous solar penetration crosses 30%.[2]U.S. Department of Energy, “Grid Resilience and Innovation Partnerships,” energy.gov Smart transformers equipped with wide-bandgap converters absorb or inject reactive power within 10 milliseconds, lifting renewable hosting capacity by up to 25% without reconductoring. Australia’s market operator now mandates IEEE 1547-2018 functions for all new units above 10 MVA in renewable zones, accelerating adoption in Queensland and South Australia.[3]National Renewable Energy Laboratory, “Feeder Voltage Excursions Under High PV,” nrel.gov The regulatory shift reduces curtailment costs and incentivizes utilities to deploy fast-acting devices rather than static compensation banks.
Government Smart-Grid Funding Surges
China has allocated RMB 280 billion (USD 39 billion) for grid digitalization under its 14th Five-Year Plan, with almost a quarter earmarked for transformer upgrades. India’s Revamped Distribution Sector Scheme dedicates INR 310 billion (USD 3.7 billion) to smart-meter integration that depends on AMI-ready transformers. The EU’s Connecting Europe Facility approved €1.8 billion for cross-border grids in 2024, requiring NIS2-aligned cybersecurity features down to the component level.[4]European Commission, “Connecting Europe Facility Awards,” europa.eu In the United States, a 30% tax credit under the Inflation Reduction Act trims payback periods for smart assets from 9 years to under 6. These fiscal incentives elevate lifecycle software-support ranking to roughly one-quarter of total ownership cost during tender evaluations.
AI-Based Predictive-Maintenance Adoption
Machine-learning models trained on dissolved-gas, partial-discharge, and thermal data now predict failures 6-12 months ahead, enabling utilities to schedule maintenance in low-demand windows and curb emergency replacements that cost triple the planned amount. Hitachi Energy’s Lumada platform monitors more than 14,000 units globally and reports 92% accuracy on winding hot-spot forecasts. Siemens recorded a 41% jump in recurring analytics subscriptions during 2024 as utilities migrate from perpetual licenses to usage-based billing. Edge-compute modules embedded in transformer cabinets remove cloud-latency constraints critical for islanded microgrids. Regulators are catching up; NERC’s draft guidelines in 2024 accept AI-driven condition monitoring as a substitute for fixed-interval maintenance, provided models span at least three seasonal cycles.
Restraints Impact Analysis*
| Restraint | (~) % Impact on CAGR Forecast | Geographic Relevance | Impact Timeline |
|---|---|---|---|
| High upfront CAPEX vs. conventional units | -2.1% | Global, acute in emerging markets | Short term (≤2 years) |
| Transformer-level cyber-risk exposure | -1.3% | North America, EU, critical infrastructure zones | Medium term (2-4 years) |
| SiC device supply shortages | -1.8% | Global, supply concentrated in Japan & US | Short term (≤2 years) |
| Certification bottlenecks in utility specs | -1.1% | North America, EU | Medium term (2-4 years) |
| Source: Mordor Intelligence | |||
High Upfront CAPEX vs Conventional Units
Smart transformers cost 1.8-2.3 times more than traditional oil-immersed designs, challenging municipal utilities with tight rate ceilings. EPRI pricing in 2024 showed USD 420,000-510,000 for a 25 MVA smart unit against USD 185,000-220,000 for a standard device. Lifecycle savings accrue after year seven, too distant for utilities tied to 12-15% internal-rate-of-return hurdles. Vendors now pilot leasing and transformer-as-a-service models that convert CAPEX into OPEX, smoothing balance sheets but adding contract-management complexity. Depreciation schedules calibrated for 40-year lifetimes clash with 12-15-year hardware refresh cycles, risking stranded costs and slowing procurement.
Transformer-Level Cyber-Risk Exposure
Intelligent transformers create device-level entry points into critical infrastructure. Utilities in the U.S. and EU must certify compliance with NIS2 and NERC CIP guidelines, elongating tender cycles and layering cost for continuous patch management. A 2025 SANS survey found that 62% of utilities delayed smart-device rollouts pending site-acceptance testing of intrusion-detection functionality.
*Our forecasts treat driver/restraint impacts as directional, not additive. The impact forecasts reflect baseline growth, mix effects, and variable interactions.
Segment Analysis
By Type: Distribution Units Anchor Volume, Solid-State Niche Accelerates
Distribution transformers captured 63.3% of 2025 shipments, securing the largest smart transformers market share, and are projected to expand at a 16.0% CAGR through 2031. Lower voltage ratings, modular footprints, and simple field retrofits make distribution units the gateway for grid-edge intelligence across urban and rural feeders. Utilities exploit prepaid metering and integrated IoT telemetry to curb non-technical losses, a capability rarely needed in power-class installations. Power transformers above 69 kV trail at a 12.8% CAGR because their 45-50-year lifespans and strict dielectric tolerances complicate retrofits. The smart transformers market size for distribution units is forecast to expand sharply as aging fleets coincide with urban load growth and distributed energy resource penetration.
Solid-state, power-electronics-based units remain below single-digit penetration but hold the steepest growth trajectory. Field pilots in Japan and Germany validate voltage-regulation accuracy and introduce software-defined substation concepts that bypass mechanical tap changers. As silicon carbide costs decline, vendors plan modular retrofits that upgrade conventional cores into hybrid digital assets, preserving sunk capital while unlocking advanced functionality. This hybrid pathway underpins smart transformers market acceptance within risk-averse utilities.
By Component: Software Revenue Streams Reshape Vendor Economics
Hardware commanded 58.1% revenue share in 2025, yet subscription-based analytics platforms are registering a 17.3% CAGR to 2031. OEMs now bundle cloud dashboards, edge firmware, and cybersecurity updates as separate SKUs, decoupling profit pools from one-time hardware sales. The smart transformers market size for software is still modest but produces gross margins above 70%, luring incumbents to restructure sales incentives around attach rates.
Services, installation, commissioning, and remote diagnostics run at a 14.1% CAGR and increasingly feature performance-based guarantees that shift outage penalties onto vendors. Major players operate 24/7 diagnostics centers promising sub-4-hour response windows, a differentiator midsize firms struggle to match. This service pivot elevates lifetime value and locks customers into proprietary ecosystems, supporting smart transformers market growth even as hardware commoditizes.


By Voltage Class: Distribution Voltage Dominates, Extra-High Ratings Remain Cautious
Transformers below 69 kV captured 53.2% of 2025 revenue and are projected to grow at a 15.2% CAGR, reflecting dense urban feeder counts and rising rooftop solar penetration. Sub-transmission and high-voltage classes grow at slightly lower rates as they upgrade to manage bidirectional power flows. The smart transformers market size in the extra-high-voltage bracket lags due to conservative utility risk postures and bespoke engineering that limits modular retrofits.
Distribution-class economies of scale enable mass-produced sensor assemblies compatible with IEC 61850, while EHV devices often require custom firmware and insulation coordination studies. China’s pilot of 1,000 kV smart units may accelerate adoption if early reliability proves sound, potentially unlocking another layer of smart transformers market opportunity post-2028.
By Insulation: Oil Immersed Retains Majority, Solid-State Designs Gain Pace
Oil-immersed products hold 63.8% share because mineral oil remains the most cost-effective dielectric for high-power ratings. Dry-type units secure 28% share, favored in hospitals, data centers, and offshore substations where fire or environmental risk outweighs the efficiency trade-off. Solid-state topologies command less than 8% of the smart transformers market size today but expand at 21.4% CAGR on the strength of instantaneous voltage regulation and harmonic filtering.
Environmental policy accelerates the shift: the EU’s F-Gas expansion pushes utilities toward biodegradable natural esters, while data-center operators value dry-type designs for fire safety. Hitachi Energy and Siemens pilots prove solid-state reliability in the field, and as semiconductor supply constraints ease, utilities will increasingly specify power-electronics capability in new tenders, deepening smart transformers market penetration.
By Phase: Three-Phase Dominance Continues, Single-Phase Supports Rural Growth
Three-phase configurations comprised 83% of 2025 shipments and will advance at a 15.3% CAGR to 2031, preserving the core of the smart transformers market demand. Balanced load handling and lower per-MVA cost keep three-phase units standard for industrial and utility feeders. Single-phase units, while only 17% of volume, grow at 13.1% CAGR on the back of rural electrification programs in Asia and microgrid deployments in North America.
India’s Saubhagya scheme has already rolled out millions of single-phase smart transformers equipped with theft-deterrent prepaid metering. Meanwhile, North American utilities integrate arc-fault detection into split-phase residential units to mitigate wildfire risk. Diverse phase architectures thus widen smart transformers market addressability across geographies and grid topologies.
By Rating (MVA): Low Ratings Lead, Medium & High Ratings Serve Backbone
Transformers below 500 MVA delivered 68.7% of 2025 revenue and are projected to climb at a 15.7% CAGR, aligning with modular distribution investments. Medium and high ratings grow more slowly due to longer procurement and factory-test cycles, but digital-twin modeling and fiber-optic sensor integration are unlocking incremental smart transformers market gains even for 800-MVA plus assets.
High-rating units face thermal-management challenges when embedding sensors, requiring specialized insulation coordination. China’s State Grid pilots digital-twins on 1,000 MVA units, aiming to stretch service life by up to a decade. Containerized sub-500 MVA packages for disaster recovery represent a fast-deploying niche supporting post-storm grid restoration in North America and Asia.
By Application: Smart Grid Leads, EV Charging Surges
Smart-grid utility projects captured 54.4% of 2025 revenue, underpinning the base smart transformers market demand. EV fast-charge infrastructure is the breakout application, expanding at a 19.6% CAGR as 350 kW dispensers demand sub-cycle voltage stabilization. Traction locomotive electrification also accelerates, adding regenerative braking capability that lowers railroad energy costs by tens of millions annually.
Industrial power-quality systems in semiconductor fabs and data centers drive steady growth, purchasing transformers with harmonic filtering that shields sensitive processes. Tesla’s V4 Supercharger specs for 20% temporary overload capacity highlight how high-peak EV charging shapes transformer design envelopes, reinforcing smart transformers market differentiation.
By End-User: Utilities Dominate, C&I Buyers Gain Ground
Utilities controlled 65.6% of 2025 spending and grew at 15.8% CAGR, guided by grid-modernization mandates and the aging fleet cycle. Commercial and industrial (C&I) customers, now at 28% share, are adopting on-site microgrids and power-quality solutions, boosting the smart transformers market volume at 13.9% CAGR. Residential uptake stays marginal but advances as battery-storage adoption demands anti-islanding protection.
Utilities rate vendors on total-cost-of-ownership and guaranteed spares, whereas C&I buyers prioritize payback and penalty avoidance for power-factor and harmonic non-compliance. Community-solar pilots that aggregate residential demand behind utility-owned smart transformers may unlock a larger household segment without burdening individual homeowners with interconnection paperwork.
Geography Analysis
Asia-Pacific generated 44.2% of the global smart transformers market revenue in 2025 and is forecast to expand at a 16.7% CAGR through 2031. China’s State Grid awarded contracts for 87,000 IoT-ready distribution units in Q3 2024, prioritizing local suppliers under content rules. India’s state distribution companies now procure roughly 120,000 smart units annually to meet loss-reduction targets. Japan and South Korea pioneer solid-state pilots, achieving 97.8% conversion efficiency, while ASEAN governments deploy single-phase prepaid transformers to cut non-technical losses.
North America held 26% share in 2025, driven by USD 65 billion federal grid funding and a 30% tax credit that slices effective CAPEX premiums. Wildfire mitigation shapes transformer specs in California and Texas, requiring arc-fault detection and remote disconnect. Canada orders synthetic-ester units rated to –50 °C for Arctic climates, and Mexico’s CFE pursues smart transformers to trim 25% non-technical losses by 2027. IEEE and ANSI certification prolong commercial launches by up to two years, modestly moderating smart transformers market growth relative to Asia.
Europe accounted for 21% of 2025 sales, with Germany, the U.K., and France generating 58% of regional revenue. EU funding stipulates NIS2 cybersecurity and Ecodesign efficiency thresholds that effectively mandate amorphous-metal cores. Southern and Eastern European countries grow faster, 14-16% CAGR, thanks to cohesion-fund co-financing. Stringent price-control frameworks incentivize lifespan-extending features such as sub-second fault localization to minimize interruption penalties. Overall, diversified regulatory drivers keep the smart transformers market expanding across all major European grids.

Competitive Landscape
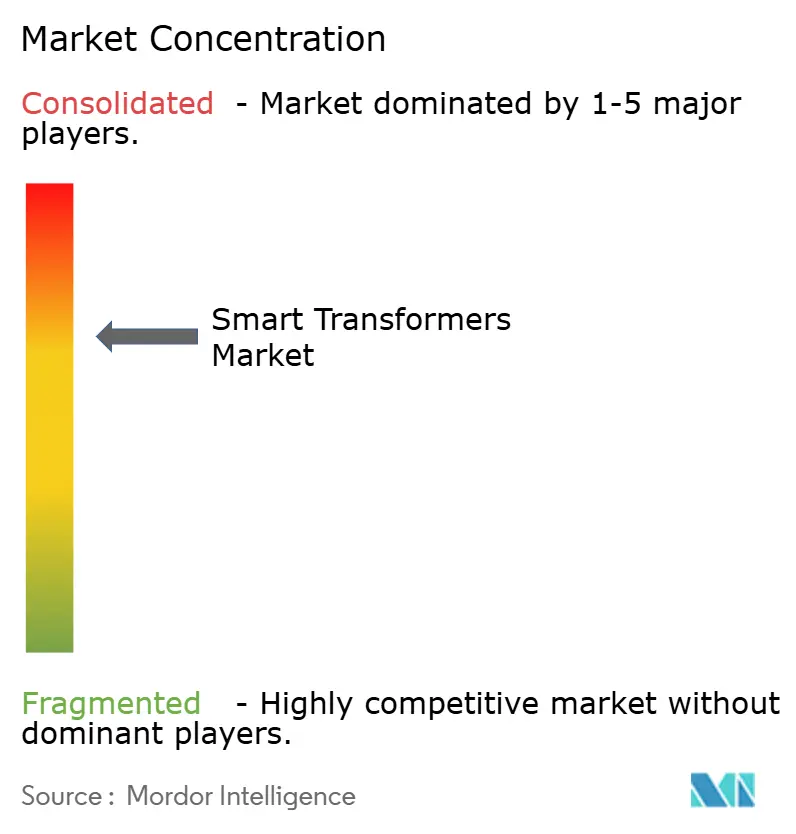
The smart transformers market exhibits moderate concentration; ABB, Siemens, Hitachi Energy, Schneider Electric, and General Electric collectively own 48% of 2025 revenue. Regional challengers such as TBEA, Hyosung, and CG Power win distribution-class tenders by bundling IoT gateways with competitively priced cores. Software monetization is now strategic: recurring analytics revenue already tops 12% of transformer segment sales at leading suppliers, boasting gross margins above 65%.
Strategic moves center on capacity expansion and joint ventures. Hitachi Energy is spending USD 450 million to double Indian output, while Siemens and Schneider pool data from 28,000 units to train predictive models. Semiconductor firms like Wolfspeed are integrating downstream through solid-state transformer JVs, compressing value-chain layers. Patent filings surged in 2024 as ABB and Hitachi Energy protect solid-state topologies and fiber-optic sensor innovations.
Cybersecurity credentials differentiate bids in North America and Europe, where utilities face mandatory encrypted SCADA requirements. Vertical integration, captive steel or wafer production, provides 8-12-week lead-time advantages and buffers commodity volatility. The landscape is bifurcating: scale players monetize installed-base data, while niche specialists target harsh-environment, mobile, or ultra-high-voltage segments with customization premiums.
Smart Transformers Industry Leaders
ABB Ltd.
Siemens AG
Schneider Electric SE
General Electric Company
Hitachi Energy Ltd.
- *Disclaimer: Major Players sorted in no particular order

Recent Industry Developments
- February 2026: CA – IONATE and JST have announced their collaboration to introduce the Hybrid Intelligent Transformer (HIT) to the U.S. market. According to the companies, this technology is designed to provide industrial facilities, data centers, and grid operators with enhanced control over increasingly volatile power flows.
- December 2025: Engineers in China have unveiled the globe's largest and most potent smart direct current (DC) transformer, with a capacity of 750 million volt-amperes (MVA). This innovation aims to stabilize the integration of renewable energy and bolster the national power grid.
- October 2025: WattEV announced the launch of its Solid-State Transformer (SST), a compact Medium Voltage Power Conversion System (MV-PCS) aimed at facilitating the deployment of MCS fast chargers. Partially funded by the California Energy Commission (CEC), the MV-PCS serves as a replacement for traditional step-down transformers, switchgear, and low-voltage rectifiers.
- September 2025: The Brazilian motor manufacturer WEG announced an investment of USD 77 million in a U.S. facility to produce specialty transformers. The company aims to increase the plant's capacity by 50%, driven by the growing demand for artificial intelligence applications in the U.S.


Global Smart Transformers Market Report Scope
The smart transformers market is segmented by type, component, voltage class, insulation, phase, rating (MVA), application, end-user, and geography. By type, the market is segmented into distribution transformers and power transformers. By component, the market is segmented into hardware, software and analytics, and services. By voltage class, the market is segmented into distribution (below 69 kV), sub-transmission (69 to 138 kV), high voltage (138 to 345 kV), and extra-high/ultra-high voltage (above 345 kV). By insulation, the market is segmented into oil-immersed, dry-type, and solid-state/power-electronics-based transformers. By phase, the market is segmented into single-phase and three-phase. By rating (MVA), the market is segmented into below 500 MVA (low), 501 to 800 MVA (medium), and 801 to 1200 MVA (high). By application, the market is segmented into smart grid, traction locomotive, EV fast-charge infrastructure, industrial power-quality systems, and others. By end-user, the market is segmented into utilities, commercial and industrial, and residential sectors. The report also covers market size estimates and forecasts for the smart transformers market across major countries in these regions. For each segment, market sizing and forecasts have been provided in terms of value (USD).
By Type
| Distribution Transformers |
| Power Transformers |
By Component
| Hardware |
| Software and Analytics |
| Services |
By Voltage Class
| Distribution (Below 69 kV) |
| Sub-Transmission (69 to 138 kV) |
| High (138 to 345 kV) |
| Extra-High/Ultra (Above 345 kV) |
By Insulation
| Oil-Immersed |
| Dry-Type |
| Solid-State/Power-Electronics-Based |
By Phase
| Single-Phase |
| Three-Phase |
By Rating (MVA)
| Below 500 MVA (Low) |
| 501 to 800 MVA (Medium) |
| 801 to 1200 MVA (High) |
By Application
| Smart Grid |
| Traction Locomotive |
| EV Fast-Charge Infrastructure |
| Industrial Power-Quality Systems |
| Others |
By End-User
| Utilities |
| Commercial and Industrial |
| Residential |
By Geography
| North America | United States |
| Canada | |
| Mexico | |
| Europe | Germany |
| United Kingdom | |
| France | |
| Italy | |
| Russia | |
| Rest of Europe | |
| Asia-Pacific | China |
| India | |
| Japan | |
| South Korea | |
| ASEAN Countries | |
| Rest of Asia-Pacific | |
| South America | Brazil |
| Argentina | |
| Rest of South America | |
| Middle East and Africa | Saudi Arabia |
| United Arab Emirates | |
| South Africa | |
| Egypt | |
| Rest of Middle East and Africa |
| By Type | Distribution Transformers | |
| Power Transformers | ||
| By Component | Hardware | |
| Software and Analytics | ||
| Services | ||
| By Voltage Class | Distribution (Below 69 kV) | |
| Sub-Transmission (69 to 138 kV) | ||
| High (138 to 345 kV) | ||
| Extra-High/Ultra (Above 345 kV) | ||
| By Insulation | Oil-Immersed | |
| Dry-Type | ||
| Solid-State/Power-Electronics-Based | ||
| By Phase | Single-Phase | |
| Three-Phase | ||
| By Rating (MVA) | Below 500 MVA (Low) | |
| 501 to 800 MVA (Medium) | ||
| 801 to 1200 MVA (High) | ||
| By Application | Smart Grid | |
| Traction Locomotive | ||
| EV Fast-Charge Infrastructure | ||
| Industrial Power-Quality Systems | ||
| Others | ||
| By End-User | Utilities | |
| Commercial and Industrial | ||
| Residential | ||
| By Geography | North America | United States |
| Canada | ||
| Mexico | ||
| Europe | Germany | |
| United Kingdom | ||
| France | ||
| Italy | ||
| Russia | ||
| Rest of Europe | ||
| Asia-Pacific | China | |
| India | ||
| Japan | ||
| South Korea | ||
| ASEAN Countries | ||
| Rest of Asia-Pacific | ||
| South America | Brazil | |
| Argentina | ||
| Rest of South America | ||
| Middle East and Africa | Saudi Arabia | |
| United Arab Emirates | ||
| South Africa | ||
| Egypt | ||
| Rest of Middle East and Africa | ||


Key Questions Answered in the Report
What is the projected CAGR for the Smart Transformers market between 2026 and 2031?
Global revenue is forecast to rise at 14.95% CAGR over 2026-2031.
How large will worldwide Smart Transformers revenue be by 2031?
Sales are expected to reach USD 8.95 billion in 2031.
Which region is forecast to post the quickest growth in Smart Transformers demand?
Asia-Pacific leads with a projected 16.7% CAGR through 2031.
Who currently dominate the competitive landscape for Smart Transformers?
ABB, Siemens, Hitachi Energy, Schneider Electric, and General Electric together hold about 48% of 2025 sales.
How long is the typical payback period for a smart transformer purchase in North America after federal tax credits?
The 30% Inflation Reduction Act credit trims payback from nine years to under six.
Page last updated on:


