Wave Energy Market Size and Share
Market Overview
| Study Period | 2021 - 2031 |
|---|---|
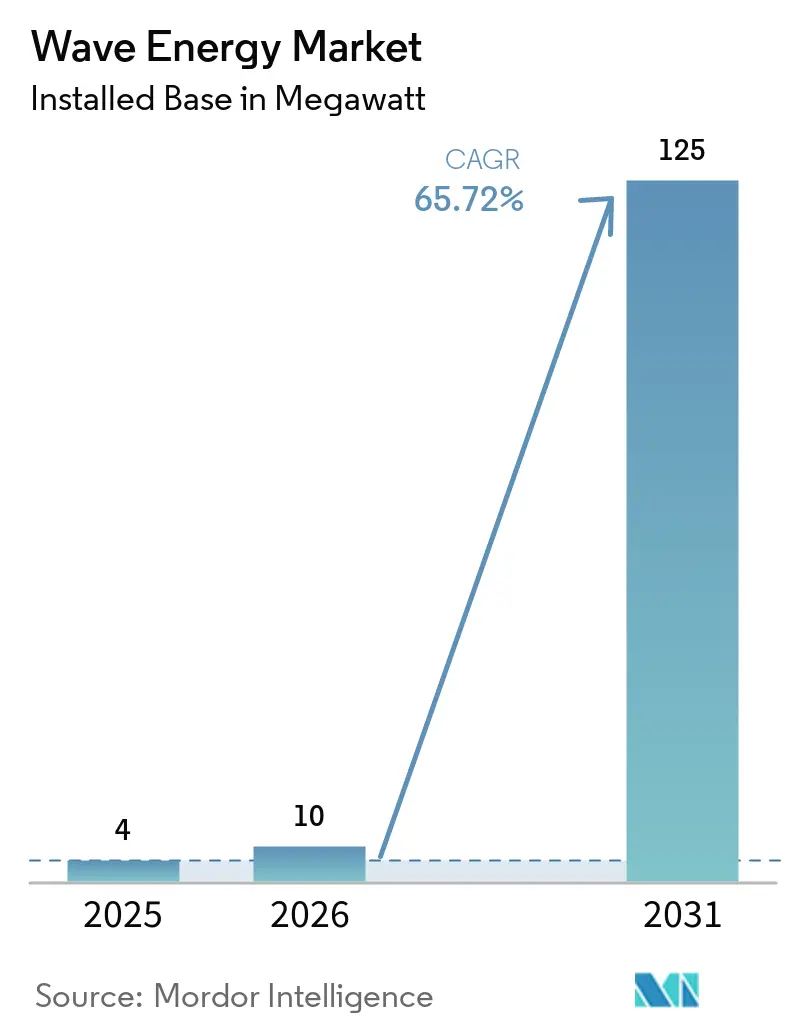
| Market Volume (2026) | 10 megawatt |
| Market Volume (2031) | 125 megawatt |
| Growth Rate (2026 - 2031) | 65.72% CAGR |
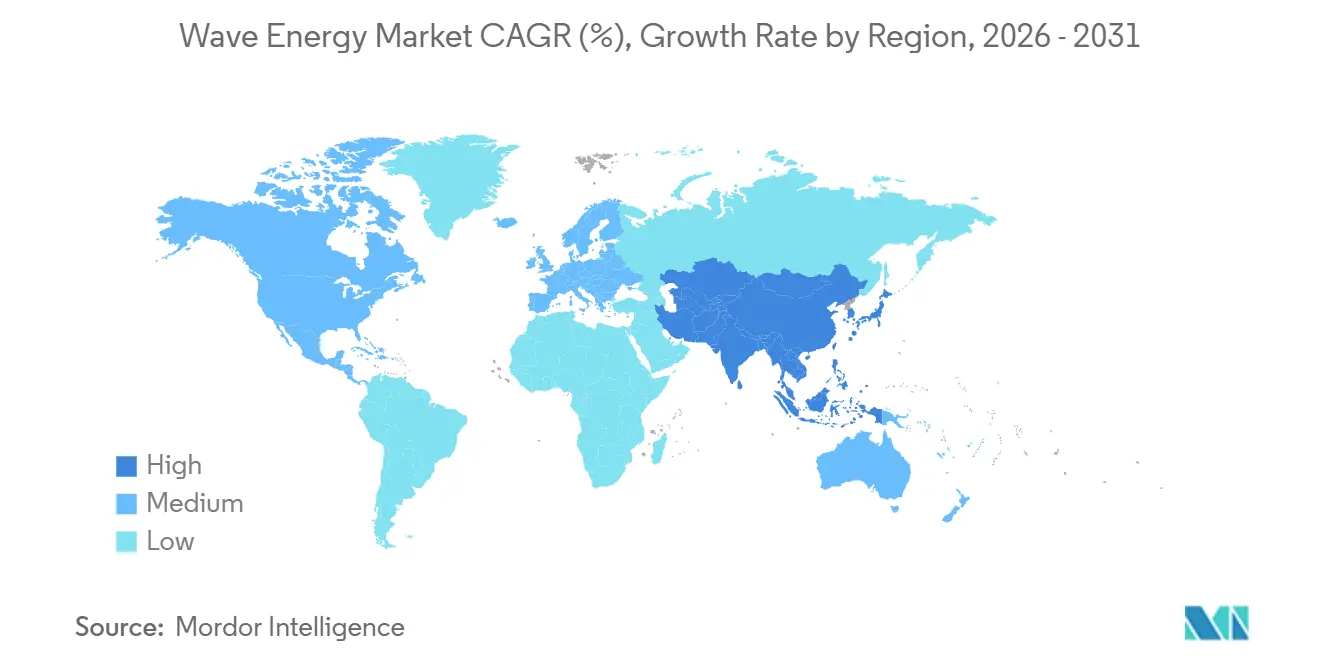
| Fastest Growing Market | Asia Pacific |
| Largest Market | Europe |
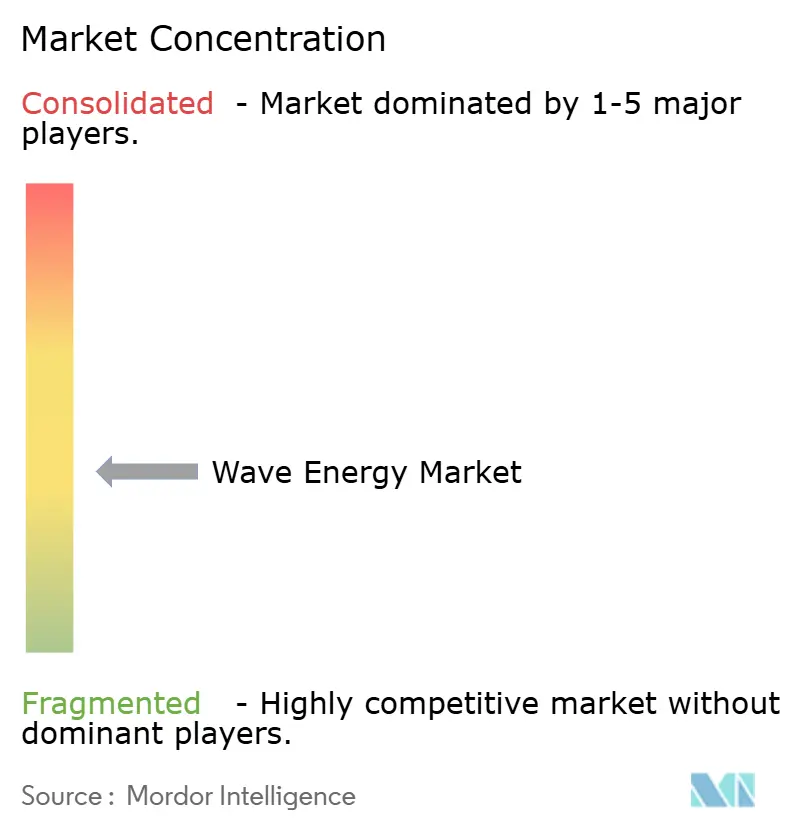
| Market Concentration | Medium |
Major Players *Disclaimer: Major Players sorted in no particular order Image © Mordor Intelligence. Reuse requires attribution under CC BY 4.0. | |
Wave Energy Market Analysis by Mordor Intelligence
The Wave Energy Market size in terms of installed base is projected to be 4 megawatt in 2025, 10 megawatt in 2026, and reach 125 megawatt by 2031, growing at a CAGR of 65.72% from 2026 to 2031. Government-backed feed-in tariffs and contract-for-difference schemes across the European Union and Asia-Pacific are anchoring the first commercial arrays, while private capital is accelerating demonstration projects that prove bankability. Modular power-take-off designs, composite hulls, and real-time control software are driving rapid cost declines, reducing both capital outlay and maintenance downtime. Early adopters are pairing wave devices with desalination, offshore oil and gas platform electrification, and Power-to-X hubs to monetize predictable swells where grid extensions are either slow or costly. The wave energy market is also benefiting from marine spatial-planning frameworks that carve out pre-consented zones, shortening permit windows and lowering holding costs.
Key Report Takeaways
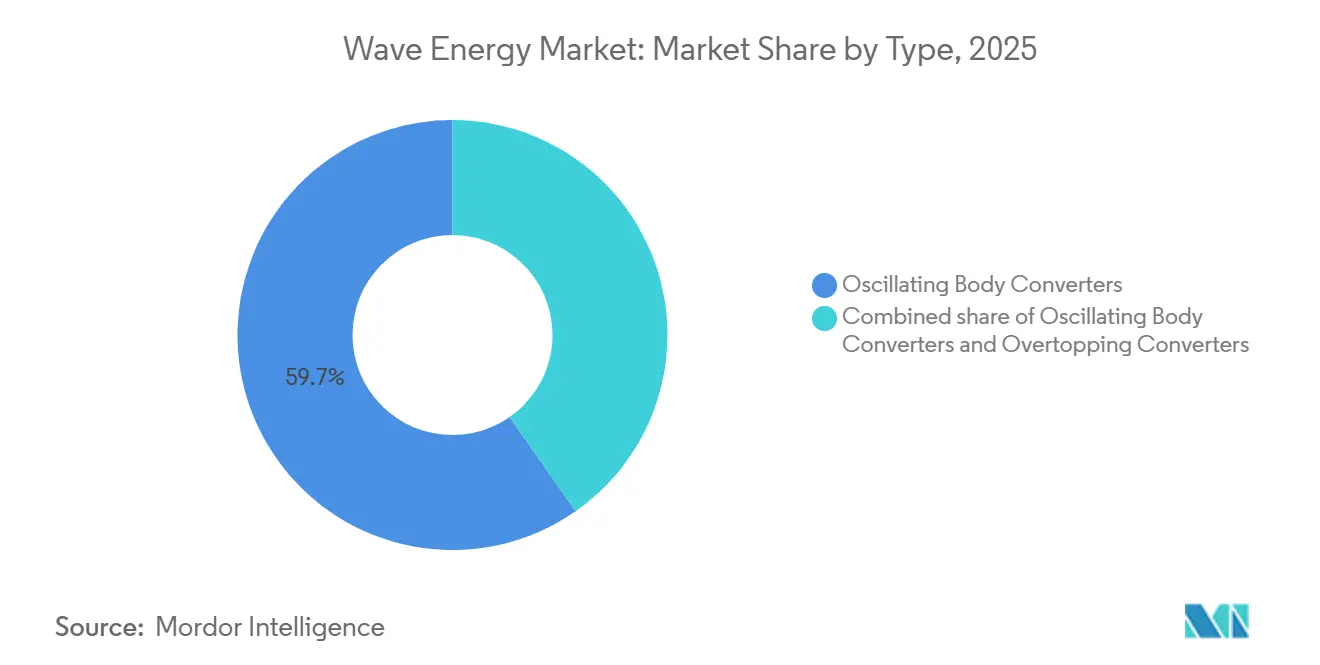
- By type, oscillating body converters held 59.7% of the wave energy market share in 2025 and are projected to post a 93.5% CAGR through 2031.
- By deployment location, onshore breakwater sites accounted for 60.5% of the wave energy market size in 2025, while offshore shallow-shelf projects are advancing at a 90.9% CAGR over 2026-2031.
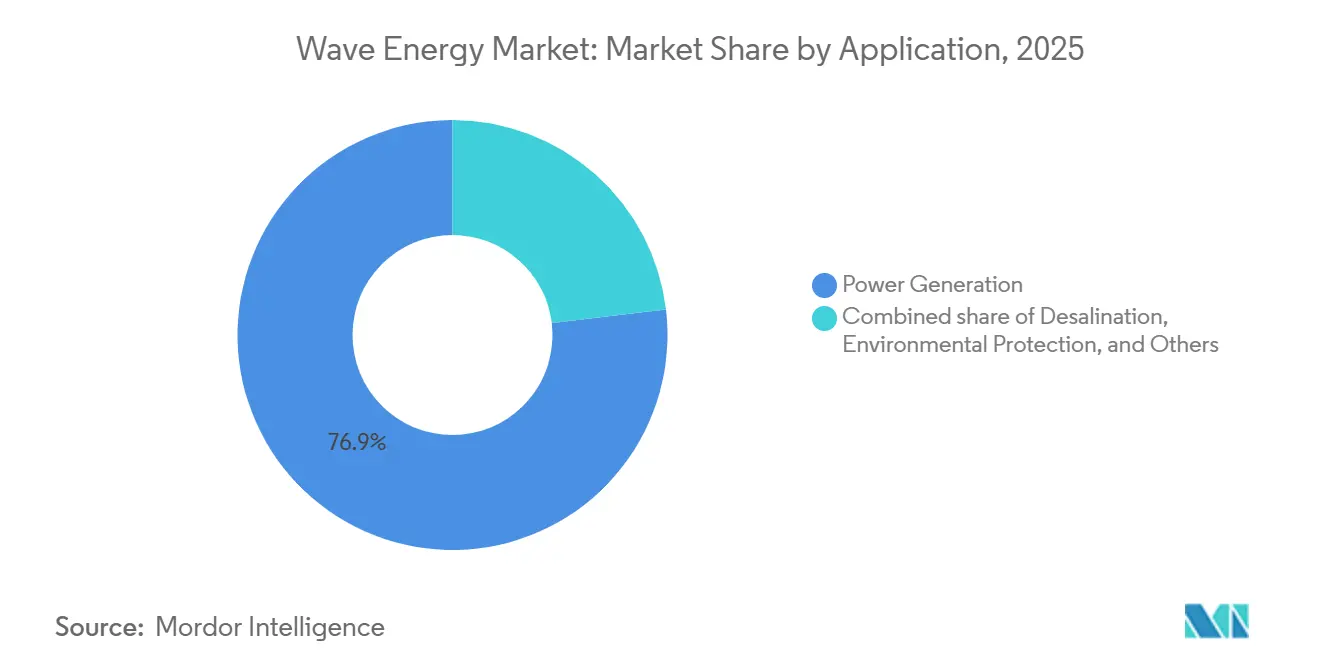
- By application, power generation led with 76.9% revenue share in 2025; desalination is forecast to expand at an 87.2% CAGR to 2031.
- By geography, Europe retained 75.1% of installed capacity in 2025, whereas Asia-Pacific records the fastest growth at an 84.4% CAGR through 2031.
Note: Market size and forecast figures in this report are generated using Mordor Intelligence’s proprietary estimation framework, updated with the latest available data and insights as of January 2026.
Global Wave Energy Market Trends and Insights
Drivers Impact Analysis*
| Driver | (%) Impact on CAGR Forecast | Geographic Relevance | Impact Timeline |
|---|---|---|---|
| Feed-in-tariff & contract-for-difference schemes expand in EU & APAC | +12.5% | United Kingdom, France, Spain, Ireland, Portugal, Taiwan, India | Medium term (2-4 years) |
| Demand for ocean-sourced baseload renewables to balance wind and solar | +10.8% | Island grids globally, offshore oil and gas platforms | Long term (≥4 years) |
| Cost decline from composite structures and modular PTOs | +14.2% | Scandinavia, United Kingdom R&D clusters | Medium term (2-4 years) |
| Rising venture and infrastructure-fund investments in demonstrator arrays | +9.7% | European Union, North America, Asia-Pacific | Short term (≤2 years) |
| Power-to-X hubs integrating wave devices | +8.3% | North Sea, Australia, Chile, Oman | Long term (≥4 years) |
| Decarbonization mandates for offshore oil and gas platforms | +7.1% | North Sea, Gulf of Mexico, Brazil, Southeast Asia | Medium term (2-4 years) |
| Source: Mordor Intelligence | |||
Feed-in-tariff & Contract-for-difference Schemes Expand in EU & APAC
Member-state targets under the European Renewable Energy Directive III require that 5% of new renewable capacity between 2025 and 2030 come from innovative sources, explicitly naming wave technologies.[1]European Union, “Renewable Energy Directive III,” EUR-LEX.EUROPA.EU Ireland’s Marine Energy Programme, Horizon Europe grants, and Taiwan’s first contract-for-difference agreement for wave power create predictable revenue streams that derisk early projects. These incentives shorten payback periods, attract venture backing, and move the wave energy market from prototype trials to pre-commercial clusters. Developers in India and Portugal are already securing long-term tariffs at premiums that mirror early offshore-wind support schemes. The success of these frameworks is prompting other Asia-Pacific governments to draft similar support mechanisms, enlarging the investable project pipeline.
Demand for Ocean-Sourced Baseload Renewables to Balance Wind and Solar
Wave devices deliver capacity factors of 25-35% today and up to 40-48% in optimized forecasts, smoothing supply during solar and wind lulls.[2]California Energy Commission, “Senate Bill 605 Assessment,” ENERGY.CA.GOV Island grids in Hawaii, the Canary Islands, and King Island deploy wave arrays to displace diesel generation without relying on large battery systems. U.S. federal programs such as the Waves to Water Prize fund off-grid desalination buoys that use direct mechanical pressure rather than grid electricity. Commercial operators of remote mining and aquaculture sites adopt wave energy to cut fuel logistics and lower emissions penalties. Collectively, these baseload applications widen the customer base and accelerate scale economies for the wave energy market.
Cost Decline from Composite Structures & Modular PTOs
Capital expenditure per kilowatt must fall from USD 25,061 in 2026 to USD 2025 by 2050 for parity with offshore wind.[3]MDPI, “Wave Energy Converters: Technology and Economics,” MDPI.COM Composite materials trim hull weight by up to 40%, easing transport and mooring loads. Horizon Europe’s MEGA WAVE project has demonstrated magnetic-gear PTOs that raise generator efficiency by 10%. CorPower Ocean reports a five-fold energy-capture boost through phase-control algorithms, validating real-time tuning strategies. As modular PTOs enter serial manufacture, spare parts commonality drops service intervals and increases availability. These factors together improve project economics, extending the addressable market beyond subsidized pilots.
Rising Venture & Infrastructure Fund Investments in Demonstrator Arrays
Series B rounds and EU Innovation Fund grants have delivered more than USD 93.6 million to leading European developers since 2024.[4]CorPower Ocean AB, “Wave Energy Converter Technology,” CORPOWEROCEAN.COM In Latin America, a USD 1 billion commitment in Brazil backs a 550 MW pipeline that will rely on local supply chains to avoid currency risk. Canada, Japan, and Argentina are channeling public grants toward TRL-7 and TRL-8 demonstrations, advancing devices toward bankable status. Specialized infrastructure funds are crafting lease models reminiscent of solar third-party ownership, lowering balance-sheet stress for technology firms. This influx of blended finance shortens the technology-learning curve and builds confidence in the global wave energy market.
Restraints Impact Analysis*
| Restraint | (%) Impact on CAGR Forecast | Geographic Relevance | Impact Timeline |
|---|---|---|---|
| High CAPEX and LCOE gap versus mature renewables | -8.4% | India, Indonesia, Philippines | Short term (≤2 years) |
| Grid interconnection & multi-agency permitting hurdles | -5.9% | North America, European Union, Asia-Pacific | Medium term (2-4 years) |
| Marine-spatial conflict with deep-sea mining zones | -3.2% | Pacific, Atlantic, Indian Ocean | Long term (≥4 years) |
| Shortage of specialized far-shore maintenance vessels & crew | -4.7% | Asia-Pacific, Latin America | Medium term (2-4 years) |
| Source: Mordor Intelligence | |||
High CAPEX & LCOE Gap Versus Mature Renewables
Wave energy’s 2025 levelized cost of USD 388-618 MWh is three to six times that of utility-scale solar, deterring merchant investments. Learning-curve studies by NREL show costs may drop to USD 0.07-0.13 kWh by 2050, conditional on multi-gigawatt roll-outs. Early adopters, therefore, depend on tariffs exceeding USD 351 MWh or direct capital subsidies. In emerging markets, willingness to pay is below USD 0.10 kWh, widening the financing gap. Without continued policy support, the wave energy market risks stalling before economies of scale can unlock parity.
Grid Interconnection & Multi-Agency Permitting Hurdles
Projects such as PacWave South required approvals from at least six U.S. federal agencies, with timelines exceeding 36 months. Similar multi-agency reviews in Taiwan and Spain slow sub-100 MW arrays that need rapid execution to meet investor hurdle rates. The absence of pre-consented marine-energy zones adds study costs and extends seabed lease negotiations. Developers recommend the adoption of the U.K. Crown Estate model, which cut offshore-wind consent times by half. Until such frameworks spread globally, the permitting bottleneck will temper growth in the wave energy market.
*Our forecasts treat driver/restraint impacts as directional, not additive. The impact forecasts reflect baseline growth, mix effects, and variable interactions.
Segment Analysis
By Type: Point Absorbers Gain Momentum
Oscillating body converters, mainly point absorbers, captured 59.7% of installed capacity in 2025. The wave energy market size for this segment is on course to grow at a 93.5% CAGR, supported by serial production of standardized modules. Phase-control algorithms in devices such as HiWave-5 have lifted energy-capture ratios, helping investors view the technology as near-commercial. The segment’s rising reliability underpins a broader shift from survivability testing to revenue-focused deployments.
Demand for point absorbers is reinforced by their flexible mooring options, making them suitable for both breakwater retrofits and shallow-shelf foundations. Composite cladding extends service lives in corrosive marine environments, limiting downtime to scheduled annual inspections. These improvements lower the cost of insurance and financing, securing a durable lead for oscillating body converters within the wave energy market.


By Deployment Location: Shallow Shelf Accelerates
Onshore breakwaters dominated early roll-outs, claiming 60.5% of 2025 capacity thanks to simplified permitting and grid proximity. However, shallow-shelf sites 2-20 km offshore are advancing at a 90.9% CAGR, and their share of the wave energy market size is projected to overtake onshore installations after 2028. These sites combine higher wave power density with manageable foundation costs, making yields more compelling for utilities.
Resource assessments in Portugal, California, and Scotland confirm that the 25-60 m depth band offers 30-50 kW m-¹ of wave energy, enough to support multi-megawatt clusters. Developers also avoid conflicts with recreation and fisheries nearer the coast. As specialist vessels and dynamic-cable crews mature, shallow-shelf uptime is converging on near-shore benchmarks, cementing the segment’s long-run growth trajectory.
By Application: Desalination Emerges as a High-Growth Niche
Power generation held 76.9% revenue share in 2025, but desalination is forecast to record an 87.2% CAGR, the fastest within the wave energy market. Islands and arid coastal zones view wave-powered reverse osmosis as a route to water security without adding grid demand. EU-funded pilots in the Canary Islands and U.S. Department of Energy prize winners demonstrate competitive specific-energy consumption of 2-3.5 kWh m-³.
Wave-based desalination also unlocks carbon-credit revenue streams under emerging blue-water frameworks. Standardized buoy-mounted units can be redeployed as freshwater needs shift, a flexibility grid-tied plants lack. Together, these factors move desalination from curiosity to bankable segment, diversifying revenue for the wave energy market.
Geography Analysis
Europe anchors the wave energy market with 75.1% of installed capacity in 2025. Robust policy support under Renewable Energy Directive III, plus Horizon Europe’s USD 273.78 million marine-energy budget, ensures a steady queue of 1-10 MW arrays, feeding a regional supply chain that now exports components to Asia-Pacific. The United Kingdom, Ireland, and Portugal each combine feed-in premiums with test-site infrastructure, accelerating learning rates.
Asia-Pacific shows the fastest growth, charting an 84.4% CAGR through 2031, powered by India’s 40 GW theoretical potential, Taiwan’s 20 MW medium-term target, and Japan’s NEDO-backed demonstrations. Local oil and gas majors in Indonesia and Malaysia are trialing co-location concepts, providing anchor customers for early arrays. China’s Beibu Gulf cavity revetment system reports levelized costs near grid parity, proving feasibility in low-labor-cost markets.
North America, South America, and the Middle East are emerging frontiers. California’s Senate Bill 605 flags 37 GW of state coastal resources, yet only PacWave South is fully permitted. Brazil’s USD 1 billion Santa Catarina initiative exemplifies sovereign-wealth backing aimed at import substitution. Saudi Arabia’s NEOM evaluates Red Sea prototypes within its 120 GW 2032 renewable commitment, potentially opening a new high-insolation yet wave-rich geography to hybrid solutions.

Competitive Landscape
No developer surpasses 10% market share, placing the wave energy market in a fragmented phase that rewards engineering breakthroughs and rapid cost decline. CorPower Ocean and Eco Wave Power demonstrate contrasting strategies: vertically integrated manufacturing versus breakwater co-location, but both leverage proven uptime to attract capital. Venture rounds now exceed USD 35.1 million per deal, signaling investor confidence.
Standardization is emerging via IEC Technical Committee 114 design codes, lowering insurance premiums and widening project-finance options. Technology licensors that focus on modular PTOs can penetrate faster than turnkey developers, as seen in partnership models adopted by Mocean Energy and Wello Oy. Regionally integrated supply chains in Brazil and China aim to localize content, potentially shifting cost leadership southward once domestic projects scale.
White-space opportunities extend to desalination, offshore platform power, and Power-to-X hubs. Companies with flexible architectures and proven remote-monitoring platforms are best placed to win these niches. The competitive field, therefore, re remains dynamic, with consolidation likely only after multi-megawatt commercial arrays deliver three-year track records.
Wave Energy Industry Leaders
CorPower Ocean AB
Ocean Power Technologies
Eco Wave Power Ltd.
AW-Energy Oy
Bombora Wave Power Pty Ltd.
- *Disclaimer: Major Players sorted in no particular order

Recent Industry Developments
- March 2026: Eco Wave Power reported a 404.7 MW global pipeline in its SEC Form 20-F, confirming zero downtime at Jaffa Port since early 2025
- February 2026: Eco Wave Power signed a letter of intent with Wavefront Asset Management to finance equipment for upcoming Portuguese and Israeli projects.
- December 2025: Brazil’s National Institute of Oceanic Research received BRL 15 million for a Blue Energy Center to advance wave-converter R&D.
- November 2025: Argentina completed a dry test of its first full-scale device at Metalúrgica Duroll, moving toward a 2027 grid-connected launch.


Global Wave Energy Market Report Scope
Wave energy is a renewable and clean power source derived from the kinetic and potential energy of ocean surface waves. These waves, formed by wind moving across the ocean surface, are harnessed using specialized technologies such as floating buoys, oscillating water columns, or oscillating wave surge converters, which transform the wave motion into electricity.
The Wave Energy Market is segmented into type, deployment location, application, and geography. By type, the market is segmented into oscillating water column, oscillating body converters, and overtopping converters. By deployment location, the market is segmented into onshore, near-shore, offshore shallow shelf, and offshore deep water installations. By application, the market is segmented into power generation, desalination, environmental protection, and other applications. The report also covers the market size and forecasts for the wave energy market across major regions, including North America, Europe, Asia-Pacific, South America, and the Middle East and Africa. For each segment, the market sizing and forecasts have been done on the basis of volume (MW).
| Oscillating Water Column |
| Oscillating Body Converters |
| Overtopping Converters |
| Onshore (fixed breakwater) |
| Near-shore (Up to 2 km, Over 25 m depth) |
| Offshore - Shallow Shelf (2 to 20 km, 25 to 60 m) |
| Offshore - Deep Water (More than 20 km, More than 60 m) |
| Power Generation |
| Desalination |
| Environmental Protection (breakwaters, reef restoration) |
| Others |
| North America | United States |
| Canada | |
| Mexico | |
| Europe | United Kingdom |
| France | |
| Spain | |
| Netherland | |
| Denmark | |
| Russia | |
| Rest of Europe | |
| Asia-Pacific | China |
| India | |
| Japan | |
| South Korea | |
| ASEAN Countries | |
| Australia and New Zealand | |
| Rest of Asia-Pacific | |
| South America | Brazil |
| Argentina | |
| Colombia | |
| Rest of South America | |
| Middle East and Africa | United Arab Emirates |
| Saudi Arabia | |
| South Africa | |
| Egypt | |
| Rest of Middle East and Africa |
| By Type | Oscillating Water Column | |
| Oscillating Body Converters | ||
| Overtopping Converters | ||
| By Deployment Location | Onshore (fixed breakwater) | |
| Near-shore (Up to 2 km, Over 25 m depth) | ||
| Offshore - Shallow Shelf (2 to 20 km, 25 to 60 m) | ||
| Offshore - Deep Water (More than 20 km, More than 60 m) | ||
| By Application | Power Generation | |
| Desalination | ||
| Environmental Protection (breakwaters, reef restoration) | ||
| Others | ||
| By Geography | North America | United States |
| Canada | ||
| Mexico | ||
| Europe | United Kingdom | |
| France | ||
| Spain | ||
| Netherland | ||
| Denmark | ||
| Russia | ||
| Rest of Europe | ||
| Asia-Pacific | China | |
| India | ||
| Japan | ||
| South Korea | ||
| ASEAN Countries | ||
| Australia and New Zealand | ||
| Rest of Asia-Pacific | ||
| South America | Brazil | |
| Argentina | ||
| Colombia | ||
| Rest of South America | ||
| Middle East and Africa | United Arab Emirates | |
| Saudi Arabia | ||
| South Africa | ||
| Egypt | ||
| Rest of Middle East and Africa | ||


Key Questions Answered in the Report
What is the projected capacity of the wave energy market by 2031?
Installed capacity is forecast to reach 125 MW by 2031, up from 10 MW in 2026.
Which segment is growing fastest within wave energy?
Desalination applications post an 87.2% CAGR, the highest among all end uses through 2031.
How do government policies support commercialization?
Feed-in tariffs and contract-for-difference schemes in Europe and Asia-Pacific guarantee premium prices that de-risk early projects.
Which geographic region shows the highest growth?
Asia-Pacific leads with an 84.4% CAGR, driven by pilots in India, Taiwan, Indonesia, and Japan.
Why are shallow-shelf deployments gaining popularity?
They combine stronger wave resources with acceptable foundation costs and avoid near-shore recreation conflicts, supporting a 90.9% CAGR.
Page last updated on:


